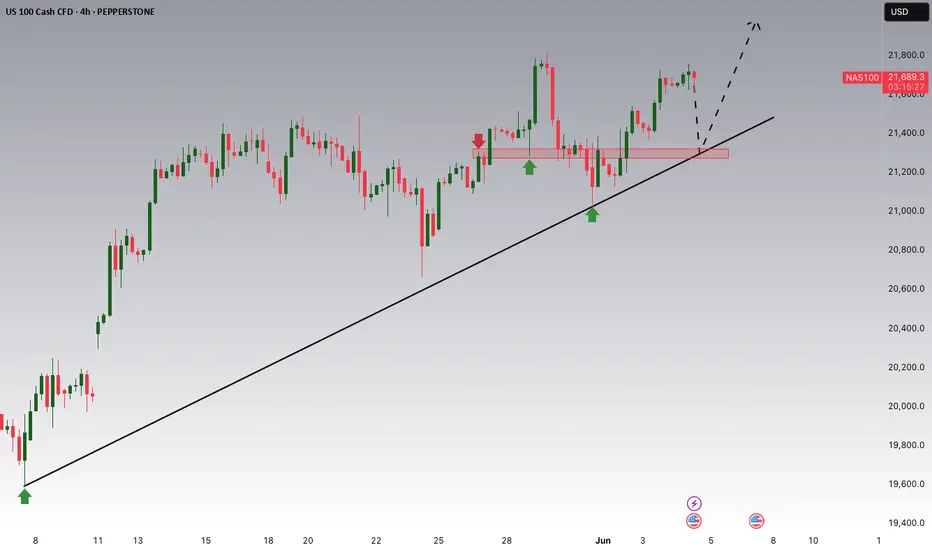
NASDAQ Potential UpsidesHey Traders, in today's trading session we are monitoring NAS100 for a buying opportunity around 21,300 zone, NASDAQ is trading in an uptrend and currently is in a correction phase in which it is approaching the trend 21,300 support and resistance area.
Trade safe, Joe.
Technical Analysis
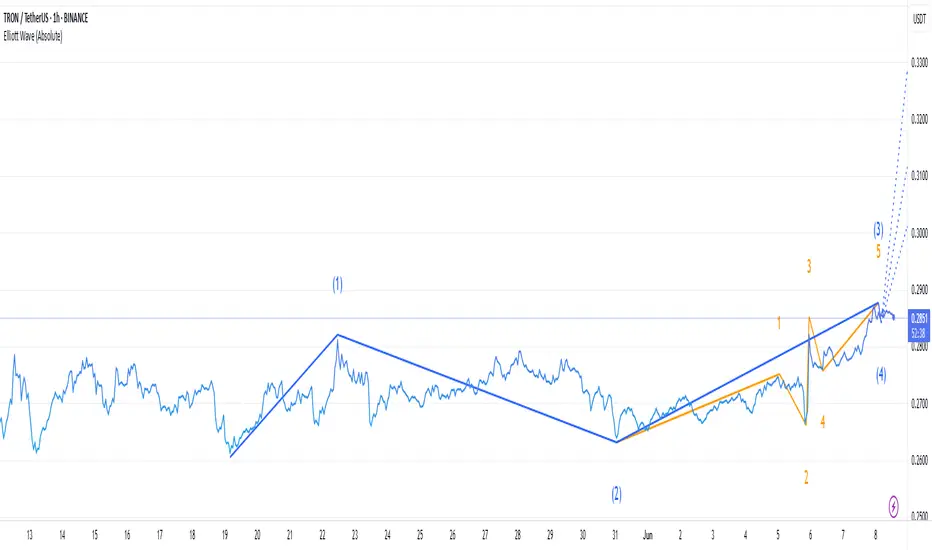
TRXUSDT at the Crossroads: Breakout or Stall?TRX is currently in the multi-leg Wave 4 consolidation, a classic corrective phase before the anticipated final Wave 5 impulsive.
This consolidation phase is healthy within the larger trend, allowing for overbought to fade before the next move higher.
A clear breakout above the $0.28–$0.30 range would affirm the Elliott Wave forecast, targeting $0.30 → $0.31 → $0.33. A confirmed close above $0.30 would unequivocally solidify the Wave 5 scenario, paving the way for these upside objectives.
The 81.77 monthly RSI suggests an overbought market, supporting the anticipation of continuous consolidation within Wave 4, potentially retracing back to the $0.25–$0.27 support zone before resuming higher.
Long-term trend indicators are firmly bullish, with the Monthly EMA (20) at $0.1911 and SMA (20) at $0.1769, both considerably below current price action, confirming unbroken upward momentum within the greater timeframes.
So while short-term price action suggests consolidation, technical stance favors continuation to the higher side, and a breakout above $0.30 would signal Wave 5's beginning and continued momentum towards $0.33.
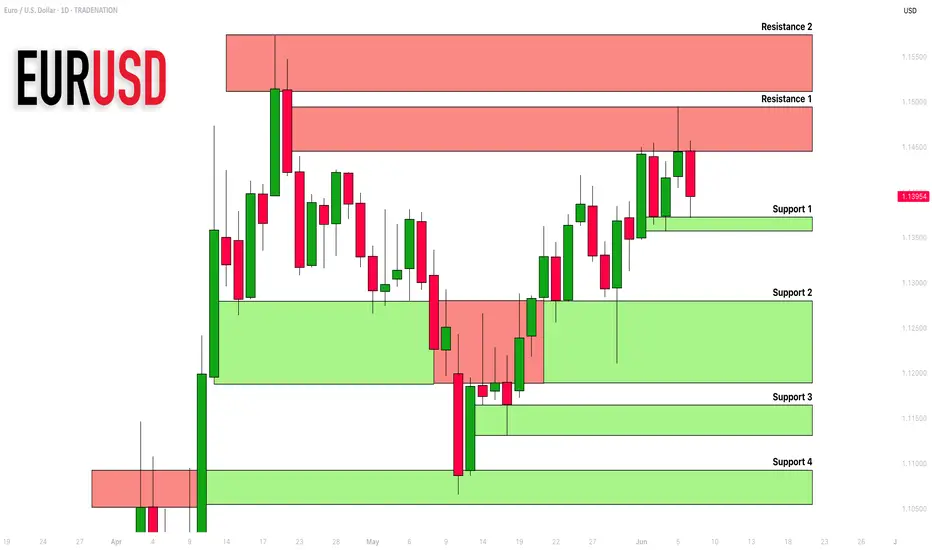
EURUSD: Support & Resistance Analysis For Next Week 🇪🇺🇺🇸
Here is my latest structure analysis
and important supports and resistances for EURUSD
for next week.
Consider these structures for pullback/breakout trading.
❤️Please, support my work with like, thank you!❤️
I am part of Trade Nation's Influencer program and receive a monthly fee for using their TradingView charts in my analysis.
TOTAL2 – Altcoin Market Cap (Weekly TF) 2025
**Summary:**
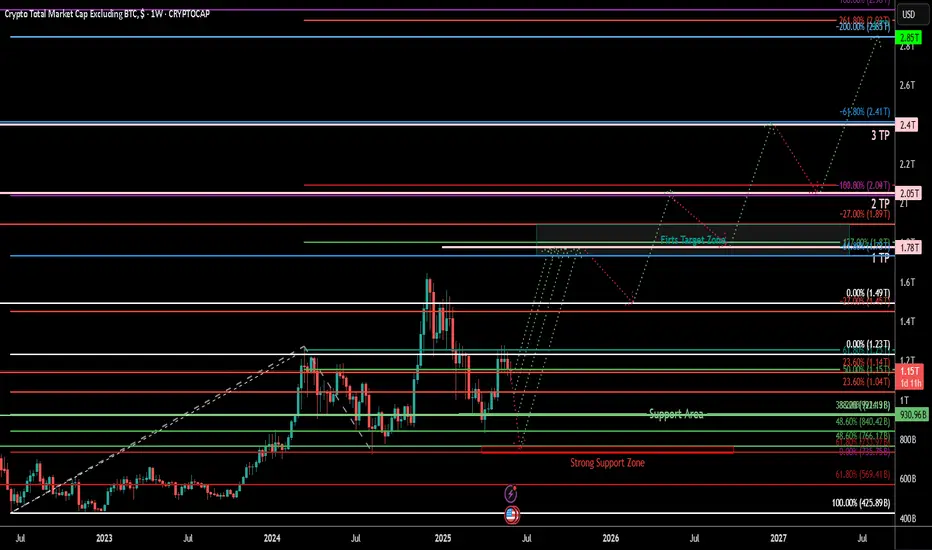
The TOTAL2 chart (crypto market cap excluding BTC) is showing a structurally bullish formation after a deep retracement and a higher low confirmation. This setup suggests a potential multi-phase rally toward 2.98T and beyond, with defined support zones and Fibonacci targets aligned with liquidity cycles. This analysis visualizes the expected roadmap based on trend-based Fibonacci extensions, retracement levels, and psychological market phases. Notably, the outlook includes the possibility of an initial correction to retest strong support zones before the market begins its ascent.
**Chart Context:**
TOTAL2 represents the aggregated market capitalization of all crypto assets excluding Bitcoin. Historically, it reflects capital rotation into altcoins, especially following BTC dominance peaks. The current chart shows strong reaccumulation above the 1T support zone, with Fibonacci confluences hinting at a sustained recovery pattern. Dotted arrows illustrate a wave-like projection of accumulation, rally, retracement, and expansion. The possibility of a near-term correction to lower support zones is also embedded in the path structure.
**Key Technical Observations: and Levels**
TP1 = 1.78T
TP2 = 2.05T
TP3 = 2.4T
TP4 = 2.85T
* **Secondary Fib Retracement :** 0% = 1.23T, 100% = 425.89B
* Key zones: 23.6% = 1.04T, 38.2% = \~840.42B, 61.8% = \~569.41B
Possible Support Levels: 1.04T, 930B, 840B, 766B, 735B,
* **Trend-Based Fib (A-B-C):** A = \~420B, B = \~1.23T, C = \~735B
* This projection aligns with TP1 at 1.78T
* **Support Area:** Around 1T psychological zone (930B)
* **Strong Support Zone:** 735 Bto775B
* **First Target Zone:** Between 1.73T and 1.89T (early resistance + Fib cluster)
**Indicators:**
* Weekly structure forming higher lows
* Long-term Fib retracements respected
* Trend-Based Extension projecting 1.618 move
* No divergence, confirming strength
**Fundamental Context:**
* Liquidity conditions are improving globally with rate cuts expected into late 2025.
* ETH and ecosystem tokens are likely to lead altcoin recovery.
* Regulatory clarity and ETF flows add legitimacy to broader crypto allocations.
* Historical alt-seasons emerge from BTC profit rotation—TOTAL2 leads that shift.
* However, several macro risks may trigger a correction before rallying:
* The Crypto Fear & Greed Index is currently high, suggesting overbought conditions.
* Macroeconomic uncertainties (e.g., inflation, rate hike fears) can suppress short-term risk appetite.
* Regulatory tightening across major jurisdictions introduces hesitation in capital deployment.
* Technical signs of a five-wave drop in BTC hint at a larger ABC correction scenario.
* DAT (Digital Asset Treasury) exposure among public firms may lead to forced liquidations during downturns.
**Philosophical or Narrative View:**
This is not just a market cycle—it's a reflection of decentralized innovation reclaiming narrative dominance. After fear-induced lows, TOTAL2's rise echoes the resilience of builders, protocols, and investor conviction. Each Fibonacci level acts like a checkpoint in the unfolding story of crypto's evolution beyond Bitcoin.
**Related Reference Charts:**
*
**Bias & Strategy Implication:**
* **Bias:** Bullish with short-term corrective risk
* **Accumulation Zone:** 1.0T–1.23T
* **Initial Risk:** Price may revisit the **Support Area (1T)** or even the **Strong Support Zone (775B–725B)** before a sustained move higher.
* **Partial TP:** 1.78T–2.05T
* **Extended TP:** 2.4T–2.98T
* Caution near TP4–Bonus zones as distribution risk increases
* Invalidated if closes below 725B (structure break)
**Notes & Disclaimers:**
This is a structural macro outlook and not financial advice. Markets are dynamic and subject to rapid shifts in sentiment, liquidity, and regulation. Always use risk management.
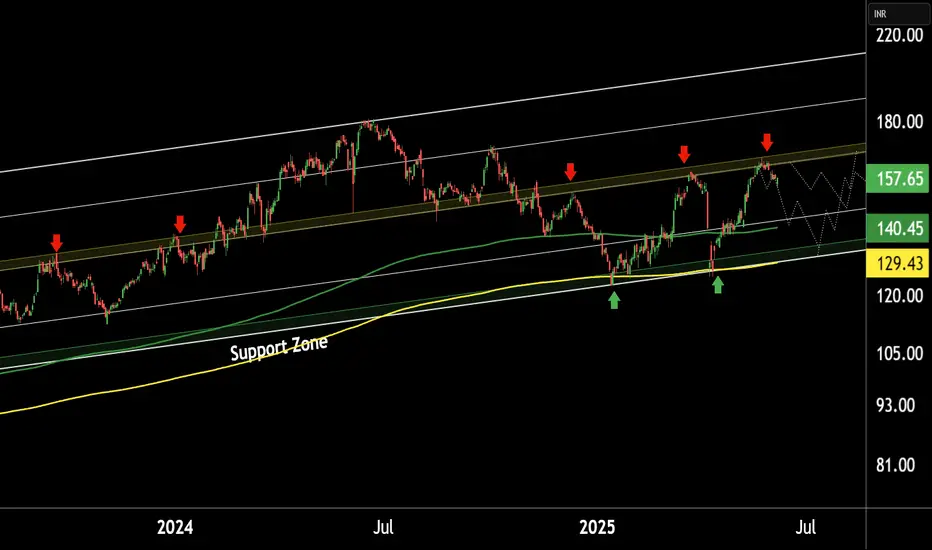
SHREE DIGVIJAY CEMENET AT LONG TERM SUPPORT ZONEThis is the Weekly chart of SHREDIGCEM.
SHREDIGCEM is trading near it's long term support zone at 60-70 range.
stock has been moving within a long-term parallel channel, with a well-established support zone in the range of ₹65–₹70.
Currently, the stock is forming a broadening pattern near its support zone, with the pattern support range between ₹70–₹75.
If this level is sustain then,we may see higher prices in SHREDIGCEM.

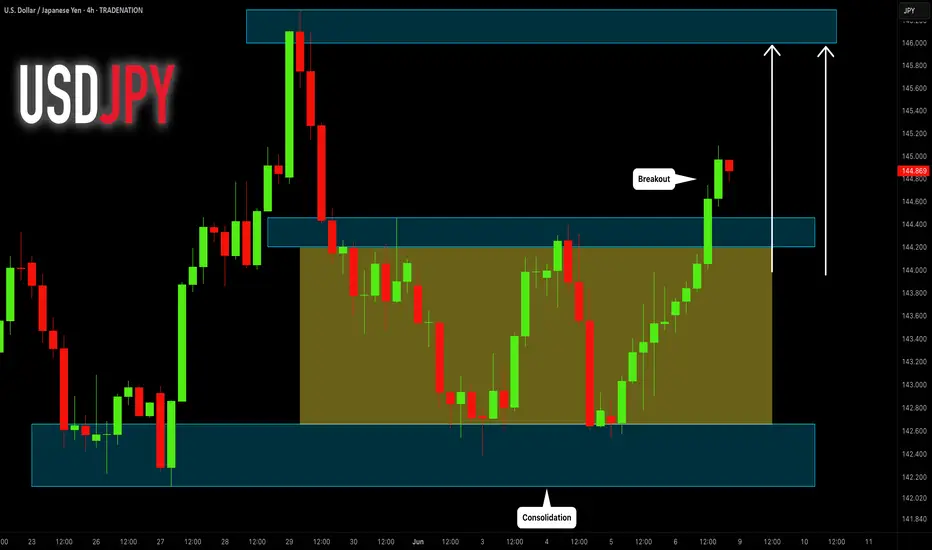
USDJPY: Bullish Outlook For Next Week Explained 🇺🇸🇯🇵
USDJPY completed a consolidation, violating
a resistance line of a horizontal range on a 4H time frame.
I believe that it provides a strong bullish confirmation signal.
The price will most likely go up and reach 146.0 level next week.
❤️Please, support my work with like, thank you!❤️
I am part of Trade Nation's Influencer program and receive a monthly fee for using their TradingView charts in my analysis.
Market Outlook – Nifty Near Critical Levels! Caution Advised
Nifty Weekly Wrap-Up:
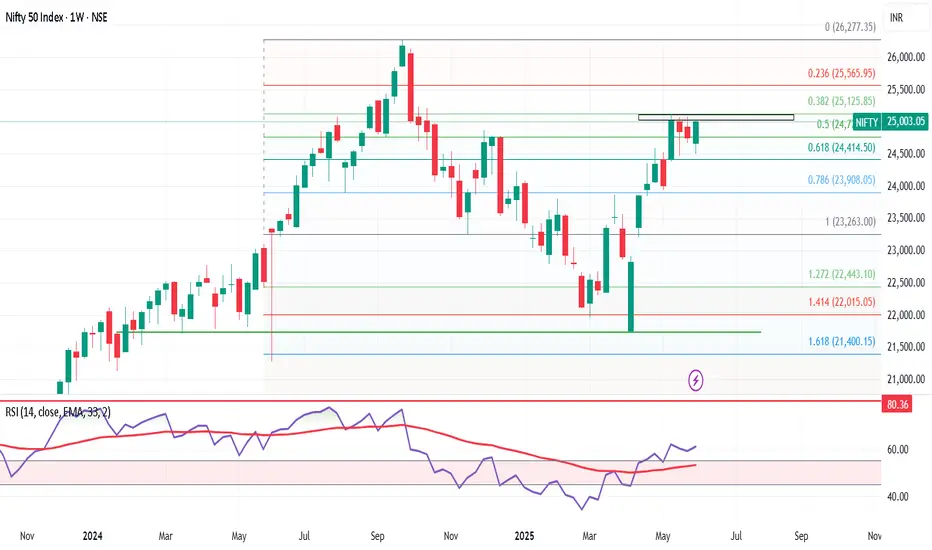
The Nifty 50 index closed the week at 25,003, posting a solid gain of +250 points from last week's close. It touched a high of 25,029 and a low of 24,502 during the week.
But here’s the twist—while the uptrend looks strong, we’re now at a crucial inflection point on the weekly chart.
Technical Outlook – Is a Bearish “M” Pattern Forming?
On the weekly timeframe, Nifty is at a level where a bearish M-pattern could potentially develop. To complete this pattern, the index could pull back towards support levels at:
24,414
24,200
24,000
If the selling deepens, the final support zone lies between 23,900–23,700, where a bounce-back is likely.
Bullish Scenario – Can Nifty Break Out?
If Nifty holds above 25,000 for at least 2 consecutive sessions, it could trigger a short-covering rally, paving the way for a move toward key resistance zones at:
25,400
25,565
26,100
Next Week’s Expected Range: 24,500 – 25,500
This range should see most of the action next week. If you're holding long positions, now is a great time to:
✔️ Lock in profits
✔️ Trail stop-losses
✔️ Prepare cash reserves for potential dip-buying opportunities
Global Watch – S&P 500 Hits Key Resistance
The S&P 500 closed near 6,000, up 100 points for the week. But heads up—it’s now testing a strong Fibonacci resistance at 6,013.
A rejection here could lead to a correction toward 5,900–5,850, a dip of 1.5–2.5%. If this unfolds alongside a Nifty pullback, it would align perfectly with our support targets around 24,400–24,500.
Final Takeaway:
Markets are looking stretched. While momentum remains positive, profit booking at higher levels is essential. Don’t get caught unprepared in case of a reversal. Stay tactical, stay liquid.
Smart money is already locking in gains. Are you?
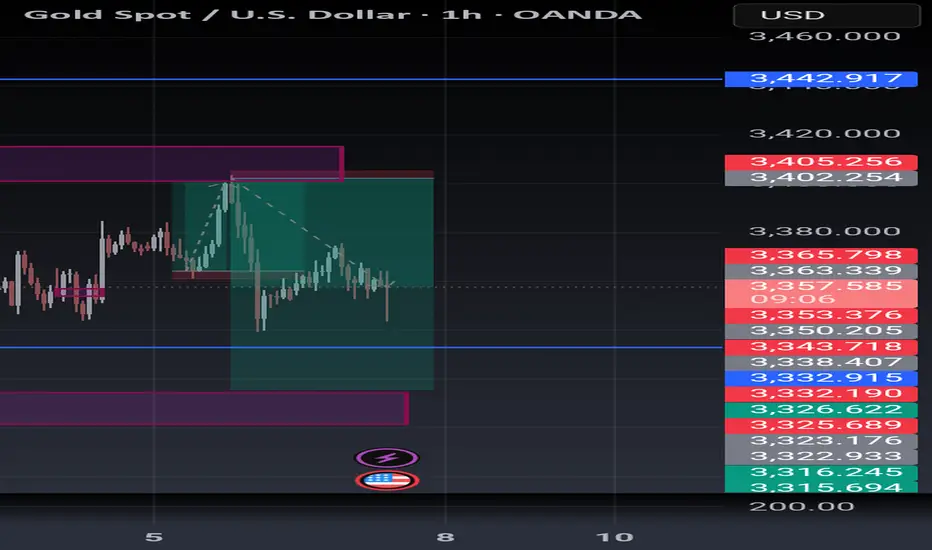
XAUUSD – NFP STORM AHEADXAUUSD – NFP STORM AHEAD: WILL GOLD BREAK HIGHER OR FACE A DEEP CORRECTION?
Gold is entering a critical phase ahead of tonight’s Non-Farm Payrolls (NFP) report — one of the most influential economic releases globally. With US-China trade tensions resurfacing and growing concerns over US national debt, the precious metal market is likely to experience high volatility during the US session.
🌍 MACROECONOMIC & POLITICAL OUTLOOK
Trade negotiations between the US and China have resumed, with China reaffirming its intent to defend strategic metal exports amidst ongoing tariff threats.
The US national debt is projected to reach $55 trillion by 2034, prompting central banks worldwide to continue stockpiling gold as a hedge against fiat devaluation.
Fed Chair Jerome Powell maintains his stance of “not rushing to cut rates,” but political pressure — especially from former President Trump — is escalating rapidly.
Unemployment Claims fell slightly last week, reinforcing the view of a weakening labour market. If tonight’s NFP print disappoints, gold may surge on renewed expectations of future Fed easing.
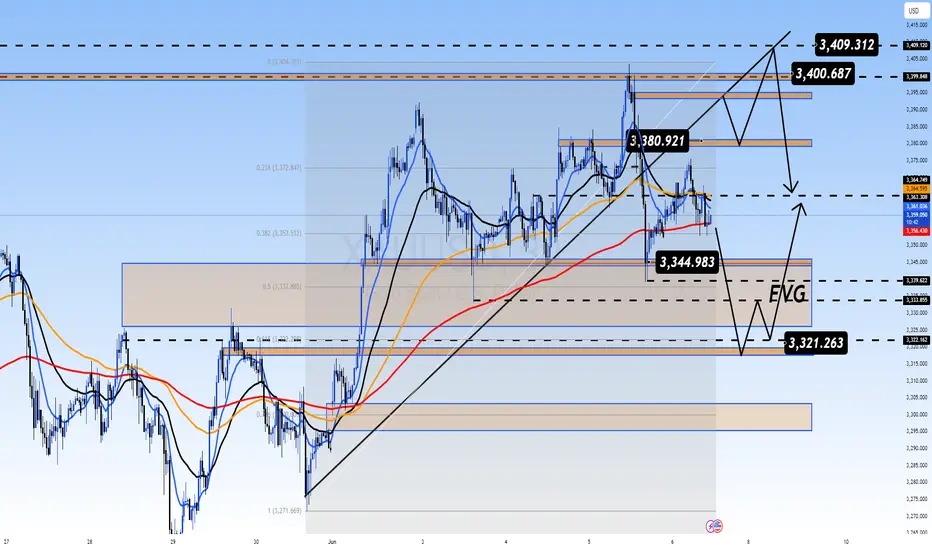
📈 TECHNICAL ANALYSIS (H1 – EMA 13/34/89/200)
Gold has formed a classic impulsive wave structure, with recent highs tested around the 3408 – 3410 resistance zone.
Price action is consolidating near the EMA 89 and EMA 200, suggesting indecision and building energy for a potential breakout.
A breakdown below the 3344 – 3332 support zone could trigger a move toward the FVG liquidity block near 3320, a potential institutional buy level.
🔍 STRATEGIC KEYLEVELS TO WATCH
Resistance levels: 3380 – 3392 – 3408 – 3436
Support levels: 3365 – 3350 – 3344 – 3332 – 3320
🧭 TRADE SETUPS
🔻 SELL ZONE: 3408 – 3410
Stop Loss: 3415
Take Profit: 3404 → 3400 → 3395 → 3390 → 3380 → 3370 → 3360 → 3350
🔵 BUY ZONE: 3318 – 3316
Stop Loss: 3310
Take Profit: 3322 → 3326 → 3330 → 3335 → 3340 → 3350 → 3360 → ???
✅ CONCLUSION
Gold is “holding its breath” before the potential NFP-triggered breakout.
If NFP disappoints → USD weakens → Gold could explode above 3410.
If NFP beats expectations → Sellers may take full control and shift the market into a correction phase.
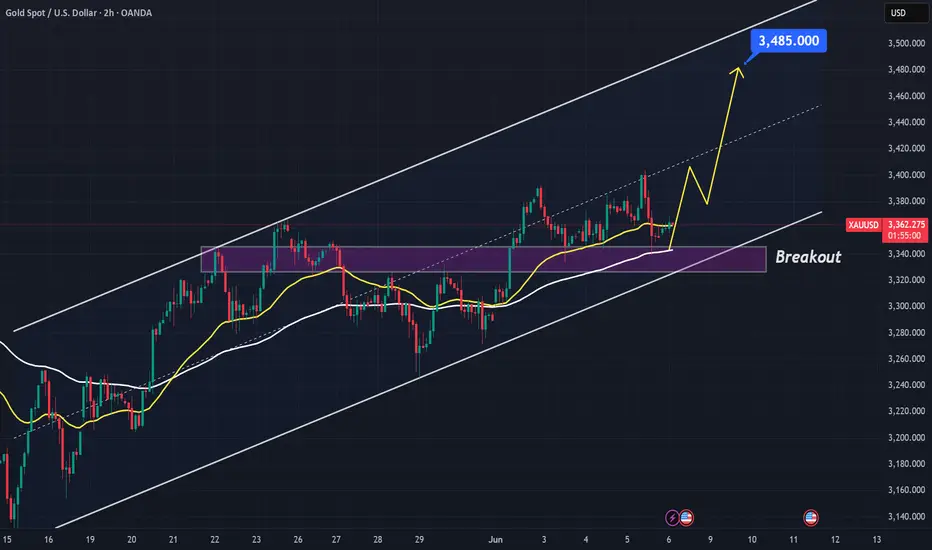
Gold Update – Will Buyers Drive It to 3,485 USD?Great to see all traders again in today’s gold price discussion at the end of the trading session. LyngridTrading here!
Yesterday, gold dropped sharply, with the metal falling by 600 pips during the US session. However, by this morning, it quickly regained its upward momentum, supported by buying pressure around the 3,340 USD support zone.
Specifically, gold regained its momentum after the latest data on the US labor market was just released, showing that the number of initial state unemployment claims rose to 247,000 (seasonally adjusted) by the end of May 2025, according to the announcement from the U.S. Department of Labor. This figure is higher than expected, reflecting a weakening US labor market, which has increased expectations that the Fed will soon cut interest rates to support the economy.
From a technical perspective, as previously analyzed, gold holds a strong short-term technical advantage from the support zone around 3,340 USD. If buying pressure continues, there will be nothing stopping it from rising to 3,485 USD, in line with the idea scheduled at the same time yesterday.
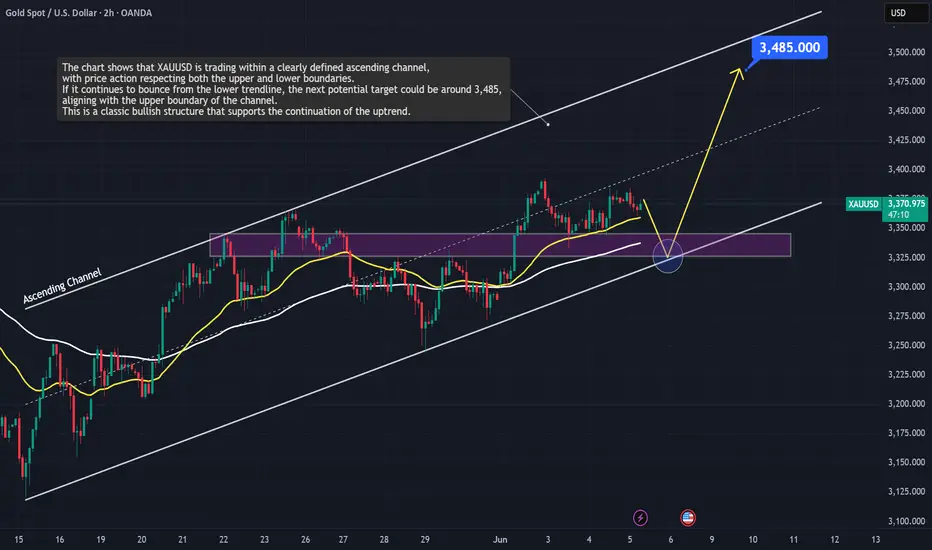
XAUUSD: Bullish Structure Still Intact?Dear friends,
To begin this post, I want you to understand why I want to connect with the global TradingView community. Simply put, I want to share the value I have and listen to more perspectives from all of you. This helps build a stronger, more united community.
And what about you. What do you think of OANDA:XAUUSD hovering around 3,370 USD?
Let’s explore it together!
OANDA:XAUUSD is moving within a very clear ascending channel, with price action consistently respecting both the upper and lower boundaries. This indicates that the bullish structure is still being maintained and the buyers remain in control. The recent upward momentum further reinforces the belief that this trend could continue.
The price is currently approaching a key support zone, marked by the lower boundary of the channel and a previous demand area. If this zone holds, it could offer a strong re-entry opportunity for buyers. The projected bullish target is 3,485 USD, which aligns with the upper boundary of the channel and represents a reasonable upside objective. This is the area I will closely monitor to find a trend-following buy entry, as long as bullish momentum remains intact.
Of course, I do not dismiss the opposite scenario. Failure to hold this dynamic support may suggest that bullish momentum is weakening and could shift the short-term trend to neutral or bearish.
Let me know your thoughts or if you see it differently!
SILVER (XAGUSD): Where is the Next Resistance?!
What a rally on Silver this week.
The market easily violated a resistance cluster
based on the last year high.
Analyzing a historic price action, the next strong resistance
that I found is around 37.4
It is based on an important high of 2012.
That can be the next mid-term goal for the buyers.
❤️Please, support my work with like, thank you!❤️

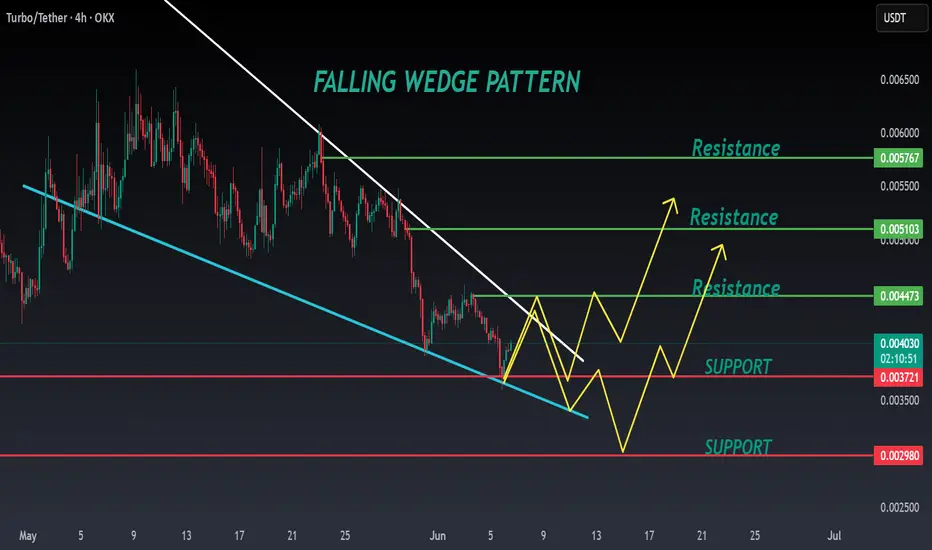
TURBO ANALYSIS📊 #TURBO Analysis
✅There is a formation of Falling Wedge Pattern on daily chart and currently pullback around its major support zone🧐
Pattern signals potential bullish movement incoming after sustain above the major support zone and breaks the pattern with good volume
👀Current Price: $0.004050
🚀 Target Price: $0.004470
⚡️What to do ?
👀Keep an eye on #TURBO price action and volume. We can trade according to the chart and make some profits⚡️⚡️
#TURBO #Cryptocurrency #TechnicalAnalysis #DYOR
AJA's Gold view. The Bear is in charge for now.Just the start of the Bearish move.
Like I analysed. For now, we're selling till 3315.
Check my last analysis. What do you think?
TATA STEEL at Resistance ZoneThis is Daily Chart of TATA STEEL.
Tata steel having good Law of Polarity at 163-168 range.
If this level is sustain , then We may see lower prices in the stock again.
Tata steel is a good support zone at 125-130 range.
Two EMAs are also supporting the stock, with the first EMA positioned at ₹140 and the second at ₹129.
THANK YOU !!
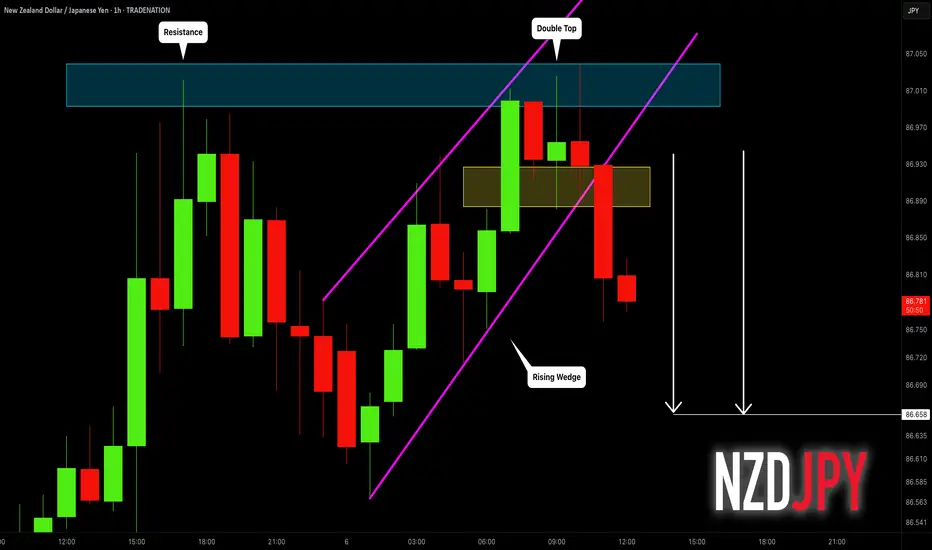
NZDJPY: Another Bearish YEN Pair 🇳🇿🇯🇵
One more YEN pair that looks bearish to me is NZDJPY.
I see 2 bearish price action confirmations after a test
of the underlined horizontal resistances:
the price broke a support line of a rising wedge pattern
and a neckline of a double top.
The price may drop now to 86.66 level.
❤️Please, support my work with like, thank you!❤️
I am part of Trade Nation's Influencer program and receive a monthly fee for using their TradingView charts in my analysis.
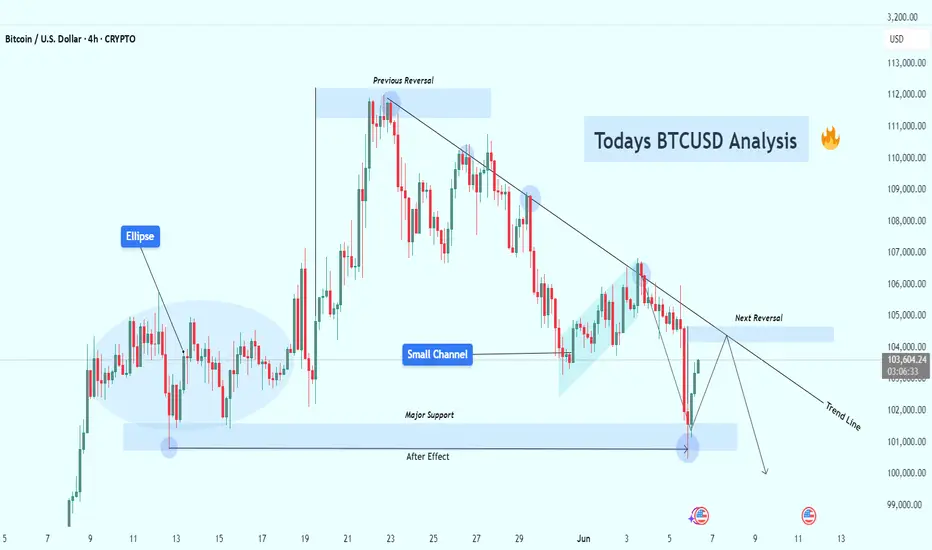
BTCUSD at Decision Point – Rejection or Breakout Ahead? (4H)Bitcoin is currently trading around $103,500, and the price action is presenting a textbook technical scenario with multiple confluences. This chart is rich in structure — from rejection zones and trendlines to channel breakdowns and historical support retests — making it a critical area for traders to observe.
🔍 1. Previous Reversal Zone
The chart shows that Bitcoin previously faced a strong rejection near the $110,500–111,000 level. This created the first lower high, signaling the end of bullish momentum and the start of a trend shift. Every subsequent touch of that zone resulted in rejection, confirming it as a major supply zone.
📉 2. Descending Trendline – Dynamic Resistance
After multiple failed attempts to break above, price has formed a clean descending trendline that is acting as dynamic resistance. Each touch along this trendline has led to a short-term selloff, and price is now approaching this line again, near the Next Reversal Zone.
📌 This confluence increases the probability of another rejection unless there's a strong bullish breakout with volume.
📊 3. Bearish Channel & Breakdown
Before the recent fall, Bitcoin was trading inside a small bearish channel. This type of consolidation often results in continuation — which we saw with the downside breakout. This breakdown also increased bearish momentum and pushed BTC into the major support area.
🧊 4. Major Support Zone – The Battle Ground
Marked around the $101,000–102,000 range, this zone has acted as a strong demand area multiple times. The most recent bounce suggests that buyers are still active here. This could be the last defense for bulls in the short term.
🧠 If this zone breaks, we could see price falling toward the psychological level of $100,000 or even lower.
🌀 5. Ellipse Zone – Accumulation Structure
Early on the chart, an ellipse highlights a horizontal accumulation zone where price moved sideways before breaking out upward. This shows how smart money often enters during quiet phases before explosive moves. Watching for similar signs can provide strong trade setups.
🔄 6. Next Reversal Zone – Watch Closely
Price is now approaching the Next Reversal Zone near $104,500–105,000, which aligns perfectly with the descending trendline. This is a high-probability rejection zone where traders should be watching for bearish confirmations like wicks, pin bars, or bearish engulfing candles.
📌 Two Possible Scenarios
🟥 Bearish Scenario (High Probability):
Price touches the Next Reversal Zone and gets rejected.
We could see a drop back to the Major Support Zone.
If support breaks, expect a move toward $100K–99K in the coming sessions.
🟩 Bullish Scenario (Low Probability Without Volume):
Price breaks and closes above the trendline with strong bullish candles and increased volume.
In that case, BTC could rally toward the $107K–108K resistance and potentially flip the trend bullish.
💡 Trading Insight:
Fridays usually have low volume, leading to unexpected wicks and false breakouts. That’s why it’s important to:
Use small lot sizes
Wait for confirmations
Avoid overtrading before weekend closes
🧠 Final Thoughts:
This is a classic setup — consolidation after trend, rejection zones, trendline resistance, and strong support areas all in one chart. Whether you’re a price action trader or a structure-based analyst, this chart offers a powerful decision point.
Stay patient. Let the market reveal its hand. The next few candles around this trendline will likely dictate the next 1–3 day direction for BTC.
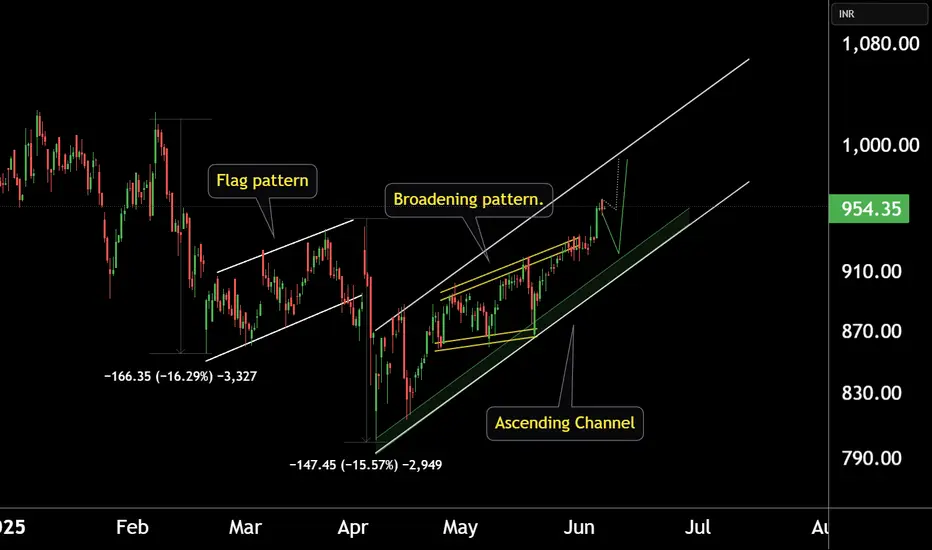
ZYDUS LIFESCIENCES AT BEST SUPPORT !!This is the 4 hour Chart of ZYDUSLIFE.
Zydus Lifesciences at good support zone near ₹920–₹930 range.
Zyduslife is moving in a Higher High and Higher Low (HH-HL) formation.
Stock has formed a broadening pattern within the channel.
If this level is sustain, we may see higher prices in ZYDUSLIFE.
THANK YOU !!
EURO-USD BUY STRONG 1. "EUR/USD Strong Buy Alert 🚀 | Key support zone holding firm – bulls eyeing the next leg up!"
2. "Strong Buy Zone ✅ | EUR/USD showing bullish momentum from this support level – eyes on 1.09+"
3. "EUR/USD Reversal Zone 💥 | Buyers stepping in strong – potential rally ahead!"
4. "Watch this zone! EUR/USD strong buy setup forming – bullish confirmation underway 📈"
5. "EUR/USD bouncing from key demand zone 🔥 | Technicals align for a strong buy signal!"

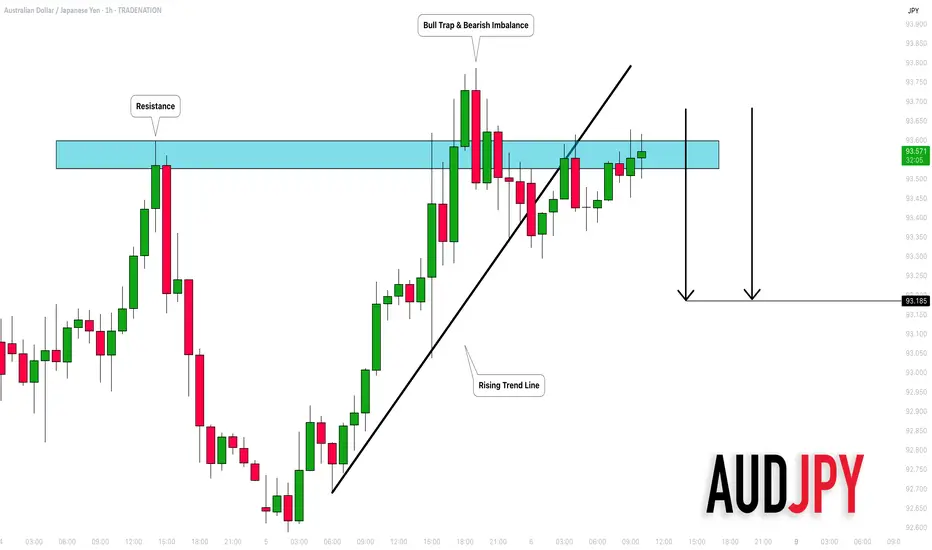
AUDJPY: Pullback Confirmed?! 🇦🇺🇯🇵
There is a high chance that AUDJPY will pull back
from the underlined resistance cluster.
Its false violation, a formation of a bearish imbalance candle
and a breakout of a rising trend line provide strong bearish confirmation.
Goal - 93.185
❤️Please, support my work with like, thank you!❤️
I am part of Trade Nation's Influencer program and receive a monthly fee for using their TradingView charts in my analysis.
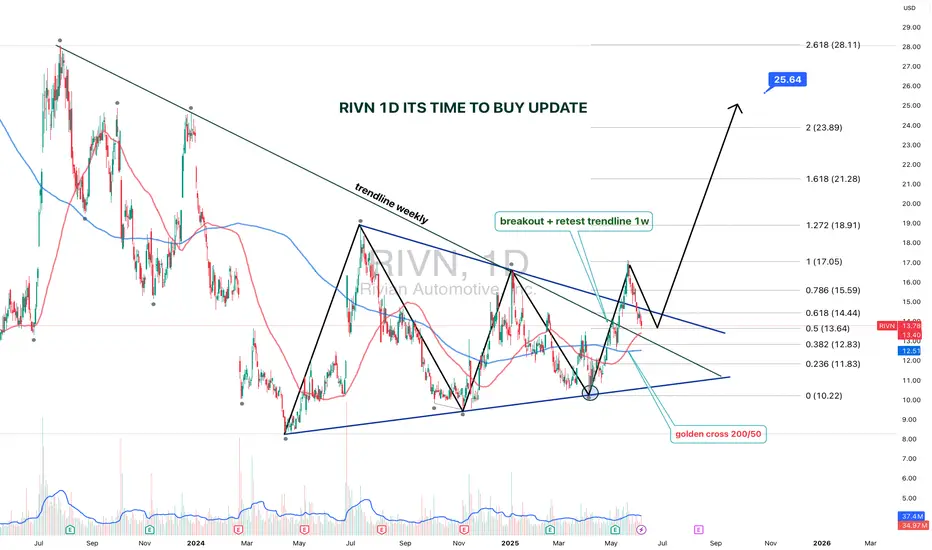
RIVN 1D — It’s Time to Buy: Setup UpdateThe setup on Rivian (RIVN) just got upgraded from “interesting” to “strategically significant.” We’re looking at a textbook symmetrical triangle that’s been developing since July 2023, with a clean breakout and retest on the weekly trendline.
The breakout was followed by a bullish retest, right at the intersection of the triangle base and the key trendline. Volume kicked in, price held — and that’s what smart money calls confirmation.
Now, the Golden Cross is live: the 50-day MA just crossed the 200-day MA from below. Price is confidently holding above both — momentum is shifting hard. Fibs from the bottom (10.22) to the last local top (17.05) project the first target at $17, and the extended Fibonacci confluence gives us $25.64 as a long-range goal (2.618 extension).
The weekly trendline — which acted as resistance for over a year — has flipped to support. Price action respects it, bulls are loading, and structure is clean.
This is not just a bounce. It’s a technical rotation from accumulation to expansion.
The time to talk about potential is over — price action has spoken.
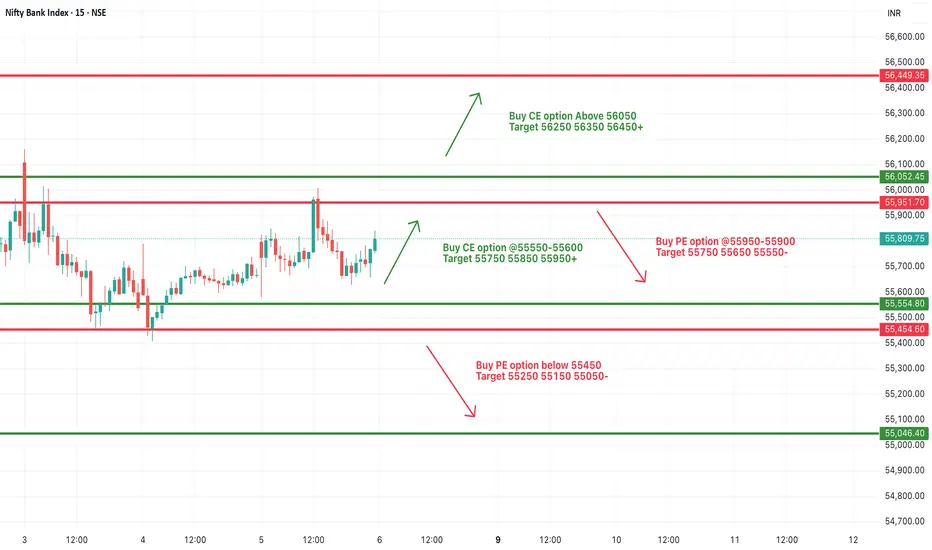
[INTRADAY] #BANKNIFTY PE & CE Levels(06/06/2025)Bank Nifty is opening with a slight gap-up around 55800, but continues to consolidate in the same range that has held for the past few sessions. Despite attempts, no significant breakout or breakdown has occurred, indicating indecision and a potential buildup for a larger move.
Upside continuation will only be confirmed if the index sustains above 56050, opening room for a move toward 56250, 56350, and 56450+.
On the other hand, if price starts slipping back below 55900–55850, the index may retrace toward 55750, 55650, and 55550. Breakdown below 55450 will be a clear sign of weakness, targeting 55250, 55150, and 55050.
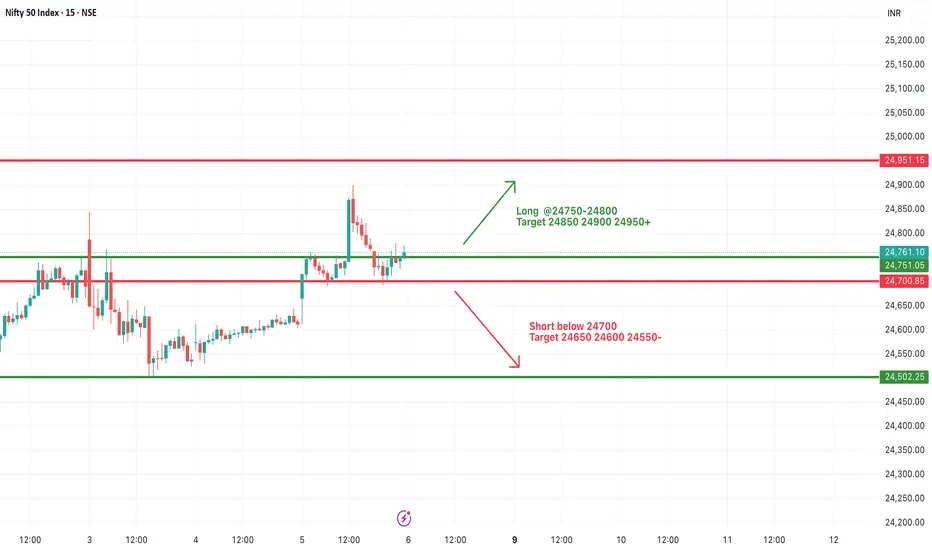
#NIFTY Intraday Support and Resistance Levels - 06/06/2025Nifty is opening with a slight gap-up around 24750–24760, placing it just above a key resistance-turned-support level. This setup suggests early optimism, but follow-through momentum is crucial for confirmation.
If Nifty sustains above 24800, it may pave the way for a smooth upside toward 24850, 24900, and 24950+. This range could act as a momentum zone for intraday buyers if volume supports the move.
On the flip side, a slip back below 24700 may signal weakness and open downside targets at 24650, 24600, and 24550, pulling Nifty back into a broader consolidation range.
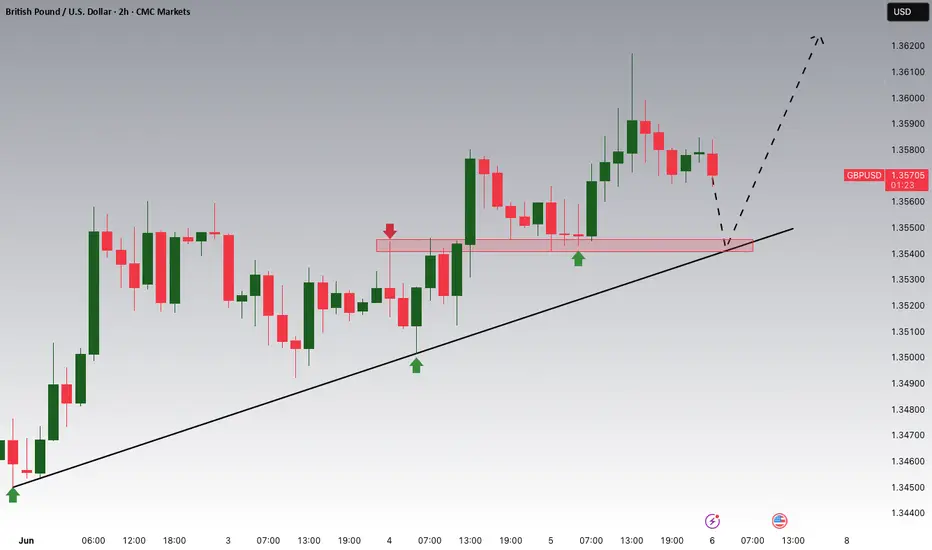
GBPUSD Potential UpsidesHey Traders, in today's trading session we are monitoring GBPUSD for a buying opportunity around 1.35400 zone, GBPUSD is trading in an uptrend and currently is in a correction phase in which it is approaching the trend at 1.35400 support and resistance area.
Trade safe, Joe.