Ethereum Eyes $8K After Bullish BreakoutEthereum (ETH) is setting up for a powerful move. After hitting a multi-month high last week, ETH pulled back into a higher-low formation—strengthening the newly established bullish trend.
Money flow is shifting: with recent crypto legislation, Ethereum is now benefiting even more than Bitcoin, marking a notable change in market dynamics.
📈 Technical Highlights:
✅ Short-term target: $4,800–$5,000 (new all-time highs)
✅ Long-term potential: $7,000–$8,000
🛡️ Key support: $2,800–$3,000 (bullish as long as this holds)
📣 Takeaway:
Ethereum’s trend is firmly bullish. As long as support holds, pullbacks could offer strong entry opportunities for both swing traders and long-term investors.
#Ethereum #ETHUSD #Crypto #Trading #TechnicalAnalysis #CryptoTrading #EthereumPrice #Altcoins #Bullish #Breakout
Technical Analysis

AUD/USD: Rising Wedge Breakdown Signals Bearish ShiftAUD/USD has broken down from a rising wedge formation after rejecting near the 61.8% Fibonacci retracement at 0.6558. This pattern, typically bearish, suggests the recent uptrend is losing steam — a view reinforced by Friday’s strong bearish candle closing below both the wedge support and the 50-day SMA (0.6510).
The price action now sits just above the 200-day SMA (0.6397), a level that could act as a short-term buffer. If this moving average gives way, focus shifts to the prior horizontal support at 0.6170. Meanwhile, upside attempts may find resistance at the broken wedge support and Fib zone near 0.6550.
Momentum indicators support the bearish case:
MACD is flat but biased lower, hovering near the zero line.
RSI has dipped below 50 (currently ~47.7), indicating weakening bullish momentum.
Unless AUD/USD quickly reclaims 0.6550, the path appears tilted toward further losses, potentially targeting the 0.63–0.62 zone.
Bias: Bearish breakdown with downside pressure while below 0.6550. Watch 0.6397 and 0.6170 as key support levels.
-MW

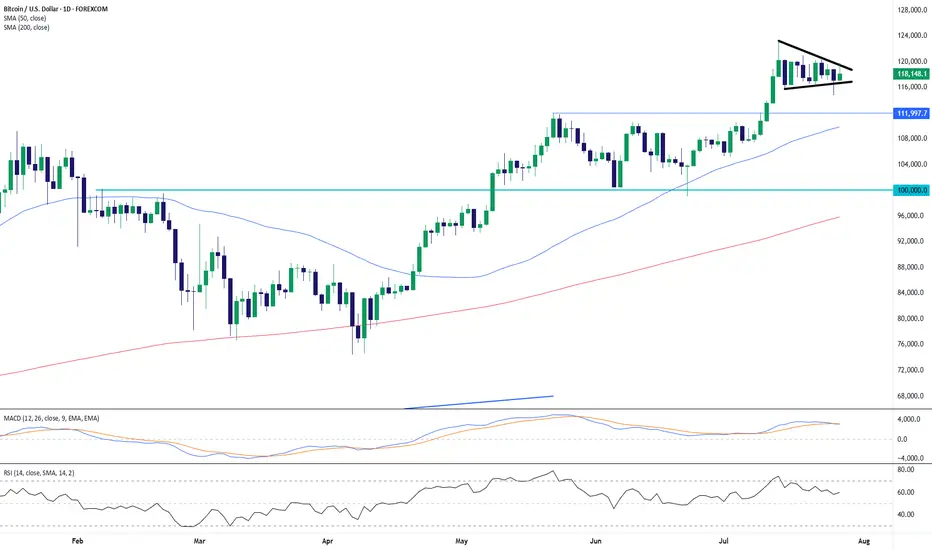
BTC/USD: Bullish Pennant Holds Above Breakout ZoneBitcoin is consolidating within a bullish pennant pattern just below the 120,000 level, following a sharp rally from the June lows. Price action has compressed between converging trendlines, forming higher lows and lower highs — a classic continuation formation in an uptrend.
Importantly, BTC remains well above prior resistance (now support) at 112,000, with both the 50-day SMA (109,837) and 200-day SMA (95,838) trending upward. This suggests strong medium- to long-term bullish structure.
Momentum indicators support the case for continuation:
MACD remains in positive territory, albeit with a slight bearish crossover, hinting at near-term indecision.
RSI is holding around 59.6, just below overbought, reflecting consolidation rather than distribution.
A breakout above the pennant resistance and psychological 120,000 barrier would likely trigger renewed bullish momentum, targeting fresh highs. Conversely, a breakdown below 116,000 could expose 112,000 as a key retest zone.
Bias: Bullish continuation favored while above 112,000. Watch for breakout confirmation from the pennant.
-MW
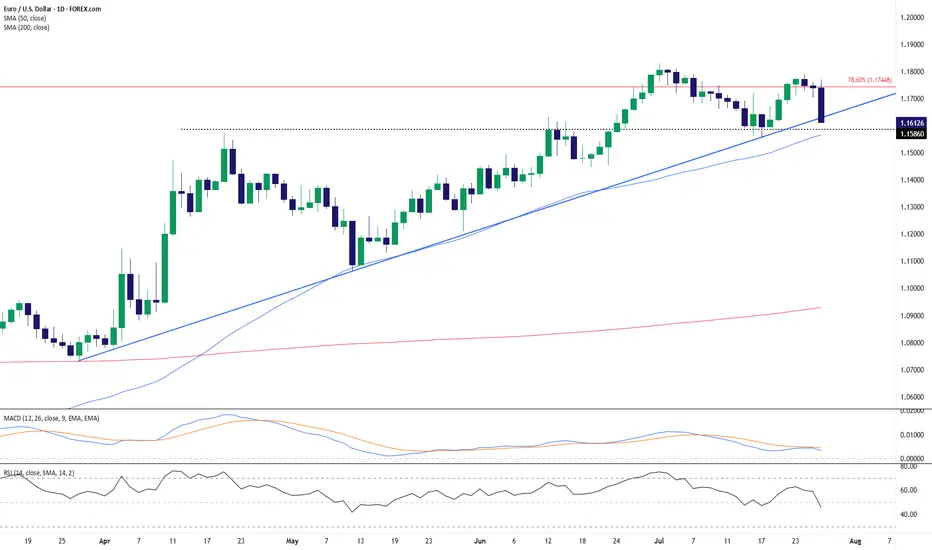
EUR/USD: Breakdown From Key Fib Confluence Threatens UptrendEUR/USD has snapped a key confluence zone after rejecting the 78.6% Fibonacci retracement level near 1.1745. The latest daily candle shows a sharp bearish engulfing bar that sliced below both the ascending trendline and the 50-day SMA (1.1565), signaling a potential trend reversal or deeper correction.
This breakdown follows a multi-week uptrend, and momentum indicators are starting to confirm the bearish shift:
MACD is showing a bearish crossover below the signal line.
RSI has dropped below 50 (currently around 45.8), reflecting weakening bullish momentum.
The pair has now settled just above horizontal support near 1.1586. A decisive close below this level could open the door toward the next support zone around 1.1450–1.1500, where prior consolidation and the rising 200-day SMA (1.0929) may act as stronger demand.
Bulls will need to reclaim the 1.1650–1.1700 zone and see a bullish crossover on momentum indicators to regain control. Until then, the path of least resistance appears tilted to the downside, especially with trendline and Fib support now breached.
Bias: Bearish while below 1.1700. Watch for continuation lower if 1.1586 fails to hold.
-MW
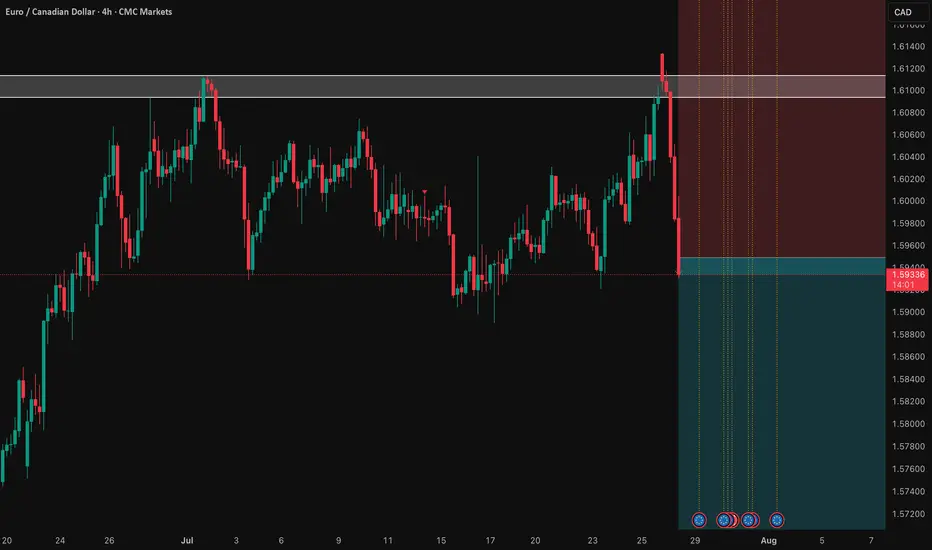
EUR/CAD: Shorting the Climactic Rally Near 1.6000The strong rally in EUR/CAD has pushed the pair into extreme territory, approaching a major psychological and structural resistance zone. While momentum has been strong, this looks like a potential climactic or "blow-off" top, offering a highly favorable risk/reward opportunity to short the pair in alignment with the weak underlying Euro fundamentals.
The Fundamental Why 📰
The core thesis remains bearish for the Euro. The European Central Bank (ECB) maintains a distinctly dovish tone, signaling a willingness to ease policy further to support a slowing Eurozone economy. This fundamental headwind suggests that extreme rallies in Euro pairs are often exhaustive and present prime shorting opportunities.
The Technical Picture 📊
Major Supply Zone: The price is entering a critical multi-month supply zone between 1.5950 and the key psychological level of 1.6000. This is a major ceiling where significant selling pressure is anticipated.
Fibonacci Extension: This area aligns with a key Fibonacci extension level (1.272) from the last major impulse wave, a common zone where trending moves become exhausted and reversals begin.
Pronounced RSI Divergence: A clear bearish divergence is forming on the daily chart. As price makes this final push to a new high, the Relative Strength Index (RSI) is making a significantly lower high, signaling a deep exhaustion of buying momentum.
The Counter-Trade Rationale 🧠
This is a high-level fade. We are positioning for a reversal at a major, technically significant ceiling. The extreme price extension, combined with clear momentum divergence, indicates that the risk of buying at these highs is substantial. By shorting here, we are betting that the powerful technical resistance and weak fundamentals will trigger a significant correction.
The Setup ✅
📉 Pair: EUR/CAD
👉 Direction: Short
⛔️ Stop Loss: 1.63230
🎯 Entry: 1.59490
✅ Take Profit: 1.52008
⚖️ Risk/Reward: ≈ 2:1
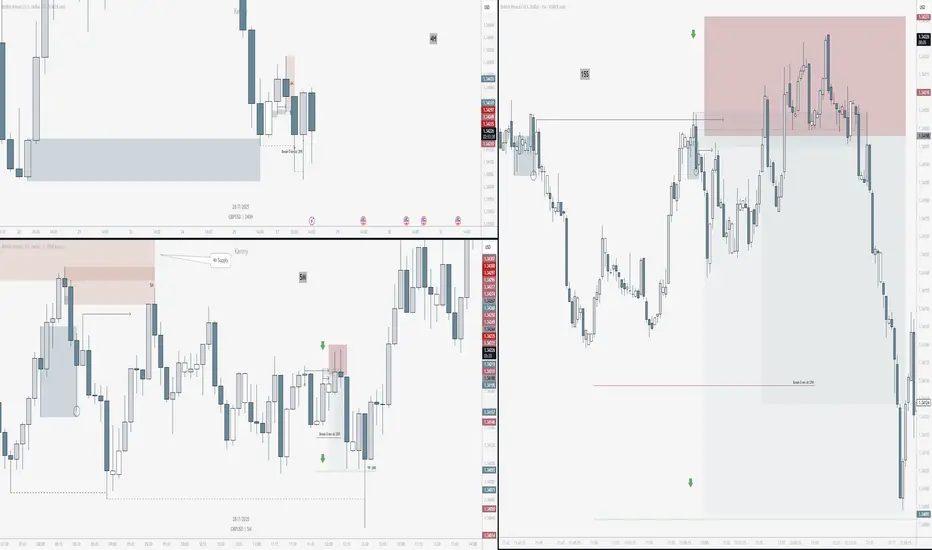
GBPUSD SHORTGBPUSD SHORT | 15s entry | 5m confirmation | 4H bias
Price mitigated 4H supply. Waited for 5M alignment, then dropped to 15s to spot another liquidity grab before entry — doubling the probability.
Caught the shift as 5M structure broke, creating a flip liquidity grab for the zone above and making it even stronger.
That move also left behind a weak low likely to be taken, giving clear reason for lower prices.
Same system. Different pair. Same outcome.
Zero emotion. Just posting what works.
Strategic Multi-Swing Analysis – Pivots and Post-FOMC Outlook__________________________________________________________________________________
Technical Overview – Summary Points
➤ Sustained bullish momentum on BTCUSDT across all swing timeframes.
➤ Key supports: 116400–117400 (likely rebound), major supports: 105047–114674.
➤ Main resistances: 119000–120000 (short term), major ceiling at 123240 (1D/12H).
➤ Risk On / Risk Off Indicator: "Strong Buy" signal – tech sector leadership confirmed.
➤ Volumes normal to moderately elevated, no excess or behavioral anomaly (ISPD "Neutral").
➤ No euphoria or capitulation flags; general wait-and-see attitude, FOMC event ahead.
__________________________________________________________________________________
Strategic Summary
➤ Strategic bullish bias remains as long as 116400/117400 supports hold.
➤ Opportunity window: buy pullbacks towards 117400–116400 with tight stops; clear invalidation below 115900.
➤ Risks: FOMC-induced volatility, increased leverage on alts, potential capitulation if key support breaks.
➤ Catalysts: FOMC communication, geopolitical context (no immediate threat), background risk-off climate not yet triggered.
➤ Action plan: Prioritize post-event reaction over anticipation; maintain strict technical protection.
__________________________________________________________________________________
Multi-Timeframe Analysis
1D: Uptrend confirmed. Price above all major supports. Strong resistance at 123240, key support at 105047, normal volumes, Risk On / Risk Off Indicator "Strong Buy", ISPD "Neutral".
12H: Bullish bias. Resistance cluster 120002–123240. Intermediate supports 114674/111949. Momentum/volume supported, no excesses.
6H: Bullish near range top, supports at 114674/111949, ceiling at 120002–123240. Solid Risk On / Risk Off Indicator.
4H–2H: Up momentum, resistance 119003–120002–123240, supports 116474/117800. Moderate/normal volumes.
1H: Strong uptrend, thick resistance at 119000–120000, immediate supports 117800/116474. Slight volume uptick ahead of FOMC.
30min–15min: Resistance 119003–120000 (~H4 pivot). Intraday support 117400–117800/118200. Both Risk On / Risk Off Indicator and ISPD neutral, normal volumes, bullish as long as 116474 holds.
SYNTHESIS: Broad bullish confluence on MTFTI from 1H to 1D/W.
Supports at 116474/117400 are key pivots for maintaining bullish swing view.
No behavioral alerts or extreme volumes.
Consolidation/waiting likely before FOMC release – monitor reactions at pivot zones.
__________________________________________________________________________________
Strategic decision & macro
Opportunities: Swing bullish scenario favored as long as key supports hold, buy strategic pullbacks, reverse on clear break.
Main risk: FOMC volatility, altcoin excesses, possible post-announcement fake moves. Active monitoring essential.
Macro/on-chain: No excess, BTC realized cap > $1T; aggressive rotation into alts, high open interest. No capitulation. Major on-chain & technical support aligned at 114500–118000.
Action plan: Favor reactivity (post-FOMC), tight stops, progressive take profits at 119500–123240 resistance. No aggressive pre-positioning.
__________________________________________________________________________________
Macro catalysts overview
FOMC expected: status quo, market sensitive to any Powell tone shift.
Global macro: latent risk-off, geopolitical drivers closely watched.
BTC stable, no technical disruptor in the immediate term.
__________________________________________________________________________________
Final Decision Summary
Robust technical setup with a clear bullish bias. Optimal entries on 117400-116400 pullbacks, stops below support, active management needed during FOMC. No on-chain excess; constructive background unless exogenous shock or resistance failure (119000–123240). Stay alert for breakout/reject pivot.
__________________________________________________________________________________

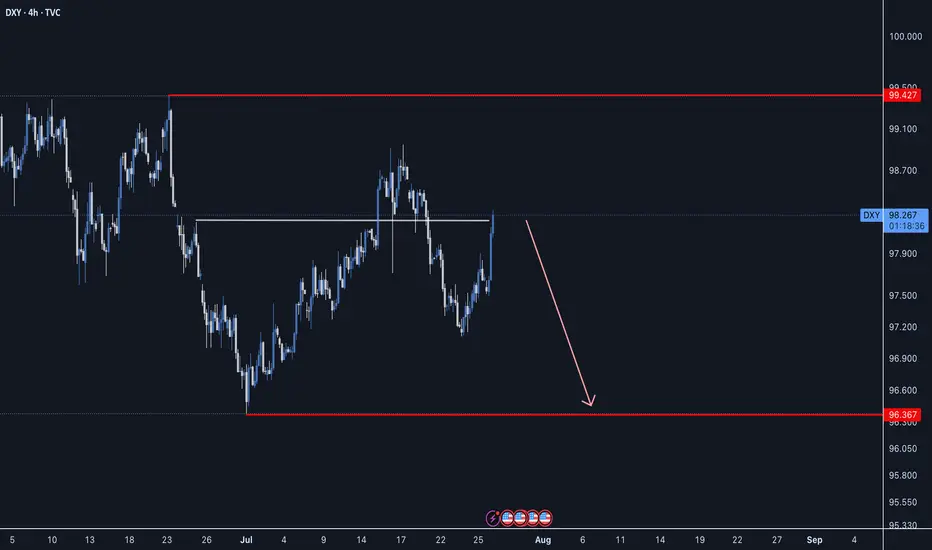
DXY - ABC Move still in playDXY has been moving not so much on technical factors lately but more so with what Mr. Trump says, we still could see a move lower with an ABC pattern.
Good Luck
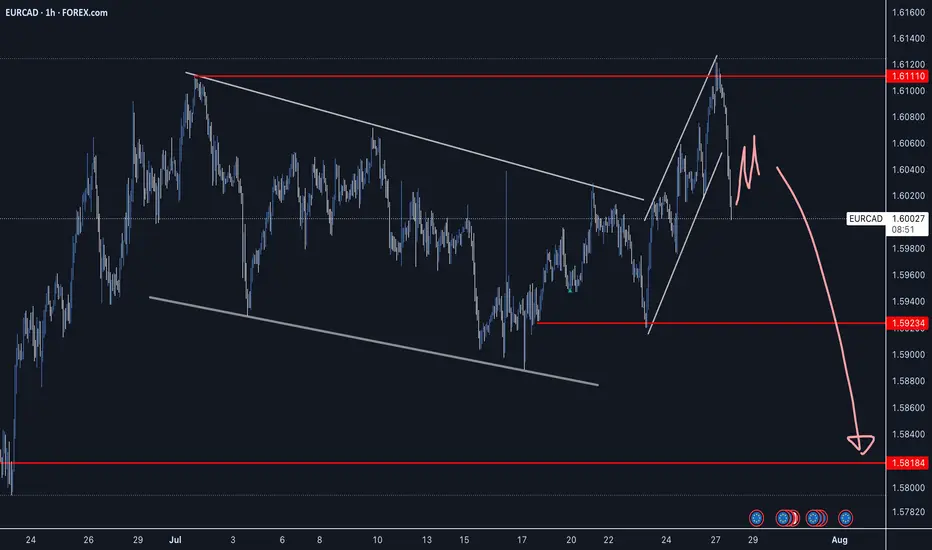
EURCAD - Strong Reversal Impulse off Double TopEURCAD has created bearish price action with a strong reversal impulse pushing down from the double top level. Waiting for a continuation to confirm a sell opportunity with a good R:R.
Good Luck
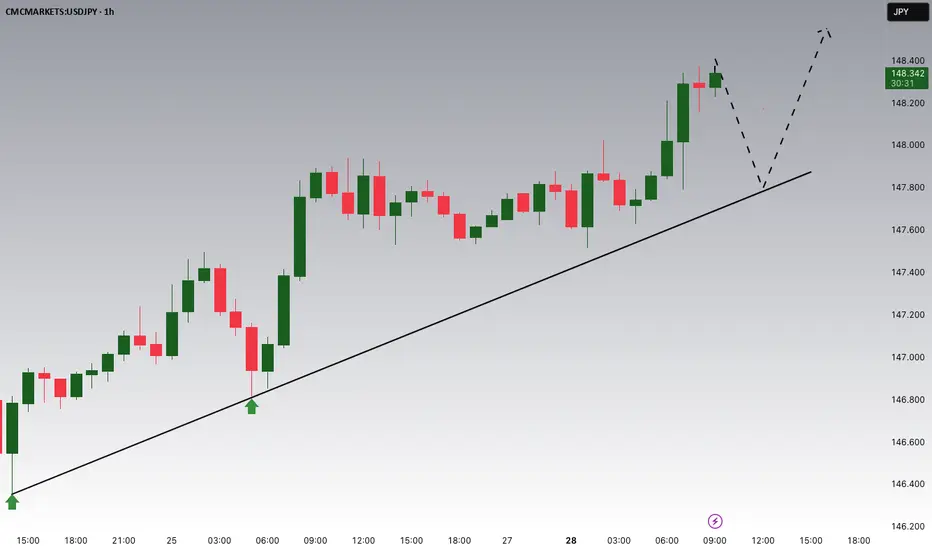
USDJPY Potential UpsidesHey Traders, in today's trading session we are monitoring USDJPY for a buying opportunity around 147.800 zone, USDJPY is trading in an uptrend and currently is in a correction phase in which it is approaching the trend at 147.800 support and resistance area.
Trade safe, Joe.
USOIL Analysis : MMC Bullish Setup Building on USOIL – Target🧠 Introduction & Trade Philosophy
In today’s 4H USOIL chart analysis, we are at a critical decision-making zone, where price action is preparing to make a major move in either direction, based on the response to a central demand zone. We are applying the MMC Rule, which emphasizes mirroring supply-demand behavior and validating market moves through structural confirmation.
The current price structure presents a classic MMC scenario, where price must either confirm a bullish double demand reaction or invalidate the setup by breaking the key zone and moving bearish.
📍 Chart Structure Explained
🔷 1. Central Reversal Zones (CRZs)
There are two CRZs highlighted:
The upper CRZ around 65.90–66.20, where price was previously rejected.
The lower CRZ, where price is currently consolidating, is around 64.80–65.50.
These zones are liquidity-rich areas where big players react—either by absorbing positions or driving directional moves.
🟢 2. Bullish Scenario – MMC Rule In Play (Path 1)
"If we want it bullish, we want 50% supply and demand will be double according to MMC Rule"
According to MMC, a bullish move must be confirmed by a strong reaction from demand, showing double the pressure of the last bearish move. Here's how that plays out:
Price respects the lower CRZ, bouncing near the 65.00 mark.
If this bounce gains momentum and breaks above the trendline resistance, the first target is the minor resistance at $69.00, followed by the major resistance zone near $70.50–$71.00.
A retest of broken structure, followed by bullish continuation, is expected. This is marked with the white zigzag projection labeled as “1” on the chart.
Watch for a clear higher high formation, which would indicate a shift in structure and validate bullish momentum.
🔻 3. Bearish Scenario – Breakdown Confirmation (Path 2)
"If it breaks, USOIL will go bearish"
If price fails to hold the current demand and closes below $64.80–64.50, it signals that demand has been absorbed, and MMC reversal has failed. In that case:
A clean breakdown below the demand zone will confirm bearish control.
The next downside target becomes $62.00, as labeled “2” on the chart.
The downward move is likely to follow a steep path as marked with the sharp downward trendline extension, especially if supported by volume and news catalysts.
🔄 Mirror Concept Highlight – Ellipse Area
The ellipse shape on the chart marks a previous compression zone followed by a breakout. This area represents an imbalance in supply that led to a sell-off. The MMC principle suggests the market tends to mirror these zones—if that was previous supply, and the current demand zone mirrors its positioning and structure, we can anticipate a similar reaction, but to the upside.
This is where the "50% double reaction" rule comes in—demand needs to show twice the strength to overcome the previous sell-side pressure.
🔧 Technical Levels Summary
Zone Type Price Range Notes
Major Resistance 70.50 – 71.00 Final target if bullish scenario plays out
Minor Resistance 68.80 – 69.20 First bullish checkpoint
Upper CRZ 65.90 – 66.20 Key structure to break for bulls
Lower CRZ (Support) 64.80 – 65.50 Demand base for bullish setup
Bearish Target Zone 62.00 – 61.80 Projected zone if support breaks
🧭 Trader’s Mindset & Risk Notes (MMC Style)
Wait for clear confirmation and price behavior near the CRZs before entering.
Use trendline breaks, candlestick confirmation, and volume to validate direction.
Avoid guessing the direction—let price tell the story.
Stick to MMC rules: No confirmation, no position.
✅ Bullish Criteria Checklist:
✔️ Price respects lower CRZ
✔️ Breakout above trendline
✔️ Closes above $66.20
✔️ Higher highs + strong bullish candles
✔️ MMC Double Demand Reaction Confirmed
❌ Bearish Breakdown Triggers:
❌ Breaks below $64.50
❌ Weak bounce + lower highs
❌ Volume increases on downside
❌ Clean breakdown structure
🚀 Trade Plan & Outlook
We’re now at a critical zone where market sentiment will soon be clear. Based on your MMC analysis, the bias remains bullish as long as price holds above $64.80. Be patient and let the setup complete with structure confirmation.
This is not just a technical play—it's a psychological zone, where institutional traders also make decisions. Follow the MMC logic and react with confirmation.

EURCHF: Classic Gap Trade 🇪🇺🇨🇭
There is a huge gap up opening on EURCHF.
The price tested a key intraday resistance with that and formed
a strong bearish imbalance candle then.
Probabilities will be high that the market will fill the gap today.
Goal - 0.9338
❤️Please, support my work with like, thank you!❤️

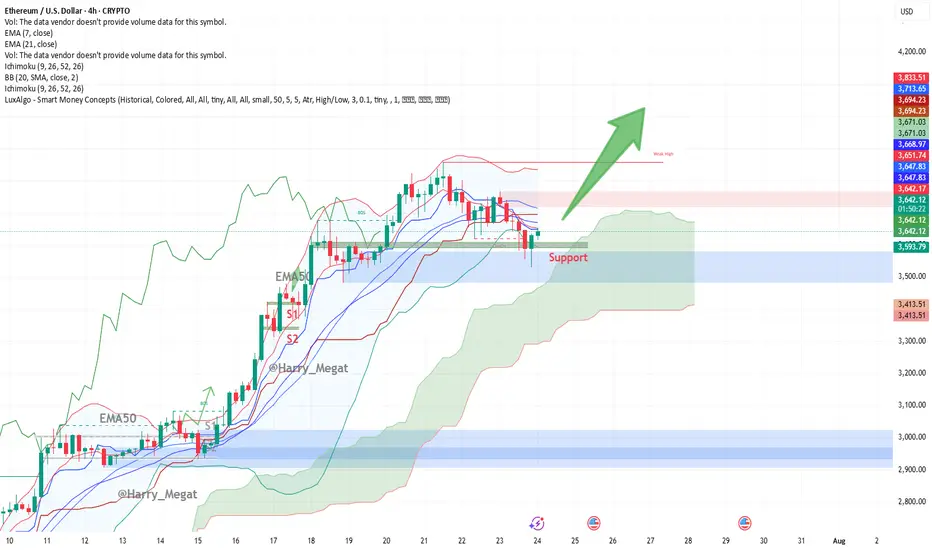
Ethereum (ETH/USD) 4-hour chart Technical AnalysisThis Ethereum (ETH/USD) 4-hour chart presents a **bullish setup**. Let’s break it down:
**Chart Overview:**
* **Price at the time of chart:** \~\$3,650
* **Support Zone:** \~\$3,615–3,630 (highlighted in green box)
* **Indicators:**
* **EMA 7 (Red):** \~\$3,653.87
* **EMA 21 (Blue):** \~\$3,669.75
* **Bullish Signal:** Large upward green arrow suggests expectation of a breakout rally from current support.
**Technical Analysis:**
**1. Bullish Bounce at Support**
* ETH tested the **horizontal support zone** multiple times, showing strong demand.
* The recent candle shows a **wick rejection** from the support zone — indicating buyer strength.
**2. Moving Averages**
* Price is trying to reclaim above the **EMA7**, with EMA21 nearby (\~\$3,670).
* A **bullish crossover** or strong candle close above both EMAs could confirm upside continuation.
**3. Structure**
* Previous resistance (\~\$3,615) has turned into **new support** — a classic bullish flip.
* The large green arrow projects a **potential breakout move**, targeting higher highs possibly above **\$3,750+**, then **\$3,900+**.
**Trade Setup Idea:**
| Type | Entry | Stop Loss | Take Profit 1 | Take Profit 2 |
| Long | \$3,655–3,660 | Below \$3,600 | \$3,750 | \$3,900+ |
**Watch Out For:**
* Rejection near EMA21 (\$3,670)
* False breakout if volume is weak
* Macro risk or sudden BTC movement dragging ETH
**Conclusion:**
The chart signals a **bullish bias** if ETH maintains above the support zone and reclaims both EMAs. A clean break above \~\$3,670–3,700 could spark further upside toward \$3,900+.
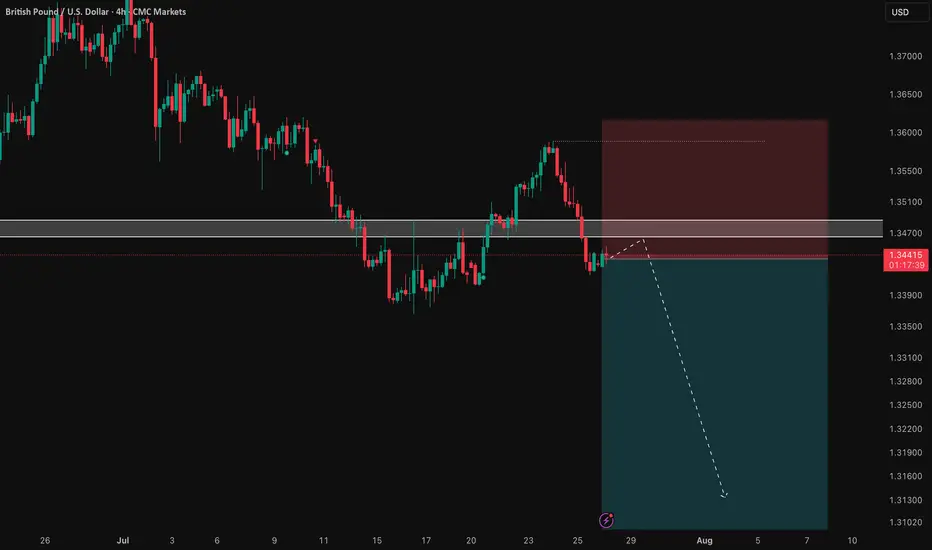
GBP/USD: Following the Bearish Trend to a Key LevelSharing my perspective on a potential short setup in GBP/USD.
This view is based on a combination of weakening UK fundamentals and a clear bearish technical structure.
📰 The Fundamental View
The main driver here is the growing difference in monetary policy. The Bank of England is signaling a more dovish stance due to recent soft economic data out of the UK. In contrast, the US economy is showing more resilience, which may keep the Federal Reserve on a less aggressive easing path. This fundamental divergence puts downward pressure on the Pound versus the Dollar.
📊 The Technical Picture
The chart supports this bearish bias. We can see a clear downtrend in place, defined by a series of lower highs and lower lows. Price is currently trading below its key moving averages, which often act as dynamic resistance. The critical level to watch is the 1.34377 price zone, which was a previous area of support and could now be tested as resistance.
🎯 The Strategy
The plan is to watch for bearish price action as we approach the 1.34377 key level. A rejection from this zone would provide a good opportunity to enter a short position, aiming to ride the next leg of the established downtrend.
As always, this is my own perspective. Manage your risk carefully and trade safe.
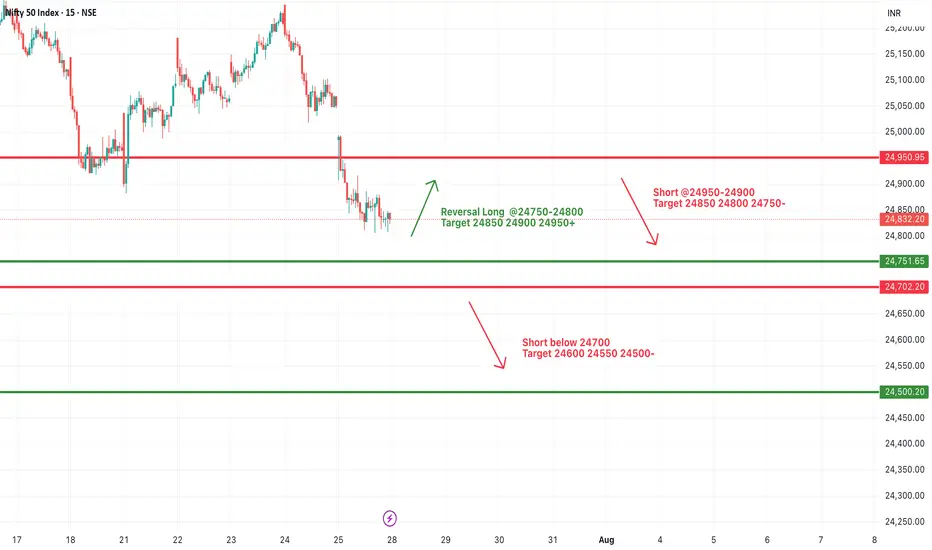
#NIFTY Intraday Support and Resistance Levels - 28/07/2025Nifty is expected to open slightly lower and remains under selling pressure from higher levels. The key intraday zone to watch is 24,750–24,900, which may act as a trigger range for today's direction.
If Nifty sustains above the 24,750–24,800 zone, a short-covering rally may push the index toward 24,850, 24,900, and 24,950+. This zone may offer a reversal opportunity if supported by strong price action.
On the downside, if the index fails to hold above 24,900–24,950, further weakness may be seen below 24,700, opening downside targets at 24,600, 24,550, and 24,500-.
The broader price action suggests a narrow consolidation between 24,700–24,900, with either side breakout likely to lead to intraday momentum. Maintain strict risk management and avoid aggressive trades within this zone.
[INTRADAY] #BANKNIFTY PE & CE Levels(28/07/2025)Bank Nifty is expected to open slightly lower and is currently trading near a critical zone of 56,450–56,550, which may act as a key pivot for today's session. This narrow band will decide the next directional move.
If Bank Nifty sustains above 56,550, we can expect an upward move toward 56,750, 56,850, and 56,950+ levels. This zone could act as a breakout trigger for intraday momentum on the upside.
On the downside, if the index slips and trades below 56,450–56,400, it may indicate bearish pressure, with possible downside targets at 56,250, 56,150, and 56,050-.
Alternatively, a rejection near the 56,900–56,950 zone could also act as a reversal point and push the index back down.
For now, wait for a clear breakout or breakdown from the 56,450–56,550 range before taking directional trades.

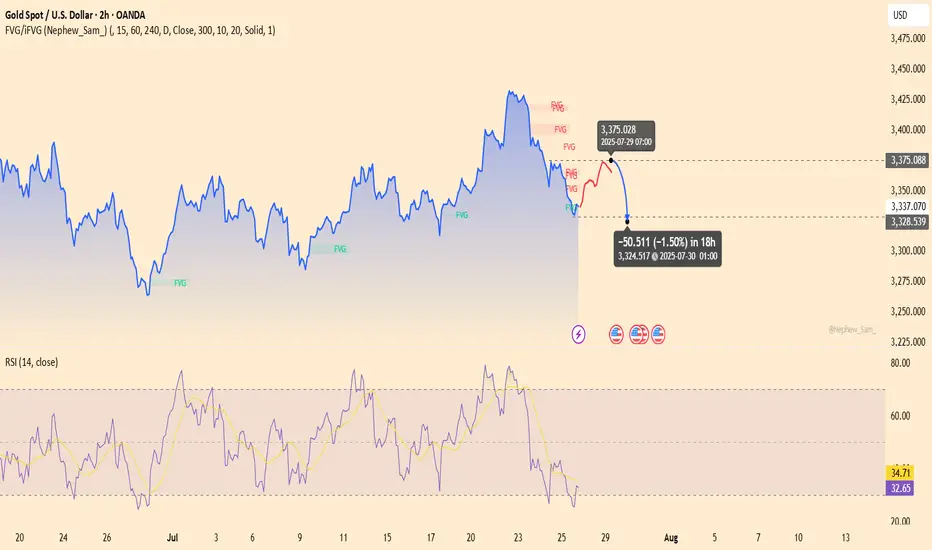
XAUUSD – The assassin returnsGold is showing a weak reaction around the 3,375 zone — a previous supply area — with RSI dipping into oversold territory but failing to bounce significantly. The chart reveals layered FVG traps, hinting at a potential -1.5% drop toward 3,324 within the next 18 hours.
Bearish catalyst: The U.S. jobless claims have dropped to a 3-month low → labor market remains strong → Fed likely to keep interest rates high → stronger USD, weaker gold.
Preferred setup:
SELL if price gets rejected at 3,375
SL: 3,390
TP: 3,324 – 3,310
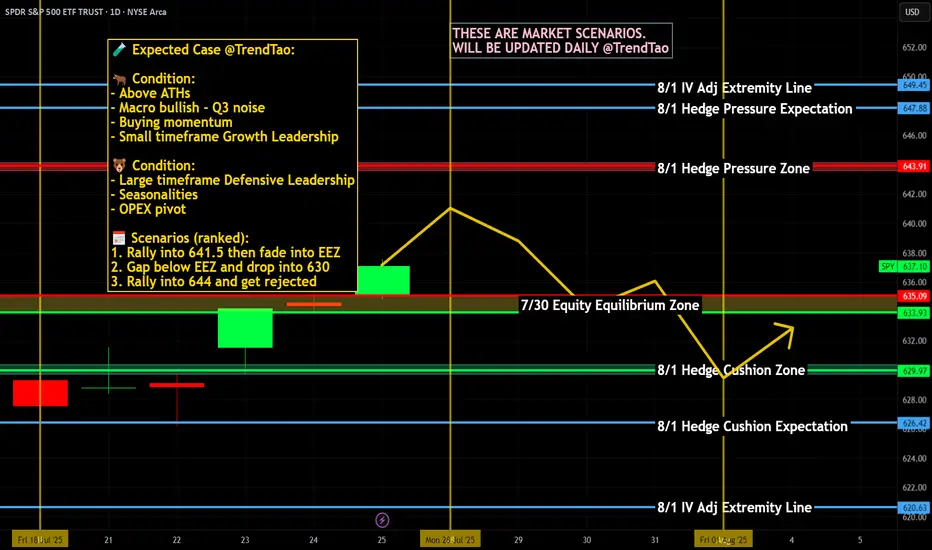
Weekly $SPY / $SPX Scenarios for July 28–August 1, 2025🔮 Weekly AMEX:SPY / SP:SPX Scenarios for July 28–August 1, 2025 🔮
🌍 Market‑Moving News 🌍
🏦 Fed Holds Steady, Faces Political Pressure
The Federal Reserve is expected to keep rates at 4.25%–4.50% during its FOMC meeting midweek. While rates are unchanged, political pressure from President Trump continues as calls intensify for rate cuts and questions arise over the Fed’s independence—including dissent from Governors Waller and Bowman.
📦 Trade Truce Extends & New Deal With EU
A new trade framework with the EU reduces tariffs to 15%, easing tensions. Meanwhile, U.S. and Chinese trade teams begin talks in Stockholm on Monday aiming to avoid an early-August tariff deadline.
💻 Tech and Mega-Cap Earnings Spotlight
This week features earnings from tech giants including Meta, Microsoft (Wednesday), followed by Amazon and Apple (Thursday). Markets will prioritize forward guidance around AI investments, capital expenditures, and sales trends.
📊 Key Data Releases & Events 📊
📅 Monday, July 28
No major releases
📅 Tuesday, July 29
Chicago PMI (July flash) – early indicator of regional manufacturing trends.
Global PMIs – flash readings for Europe and Asia gauge economic health.
📅 Wednesday, July 30
FOMC Rate Decision & Powell Press Conference – investors will scrutinize tone, forward guidance on rates, labor markets, and inflation.
Q2 U.S. GDP (Advance Estimate) – expected at ~1.9%, signaling rebound after Q1 contraction.
📅 Thursday, July 31
June PCE & Core PCE Indexes – Fed’s preferred inflation measure. Core PCE expected at ~2.7% YoY.
Consumer Confidence (July) – key for household spending trends.
Trade Balance (June) – provides data on U.S. import/export dynamics.
📅 Friday, August 1
July Nonfarm Payrolls, Unemployment & Wage Data – forecast for ~102,000 new jobs and ~4.2% unemployment; markets await for labor-market cooling signs.
Tariff Deadline – new tariffs loom unless trade agreements with EU, Canada, China etc. materialize by today’s cutoff.
⚠️ Disclaimer:
This summary is educational and informational only. It is not financial advice. Always consult a licensed financial advisor before making any investment decisions.
📌 #trading #stockmarket #economy #Fed #earnings #inflation #tariffs #GDP #PCE #jobs #technicalanalysis
Gold Potential UpsidesHey Traders, in tomorrow's trading session we are monitoring XAUUSD for a buying opportunity around 3,320 zone, Gold is trading in an uptrend and currently is in a correction phase in which it is approaching the trend at 3,320 support and resistance area.
Trade safe, Joe.

(XAGUSD) Volume Absorption to Bullish Continuation To Target🧱 1. Market Structure Breakdown:
The 4H chart of Silver (XAGUSD) reveals a well-structured price action sequence, beginning with a compression breakout, a strong bullish impulse, and a current retracement phase into a key reversal zone.
🔺 Symmetrical Triangle & Volume Absorption (Early July):
The market was forming higher lows and lower highs, indicative of consolidation inside a symmetrical triangle.
During this phase, a volume absorption event occurred—indicating smart money was accumulating before a breakout.
This was followed by a strong bullish breakout, confirming upside strength and clearing previous highs.
📈 2x Channel Supply Zone — Now Demand:
After breaking above the triangle, the price surged into a key supply zone, created from a prior channel top.
This zone was tested, absorbed, and flipped into a new demand zone, as buyers overwhelmed sellers.
This supply-demand interchange confirmed a structural change in market sentiment.
🚀 2. Momentum Confirmation — High Breakout:
The "High Breaked" level, marked clearly on the chart, acted as a bullish breakout trigger.
This breakout not only breached the prior resistance but established a new bullish leg—providing strong confirmation of trend continuation.
🔁 3. QFL Zone & Controlled Pullback:
After the surge, the price began to correct from the QFL (Quick Flip Level).
This level usually represents an area where short-term distribution or profit-taking occurs.
The pullback from this zone was controlled but sharp, which is natural after such a strong move up.
🟩 4. Next Reversal Zone — The Critical Demand Block:
Price is now entering a high-probability reversal zone, marked around $37.5–$36.8.
This area is critical due to:
Confluence with previous structure and minor support.
Potential bullish absorption area.
Last base before the impulse up.
If bullish price action (like bullish engulfing, pin bar, or volume spike) is seen here, it could signal the start of the next leg up.
🧨 5. Key Warning: "If it crosses, this will be Supply Double"
If this zone fails to hold, the demand will flip into double supply, likely accelerating bearish momentum.
In such case, Silver may revisit Major Support near the $36.0–$35.5 zone.
🧭 Potential Trading Scenarios:
✅ Bullish Path (Primary Expectation):
Price reacts from the reversal zone with bullish momentum.
Breaks back into the Central Zone (~$38.5).
Forms a higher low → continuation toward $39.5–$41.0.
Breakout above the recent swing high confirms the continuation pattern.
Trade Idea:
Long entries near $37.2–$37.5 with SL below $36.8.
Target zones: $38.8 (short-term), $39.8–$41.0 (swing).
❌ Bearish Continuation (Alternative Plan):
Reversal zone fails to hold.
Price breaks and closes below $36.8.
Previous support becomes resistance — bearish retest.
Continuation toward $36.0–$35.5 zone.
Trade Idea:
Short on break and retest of $36.8.
SL above the reversal zone.
TP near $35.5 or based on volume exhaustion.
🧠 Market Psychology Insight:
This setup shows a clear institutional playbook:
Accumulation → Breakout → Profit-taking → Retest → Continuation.
If smart money is active, expect defense of the reversal zone followed by a strong bounce.

EURUSD: Detailed Support Resistance Analysis For Next Week
Here is my latest support & resistance analysis for EURUSD
for next week.
Consider these structures for pullback/breakout trading.
❤️Please, support my work with like, thank you!❤️
I am part of Trade Nation's Influencer program and receive a monthly fee for using their TradingView charts in my analysis.

MKR ANALYSIS🔮 #MKR Analysis
🌟🚀 As we said earlier #MKR moved around 48%. Right now #MKR is trading in an Ascending Triangle Pattern and here we can see that #MKR moving again towards its neckline. We see see more bullish move in upcoming days
🔖 Current Price: $2260
⏳ Target Price: $2664
⁉️ What to do?
- We have marked crucial levels in the chart . We can trade according to the chart and make some profits. 🚀
#MKR #Cryptocurrency #Breakout #DYOR

USDJPY Breakout and Potential RetraceHey Traders, in today's trading session we are monitoring USDJPY for a buying opportunity around 146.300 zone, USDJPY was trading in a downtrend and successfully managed to break it out. Currently is in a correction phase in which it is approaching the retrace area at 146.300 support and resistance area.
Trade safe, Joe.
