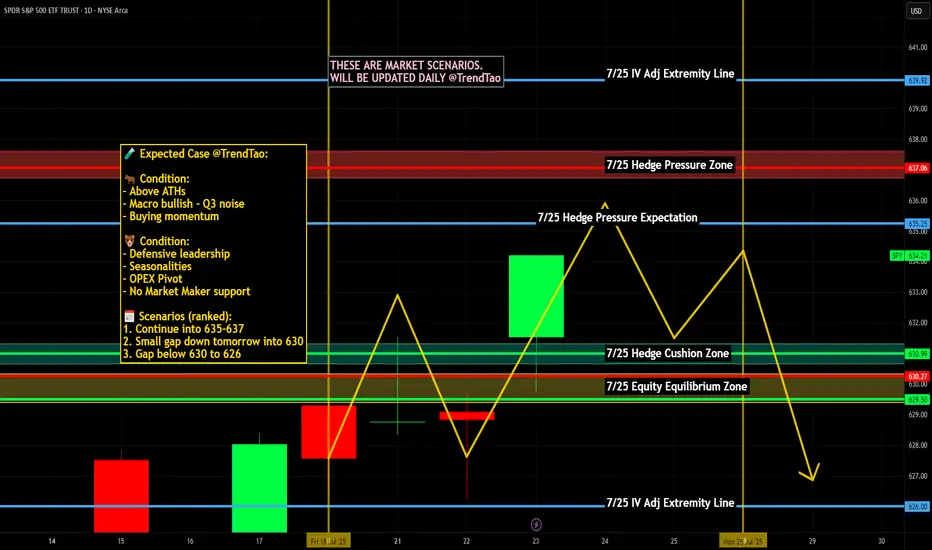
Nightly $SPY / $SPX Scenarios for July 25, 2025🔮 Nightly AMEX:SPY / CBOE:SPX Scenarios for July 25, 2025 🔮
🌍 Market‑Moving News 🌍
🏔️ Copper Market Flashpoint
Following President Trump’s announcement of steep copper tariffs (15–50% range), U.S. copper futures surged, then sharply reversed. Inventory arbitrage between CME and LME markets surged, distorting pricing dynamics and triggering concern over metal market stability.
🇪🇺 EU–China Summit Signals Trade Reset
EU leaders concluded their 25th summit with China, fostering deeper economic and strategic ties. Observers expect follow-up on mutual trade agreements, particularly regarding tech and sustainability sectors.
🌍 EM Equity Rally Consolidates Gains
Emerging markets continue to outperform global equities in 2025—with MSCI EM up ~18% vs. S&P 500. Analysts highlight strong opportunities in AI/fintech stocks in China and Latin America, suggesting further rotations out of U.S. markets.
📊 Key Data Releases & Events 📊
📅 Friday, July 25:
8:30 AM ET – Durable Goods Orders (June):
Forecast shows a sharp drop (~–10%), following a ~16% gain in May—signaling possible cooling in business-related equipment purchases.
10:00 AM ET – U.S. Imports of Steel Products (June):
Trade-data release monitoring steel flows amid evolving tariff frameworks.
All Day – Corporate Earnings Reports:
Companies such as First Financial Bancorp (FFBC), HCA, AON, Charter, and others report earnings. Outlooks may influence small- to mid-cap sentiment.
⚠️ Disclaimer:
This report is for educational and informational purposes only—not financial advice. Always consult a licensed financial advisor before making investment decisions.
📌 #trading #stockmarket #economy #data #earnings #commodities #EM #technicalanalysis
Technical Analysis
Welcome Back! Gold Trading Strategy & Key Zones to WatchIn this week’s welcome back video, I’m breaking down my updated approach to XAU/USD and how I plan to tackle the Gold markets in the coming days. After taking a short break, I’m back with fresh eyes and refined focus.
We’ll review current market structure, identify key liquidity zones, and outline the scenarios I’m watching for potential entries. Whether you’re day trading or swing trading gold, this breakdown will help you frame your week with clarity and confidence.
📌 Covered in this video:
My refreshed trading mindset after a break
Key support/resistance and liquidity zones
Market structure insights and setup conditions
What I’ll personally avoid this week
The “trap zones” that might catch retail traders off guard
🧠 Let’s focus on process over profits — welcome back, and let’s get to work.

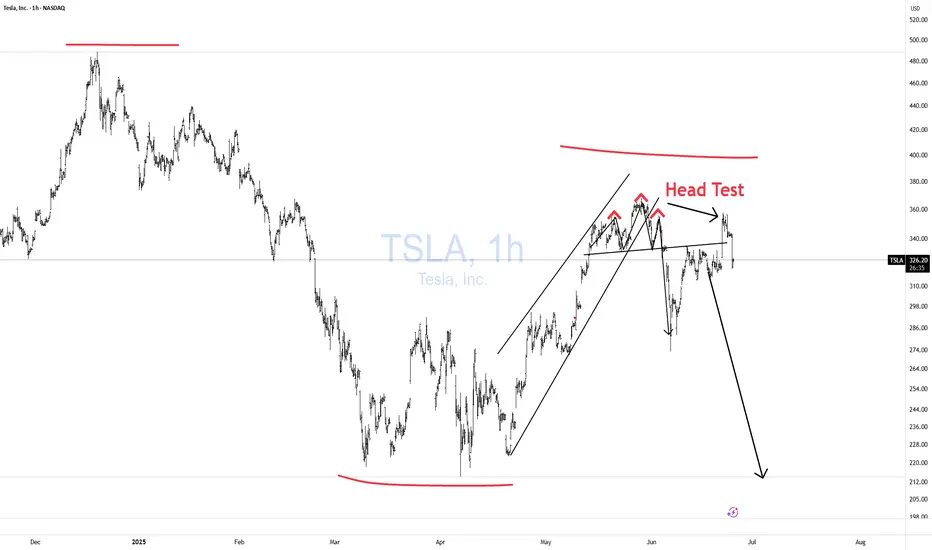
TSLA Honey Ticking Bull Trap! UPDATE 1This is an updated chart, as I keep being prompted to reach "My Target" by TV.
No matter how bad things get for Elona and TSLA, there are always people who are willing to pile in and buy at any price. The problem is the chart is showing lower highs, as TSLA no longer attracts the people needed to boost price, just like TSLA the brand. As a result, people keep getting honey ticked.
Don't Get HONEY TICKED!
As I always say, never EVER!! Invest in toxic people like Elona. They always blow themselves up in the end. It's in their nature!
Click Boost, Follow, subscribe, and let's reach 5,000 followers. ;)
Correction in Play, Long-Term BUY Opportunity Ahead XAUUSD 24/07 – Correction in Play, Long-Term BUY Opportunity Ahead
🧭 Market Outlook
Gold has dropped sharply from the 343x region, exactly as outlined in yesterday’s plan. Price has broken below the ascending trendline on the H1 chart and is now tapping into lower liquidity zones (FVG + OBS), signaling continuation of the short-term bearish move.
Key context to watch:
Traders are awaiting final decisions on US global trade policy agreements.
Next week’s FOMC meeting may confirm expectations of an interest rate cut.
Later today, markets will react to US PMI data and Jobless Claims, which could trigger volatility.
📊 Technical View
While the higher timeframe trend (D1/H4) remains bullish, the short-term structure has broken, and the market is now exploring unfilled liquidity pools below. Once these are swept, we anticipate a strong long-term BUY opportunity.
🎯 Trading Plan for Today
📌 Short-Term Strategy:
Look for short-term SELL setups on retracements toward resistance zones. Wait for clear rejection signals before entering.
📌 Mid/Long-Term Strategy:
Prepare to BUY from major Key Levels once price taps into deep liquidity zones. Ensure confluence and good risk/reward before entering.
🔎 Key Levels to Watch
🔺 Upper Resistance Zones:
3393 – 3404 – 3414 – 3420 – 3428
🔻 Lower Support Zones:
3375 – 3366 – 3352 – 3345 – 3330
🔽 Trade Setups
✅ BUY ZONE: 3352 – 3350
SL: 3345
TP: 3356 → 3360 → 3364 → 3370 → 3375 → 3380 → 3390 → 3400
🔻 SELL ZONE: 3414 – 3416
SL: 3420
TP: 3410 → 3406 → 3400 → 3395 → 3390 → 3380
⚠️ Risk Reminder
No major economic news is scheduled for today, but unexpected political statements or geopolitical tensions could cause price spikes.
✔️ Always follow your SL/TP strictly.
✔️ Avoid entering without solid confirmation.
✔️ Watch how price reacts to the levels above.
📣 Follow MMF on TradingView
If this trading roadmap helps your strategy,
📌 Follow the MMF team on TradingView for daily actionable setups, real levels, and no-nonsense analysis based on real market conditions.
🎯 Real trades. Real zones. Real discipline.

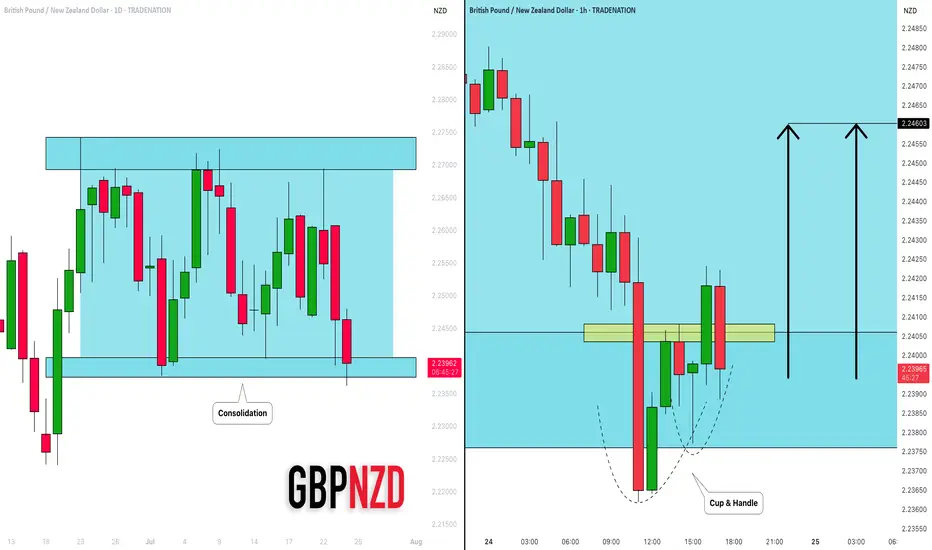
GBPNZD: Bullish Move in a Channel 🇬🇧🇳🇿
I see a horizontal parallel channel on GBPNZD on a daily.
The price is currently testing its support.
On an hourly time frame, a cup & handle pattern was formed on that.
Its neckline was violated with the today's high impact news.
I think that the price may bounce at least to 2.246 level.
❤️Please, support my work with like, thank you!❤️
I am part of Trade Nation's Influencer program and receive a monthly fee for using their TradingView charts in my analysis.
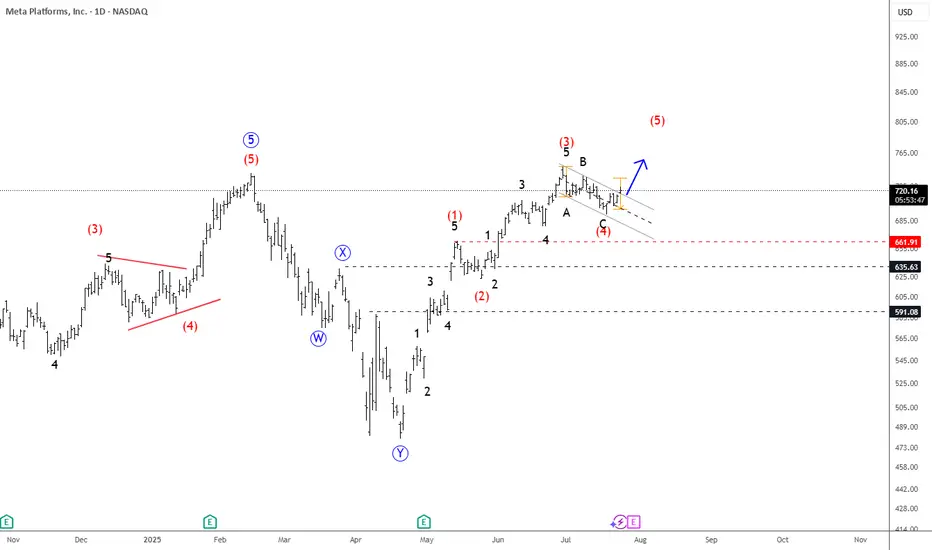
META Slows Down For A Correction Within UptrendMeta has seen a strong recovery recently, but barely retested February highs around 740, from where we can see some nice pullback, but it appears corrective, since it’s unfolding in three waves, and forming a potential bull flag — likely wave 4. A breakout above the downward channel on a daily close could signal the start of wave 5 and a push to new highs.
However, keep a close eye on the 666.1; a break below this level would invalidate the bullish view and suggest a deeper consolidation phase may follow.
Highlights:
Direction: Up (pending breakout)
Structure: Wave 4 bull flag; wave 5 possible soon
Support: 680 / 690
APT Forming Bearish Wedge Pattern – Watch the Support! APT Forming Bearish Wedge Pattern – Watch the Support! ⚠️📉
APT is forming a bearish wedge pattern and is now testing the blue support trendline.
🔻 If the support breaks, we could see a move down to the first green line level.
📊 Stay alert — this setup could trigger soon. Wait for confirmation before reacting.

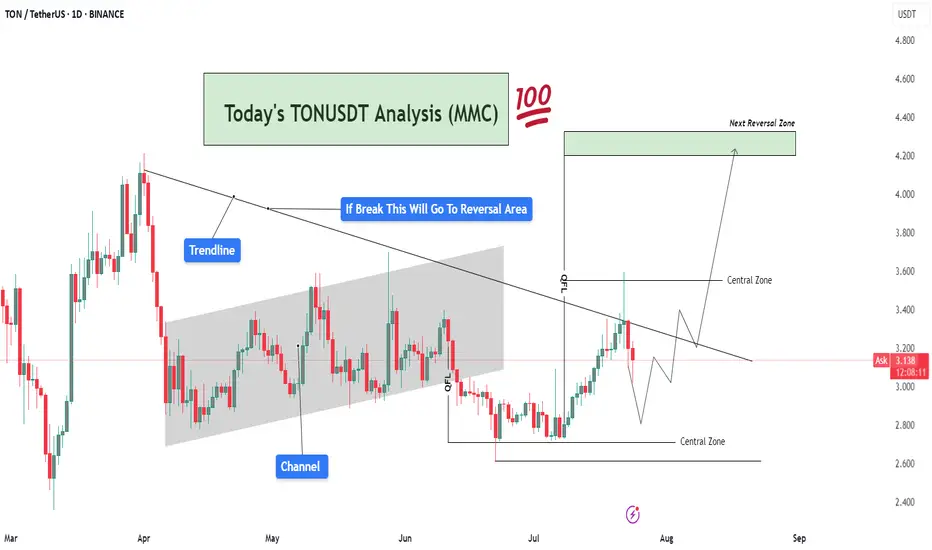
TONUSDT Analysis – Trendline Breakout Target To Reversal Area🧠 Market Sentiment & Context:
TONUSDT (Toncoin vs USDT) is currently trading at $3.13, showing signs of compression within a well-defined MMC structure. After forming a clear QFL (Quick Flip Level) base, the market is approaching a decisive breakout level, with a strong rejection or breakout likely in the coming days.
This chart displays confluence from trendlines, channel breaks, central zones, and QFL demand zones, providing multiple layers of structure-based decision-making. Here's a deeper dive 👇
🔍 Technical Breakdown – What the Chart Is Telling Us:
🔸 1. Major Trendline Resistance – Bearish Control Zone
The descending trendline drawn from prior highs is acting as dynamic resistance.
Price tested this line recently and faced rejection, showing that sellers are still active.
However, the consolidation below the trendline suggests accumulation, not panic selling — a classic sign of smart money positioning before a breakout.
🔸 2. Previous Channel Structure – Broken & Retested
The price previously moved inside a slightly rising parallel channel, reflecting a slow and steady bullish phase.
The channel has now been broken, but TON quickly reclaimed structure via a strong bullish engulfing candle from the QFL base, hinting that this was a liquidity grab (stop hunt) before the real move.
🔸 3. QFL (Quantity Following Line) – Institutional Demand Zone
The QFL base at around $2.85–$3.00 was created after a swift sell-off followed by immediate bullish response.
This is a high-probability MMC reversal structure, where large buyers typically enter.
Since this QFL held firm, it has created a solid foundation for bullish momentum, provided the trendline is eventually broken.
🧭 What's Happening Now – Price Action Update:
Price is caught between two major Central Zones:
Lower Zone: $2.85 – $3.15 (Support)
Upper Zone: $3.50 – $3.70 (Resistance)
The current movement shows price creating higher lows, indicating bullish pressure building beneath the trendline.
Volume remains low, which means the market is waiting for a catalyst (news or breakout) before a directional push.
📌 Key Reversal Zone Ahead – Eyes on $4.20 to $4.40
If price breaks and closes above the descending trendline and crosses the upper central zone, we can anticipate a strong bullish move toward the Next Reversal Zone marked around $4.20–$4.40.
This zone has historical confluence as:
Previous strong supply zone
Psychological round number
Fibonacci extension alignment
This will likely be the profit-booking area for swing traders and early buyers from the QFL zone.
📈 Trade Scenarios Based on MMC:
✅ Bullish Scenario (High Probability If Breakout)
Price breaks the trendline → Pullback → Retest of $3.50–$3.60 zone
Bullish continuation to $4.20–$4.40 Reversal Zone
Ideal entry on retest after breakout
Stop-loss below $3.00
❌ Bearish Scenario (If Rejected Again)
Rejection from trendline leads to re-test of lower Central Zone
Breakdown of QFL level (~$2.85) would invalidate bullish setup
Potential drop toward $2.60 zone for liquidity sweep
🧠 MMC-Based Observations:
🔹 MMC Element 📍 Explanation
🔺 Trendline Key resistance from macro downtrend
🟩 Central Zones Neutral battleground for buyers/sellers
🔻 Channel Break Confirmed bearish momentum earlier, now tested
✅ QFL Strong base, showing early smart money entries
🎯 Reversal Zone High-risk area, expect volatility and profit-taking
📌 Strategic Summary:
Bias: Bullish (as long as price holds above $3.00)
Confirmation Needed: Daily candle close above trendline & $3.50 zone
Target 1: $3.85
Target 2: $4.20–$4.40 (main reversal)
Invalidation: Close below $2.85 (QFL loss)
🚨 Final Thoughts:
TONUSDT is showing clear smart money footprints via the QFL formation and trendline pressure. The setup is ideal for MMC-based breakout traders waiting for confirmation before entering. Volume spike + trendline break will likely spark the next impulsive rally.
Stay patient, and trade the reaction, not the prediction.
Is USDCAD staring at a new low for 2025?FX_IDC:USDCAD ready for a lower low? Let's see.
MARKETSCOM:USDCAD
Let us know what you think in the comments below.
Thank you.
75.2% of retail investor accounts lose money when trading CFDs with this provider. You should consider whether you understand how CFDs work and whether you can afford to take the high risk of losing your money. Past performance is not necessarily indicative of future results. The value of investments may fall as well as rise and the investor may not get back the amount initially invested. This content is not intended for nor applicable to residents of the UK. Cryptocurrency CFDs and spread bets are restricted in the UK for all retail clients.

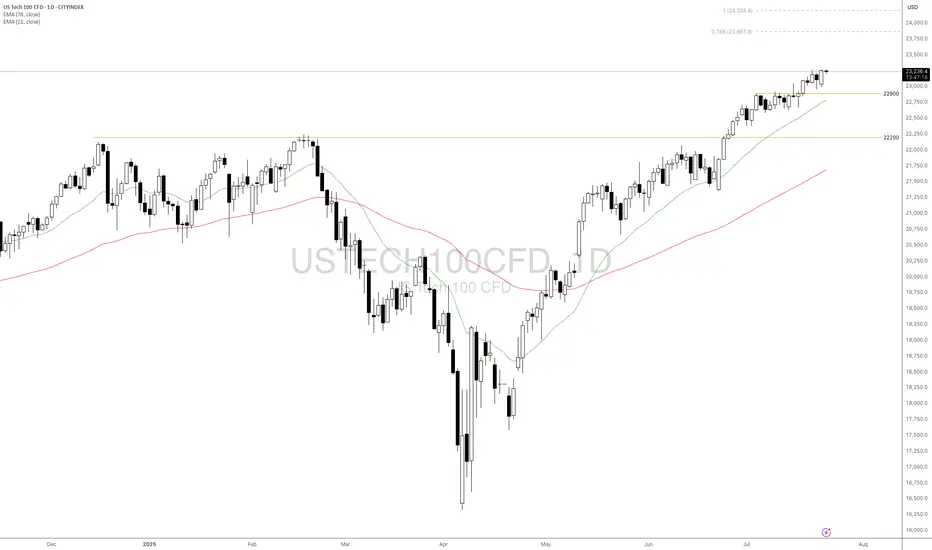
Will USTEC Continue Its Rallies Amid Better Market Sentiment?Macro approach:
- USTEC advanced modestly this week, supported by upbeat corporate earnings and resilience in economic data amid ongoing policy uncertainty.
- The index benefited from strong expected results in major tech firms such as Microsoft (MSFT) and Nvidia (NVDA), as top giant AI leadership, helping to bolster sentiment despite lingering concerns about tariffs and Fed policy direction.
- US macro data showed sticky inflation in key categories, robust retail sales, and falling jobless claims. This prompted the Fed to retain its cautious stance on rate cuts while markets reassessed policy expectations. Policy-related headlines and manufacturing sector developments also partly drove market volatility.
- USTEC could remain sensitive to incoming tech earnings, the 29-30 Jul Fed meeting, and potential US tariff announcements in early Aug. Persistent inflation and any surprises in central bank communication may drive volatility in the sessions ahead.
Technical approach:
- USTEC trended higher and created a new record high. The price is above both EMAs, indicating a strong bullish momentum.
- If USTEC stays above the support at 22900, the price may continue toward the 78.6% Fibonacci Extension at around 23867.
- On the contrary, breaking below the support at 22900 and EMA21 may prompt a deeper correction to retest the following support at 22000.
Analysis by: Dat Tong, Senior Financial Markets Strategist at Exness
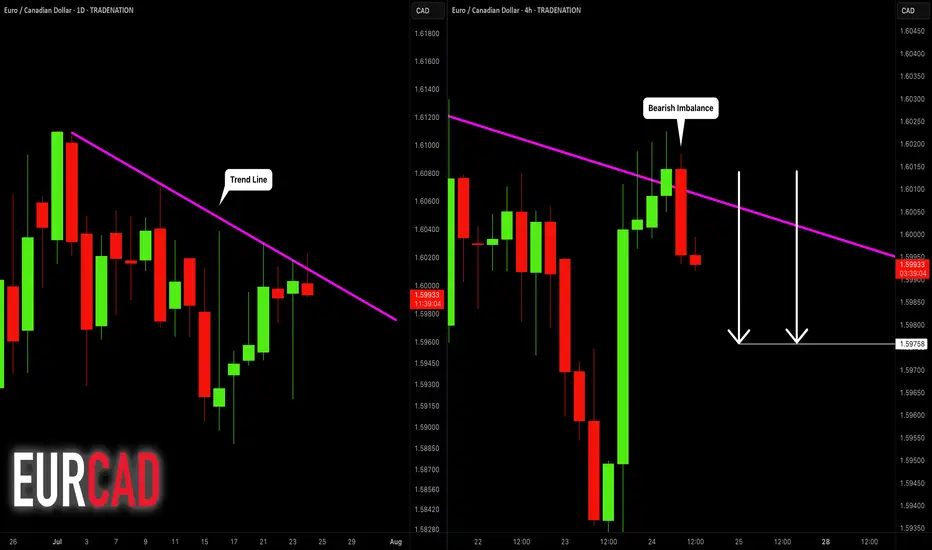
EURCAD: Bearish After the News 🇪🇺🇨🇦
EURCAD may drop from a solid daily resistance.
As a confirmation signal, I spotted a bearish engulfing candle
on a 4H time frame after its test.
The formation of this candle is accompanied by multiple negative
German fundamentals.
Goal - 1.5976
❤️Please, support my work with like, thank you!❤️
I am part of Trade Nation's Influencer program and receive a monthly fee for using their TradingView charts in my analysis.
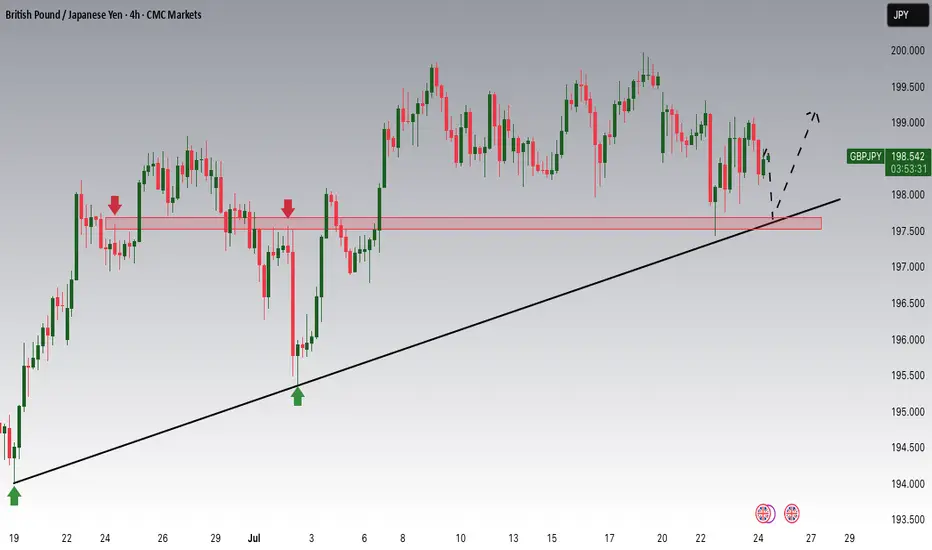
GBPJPY Potential UpsidesHey Traders, in today's trading session we are monitoring GBPJPY for a buying opportunity around 197.700 zone, GBPJPY is trading in an uptrend and currently is in a correction phase in which it is approaching the trend at 197.700 support and resistance area.
Trade safe, Joe.
USDJPY Structure Analysis – Liquidity Filled, Rejection + Target🧠 Overview:
This 2-hour chart of USDJPY highlights a clear bearish structure following a smart money-driven move. The price action reflects market maker behavior, liquidity manipulation, trendline rejections, and strategic zone targeting. Let's break down the key elements for today’s USDJPY analysis.
🔍 Key Technical Breakdown:
1. 🏦 Liquidity Grab & Fill (July 17th)
The marked green zone shows an aggressive liquidity sweep where the price dipped sharply into a previous demand zone, triggering stop losses and collecting institutional orders.
This movement represents a classic "liquidity fill", often engineered by market makers to trap retail buyers/sellers.
After sweeping liquidity, price quickly reversed upwards — a signal that large buy orders were triggered and filled.
2. 🎯 Central Zone as a Distribution Region
The market retraced to the "Central Zone", highlighted on the chart, which acted as a distribution area:
Price consolidated and created indecision before rejecting sharply again.
This zone reflects a short-term supply where institutional players may have offloaded positions.
Key clue: This consolidation occurred below the major trendline, increasing its strength as resistance.
3. 🔻 QFL Zones (Quasimodo Failure Levels)
Two QFL levels are marked, which denote structure breaks and retracements in MMC/SMC strategy:
First QFL marks a major support break – a signal of shifting market sentiment from bullish to bearish.
Second QFL confirms continued lower lows formation – solidifying bearish market structure.
These levels are critical in identifying market intent and anticipating future moves.
4. 📉 Descending Trendline Rejection
The descending trendline drawn from recent highs is being respected continuously:
Price tested the trendline multiple times but failed to break above.
These rejections represent seller dominance and validate the trendline as a dynamic resistance.
A break above this line would invalidate the current bearish structure.
5. 🎯 Next Target – Major Demand Zone (145.00–145.20)
Price is heading toward a major demand zone marked in green around 145.000:
This area is a strong buy-side liquidity zone, where institutional buyers may show interest again.
If this zone is tapped, we may see either:
A bounce (bullish reaction), or
A breakdown and continuation lower if bearish momentum continues.
Traders should monitor this area closely for price action signals (engulfing candles, rejection wicks, or bullish divergence).
🧠 Strategic View:
Bias: Bearish, unless trendline breaks with strong volume.
Ideal Entry: Look for short entries on lower timeframe pullbacks into minor resistance (like trendline or last supply zone).
Target Area: 145.00 – ideal zone to book profits or switch bias.
Invalidation: A break and close above the descending trendline + central zone.
🔑 Confluences in This Analysis:
Concept Details
✅ Liquidity Grab Trap & Fill strategy at prior lows
✅ Central Zone Bearish distribution and rejection
✅ Trendline Repeated resistance rejections
✅ Structure Lower lows and QFL confirmations
✅ Target Area Clear next demand zone identified
⚠️ Risk Note:
As always, wait for confirmation before entering trades. The market may fake out near zones. Use proper risk management (1-2% risk per trade) and adjust your strategy as new candles form.
📌 Conclusion:
This chart paints a textbook scenario of how institutional movements and structure-based analysis (MMC/SMC) can offer high-probability setups. We expect further downside toward the 145.00 region before any significant reversal. Keep an eye on reaction from this demand zone for the next play.

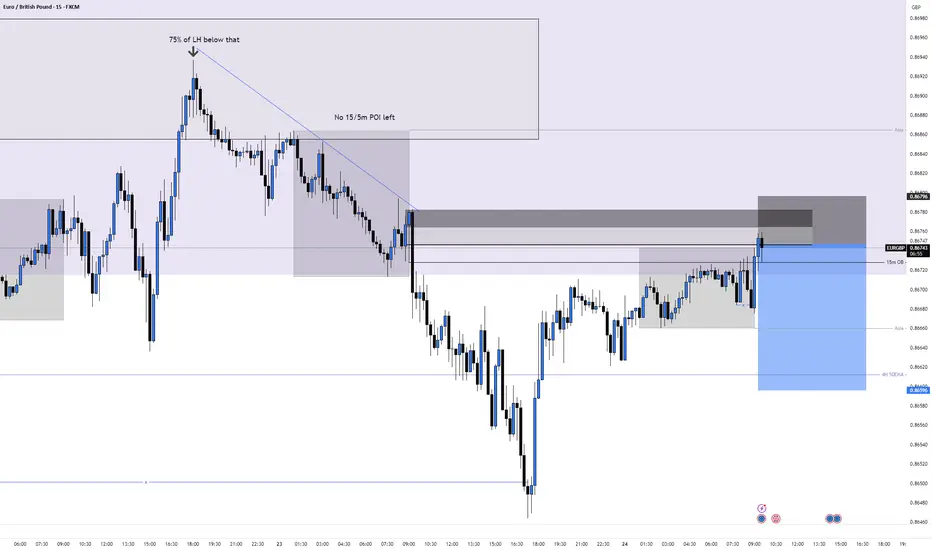
EURGBP Short, 24 July Playing Off 15m POI After HTF Wick Rejection
HTF shows strong rejection from Weekly Highs with clear wick activity, and price tapped into a 4H Orderblock 📉
Structure shifted bearish on LTF with a clean 15m BOS — the last OB from the full move is now in play.
Asia high sits above and can’t be covered with a 10 pip stop, so I used a tighter 5 pip SL to cover just the OB (high probability since no key zones sit above) ✅
📉 Confluences:
– Weekly High wick rejection
– 4H OB tapped
– 15m BOS
– 1m BOS from 15m POI
– Entry from cleaner 5m OB inside 15m OB
🎯 TP: Targeting Asia Low
💰 RR: 5 pip SL improves RR since GU moves slow
🛡️ SL: Tight stop covering only the OB — if invalidated, setup likely fails anyway
BTCUSD Analysis (MMC) : Dual Directional Outlook let's See🔍 1. Overview of Structure & Context:
On the 30-minute timeframe, BTCUSD is consolidating between two strong technical zones:
A descending trendline acting as resistance
A parallel rising support forming a compression zone
This wedge-like formation signals a potential high-impact move in either direction — a dual-directional outlook. Price is currently testing the midpoint between resistance and support, offering two reactive trade scenarios.
🟦 2. Key Zones Highlighted on Chart:
🔹 A. Parallel Support Zone (Dynamic Support):
A grey-shaded rising support has been tested multiple times.
Each bounce suggests buying strength near this diagonal zone.
This zone represents smart money accumulation potential under MMC concepts.
As price approaches this zone again, bulls are expected to step in if momentum aligns.
🔹 B. Descending Resistance Line (Supply Line):
The market is facing lower highs, a sign of bearish control at higher levels.
Each retest of this line has led to a rejection.
This line also acts as a liquidity magnet — price may spike above it to trap buyers before dropping (false breakout potential).
🧭 3. Scenarios and Trade Possibilities (Dual Directional Path):
✅ Scenario 1: Bullish Breakout – (Marked as Path 1)
If BTC breaks above the descending trendline with strong bullish volume, this confirms a structural breakout.
This setup targets:
First level: $119,600
Second level: $120,200
Once broken, the trendline can flip into support.
Ideal confirmation:
Bullish engulfing candle on breakout
Retest of broken resistance turning into support
Volume surge or momentum indicators turning bullish
⚠️ Scenario 2: Bearish Rejection & Breakdown – (Marked as Path 2)
If BTC fails to break resistance and breaks below the parallel support zone, it opens a bearish scenario.
Price may fall back to:
First level: $117,200
Final key support: $116,400 (Major Breakdown Zone)
This is a typical MMC-style mirror move: a structure break leading to liquidity run toward a previous demand zone.
Bearish confirmation:
Close below grey zone
Lower high formation near resistance
Increasing bearish volume / weak bounce
📐 4. Strategy & Trading Tips (MMC Application):
Under the Mirror Market Concepts (MMC), these zones are not just technical levels — they represent emotional price memory of both institutional and retail players.
Wait for the reaction, not prediction.
Use confluence tools (RSI divergence, volume, candle patterns).
Avoid trading inside the wedge — it's a trap zone.
Ideal entries are at breakout with retest confirmation or rejection from major zones.
📊 Risk Management Plan:
Entry Type Trigger Level SL Suggestion TP Range
Long Trade Break & retest above $118.8K Below $118.2K $119.6K → $120.2K
Short Trade Breakdown below $117.8K Above $118.2K $117.2K → $116.4K
🧠 Conclusion:
BTC is in a decision-making zone between a downward pressure line and strong support. A breakout could lead to a clean trend continuation, while a breakdown would trigger bearish momentum. The chart reflects precision MMC logic, offering a tactical map for day traders and scalpers to follow the smart money — not the noise.
Let the market decide direction. We just need to be prepared, not predictive.

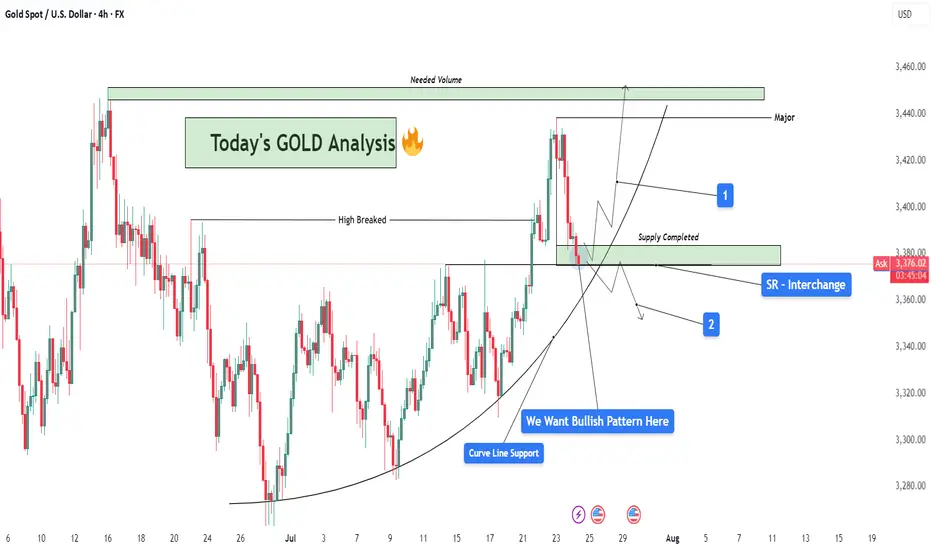
GOLD Analysis : SR Interchange , Reversal Zone + High Break🧠 Market Context & Structural Overview:
Gold has been trading within a clearly defined bullish structure after forming a rounded base pattern in early July, indicating accumulation by smart money. The market recently broke through a key horizontal resistance (previous swing high), marking a potential bullish continuation phase. However, we are now witnessing a pullback — a healthy corrective phase — that is currently testing multiple high-probability confluences.
🧱 Key Technical Zones Explained:
🔹 1. SR Interchange Zone – High Probability Reversal Area:
This area (roughly between $3,360 and $3,380) acted as previous resistance (supply) and has now flipped into support.
This is a textbook Support-Resistance Interchange (SR Flip) — a concept where prior resistance becomes new support.
Traders often look for entries here, especially when it aligns with other technical factors.
🔹 2. Curve Line Support – Dynamic Buyer Strength Indicator:
A curved trendline, often referred to as a parabolic support, has been respecting price structure for over two weeks.
Price is now sitting exactly on this support, signaling potential for another impulsive bullish leg if momentum builds.
🔹 3. Supply Zone Completed – Correction Phase Active:
The supply zone above (approx. $3,420–$3,440) has already been tapped and respected by the market.
This “completed” supply may now act as resistance unless broken with strong volume — we now watch how price reacts at the current pullback zone.
📊 What the Candles Are Telling Us:
The latest candles show some hesitation from sellers — wick rejections and smaller body candles hint at buyer interest at this level. However, confirmation is crucial. We want to see a bullish reversal pattern such as:
Bullish engulfing
Morning star
Pin bar (hammer)
Break and retest of minor resistance inside the SR zone
🔮 Scenarios to Watch:
✅ Scenario 1 – Bullish Continuation (Ideal Setup):
If a bullish reversal forms at this support zone:
Expect a potential rally back to the $3,420–$3,440 resistance area.
If this zone breaks with high volume, price could target the major supply zone near $3,465+, where we’ll need “Needed Volume” for a decisive break.
⚠️ Scenario 2 – Bearish Breakdown (Alternative View):
If the curve support and SR zone fail to hold:
Expect a drop towards $3,345 – $3,320 — where next structural support lies.
This would suggest a deeper retracement or range formation before bulls can regroup.
🧩 Strategy & Psychology:
“We want bullish pattern here.”
You’ve highlighted the importance of not entering impulsively. This is about trading with confirmation, not prediction. Waiting for a valid bullish pattern reduces risk and increases probability.
This is where smart traders win — waiting patiently for confirmation at a zone of confluence.
🧠 Learning Mindset – Why This Zone Matters:
Combines horizontal support, curved trendline, and broken structure retest.
This zone is the battleground between bulls and bears — whoever wins here will likely control short-term momentum.
Newer traders can study this as a classic example of multi-confluence trading, which combines price action, market structure, and dynamic trendlines.
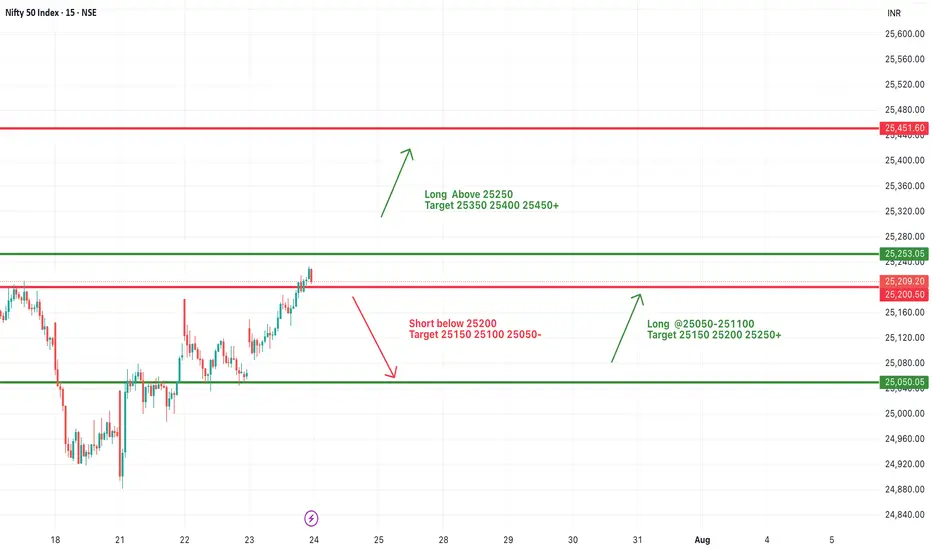
#NIFTY Intraday Support and Resistance Levels - 24/07/2025Nifty is expected to open with a bullish gap-up today, breaching the 25,250 resistance zone. This level has been acting as a consolidation ceiling in recent sessions, and today’s opening above it indicates strong buying momentum in the market.
If Nifty sustains above 25,250, we may witness a fresh upside rally towards the immediate targets of 25,350, 25,400, and 25,450+. A decisive breakout above this zone would mark the continuation of the upward trend and may attract aggressive long-side participation.
On the downside, if Nifty slips and sustains below 25,200–25,250, weakness could resume. A break below 25,200 may lead to a correction toward 25,150, 25,100, and possibly even 25,050-, which will now act as a crucial support zone.
Overall, today's session may remain bullish above 25,250 with momentum trades favored on the long side.
Bullish Momentum Fading? Key Correction Levels Ahead XAUUSD – Bullish Momentum Fading? Key Correction Levels Ahead (23 July)
📰 Market Overview
Gold surged strongly overnight, driven by:
A speech from Fed Chair Jerome Powell, with no hints of resignation or major policy shift.
Rising geopolitical tensions between the US, China, and the EU — with the 1st of August marked as a key deadline.
A notable drop in US bond yields and the US Dollar, triggering increased demand for safe-haven assets like gold.
While today’s economic calendar is quiet, the market remains sensitive to sudden volatility.
📉 Technical Analysis
On the H4 chart, the recent bullish wave shows signs of exhaustion. Reversal candles are now forming on the H1 and M30 timeframes — suggesting a potential correction in the short term.
The 3412 – 3410 support zone will be critical. If price breaks below and invalidates the ascending trendline, we may see a deeper pullback toward lower liquidity zones (FVGs).
Below that, the 335x region offers strong confluence (Fibonacci 0.618 + previous demand zone), making it a prime area for potential long entries if price action confirms a bounce.
📌 Trade Setups to Watch
🔻 SELL ZONE: 3469 – 3471
Stop Loss: 3475
Take Profit Targets: 3465, 3460, 3455, 3450, 3445, 3440, 3430, 3420
→ Wait for a breakout and retest before shorting.
🔸 BUY SCALP: 3385 – 3383
Stop Loss: 3379
TP Targets: 3390, 3394, 3398, 3402, 3406, 3410
→ Ideal for intraday pullback entries with clear structure.
🔹 STRONG BUY ZONE: 3356 – 3354
Stop Loss: 3350
TP Targets: 3360, 3364, 3368, 3372, 3376, 3380, 3390, 3400
→ Great long-term entry zone with technical alignment (liquidity + fib levels).
⚠️ Risk Management Reminder
Even in low-news sessions, markets may spike unexpectedly due to political statements or liquidity sweeps.
Always respect your TP/SL levels — smart trading is protected trading.
💬 Patience breeds precision. Wait for the zone, trust the plan, and manage the trade.

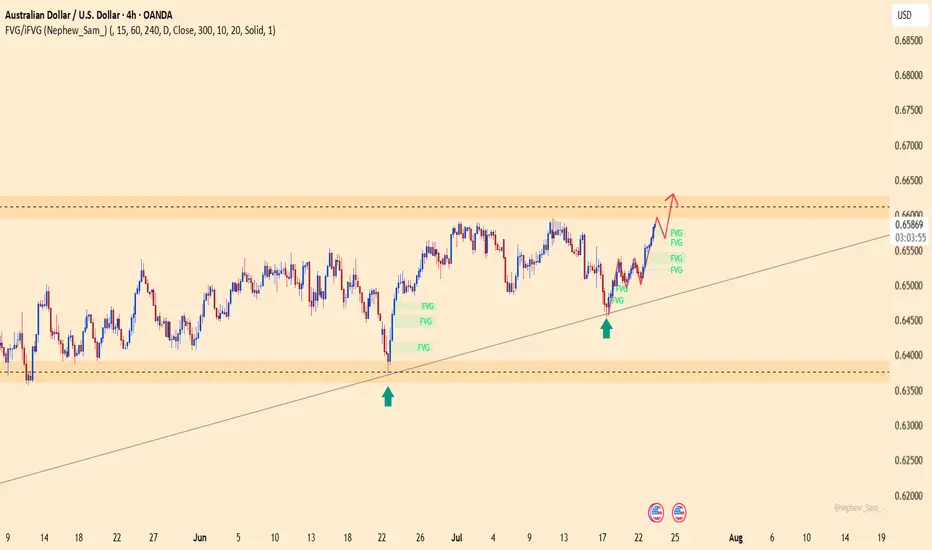
AUDUSD – a rebound from the bottom, ready to break free?After a strong bounce off the ascending trendline, AUDUSD is climbing decisively, clearing out multiple FVG zones on its way toward the key resistance near 0.66300. The bullish structure is intact, and buyers are clearly in control.
News backing the move:
– U.S. S&P Global PMI just came in below expectations, slowing the USD.
– China – Australia’s major trading partner – is signaling fresh stimulus, giving AUD an indirect boost.
If price reaches the 0.66300 zone without strong rejection, this could trigger a breakout that sets the stage for a new rally in August.
Caution: A USD rebound from this week’s data could briefly slow AUDUSD. But for now, the bulls are driving!
GBPJPY – is the end of the range near?After nearly two weeks stuck in the 197.600–200.000 range, GBPJPY has successfully shaken off a bearish fakeout and is now consolidating near the upper FVG zone. The bullish structure remains intact within the rising channel – and this time, the market may not forgive another missed opportunity.
Supporting news:
– UK CPI data released yesterday came in hotter than expected → inflation pressure is back → market expects the BoE to stay hawkish → GBP gains strength.
– Meanwhile, the JPY continues to weaken as the BoJ maintains ultra-low interest rates, setting the stage for this pair to surge.
A breakout above 200.000 could open the door for a push toward the channel top – this could be the ignition point for a major summer rally.

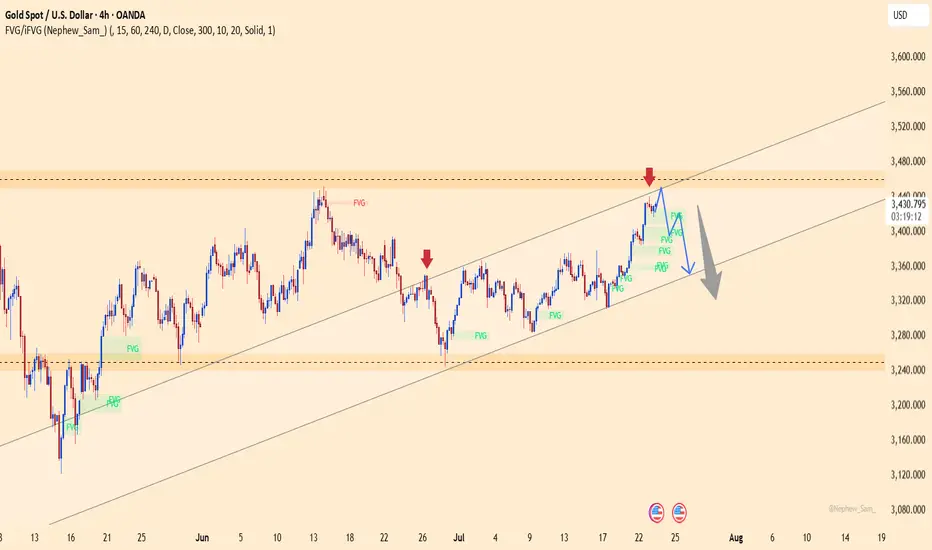
XAUUSD – the final bounce before the fall?Gold has lost its shine — at least for now.
After a relentless climb within the rising channel, price has just “kissed the ceiling” near the strong resistance at 3,447, forming a series of doji candles with long upper wicks — a classic sign of exhaustion. Meanwhile, FVG zones are being filled repeatedly, suggesting that buyers are losing dominance.
But could this final push be a trap?
The familiar script: price dips slightly toward the channel bottom — shaking out weak positions — then breaks straight down to 3,351. This zone once sparked strong rallies, but this time, everything seems to be working against gold.
EURUSD – Recovery losing steam, correction risk is risingAfter rebounding from the trendline support, EURUSD is now approaching the key resistance area around 1.17500 — a zone that has historically triggered multiple rejections. However, with French and German PMI figures coming in below expectations and the ECB holding rates steady without providing any fresh policy guidance, the euro lacks the momentum for a sustained move higher.
On the H4 chart, price action is showing signs of exhaustion as it tests resistance. If buyers fail to break through convincingly, a pullback toward the 1.16800 support zone — or even deeper toward 1.16400 — becomes increasingly likely.
Preferred strategy: Watch for bearish rejection patterns near 1.17500. If confirmed, this could be a favorable opportunity to initiate short positions in anticipation of a correction.

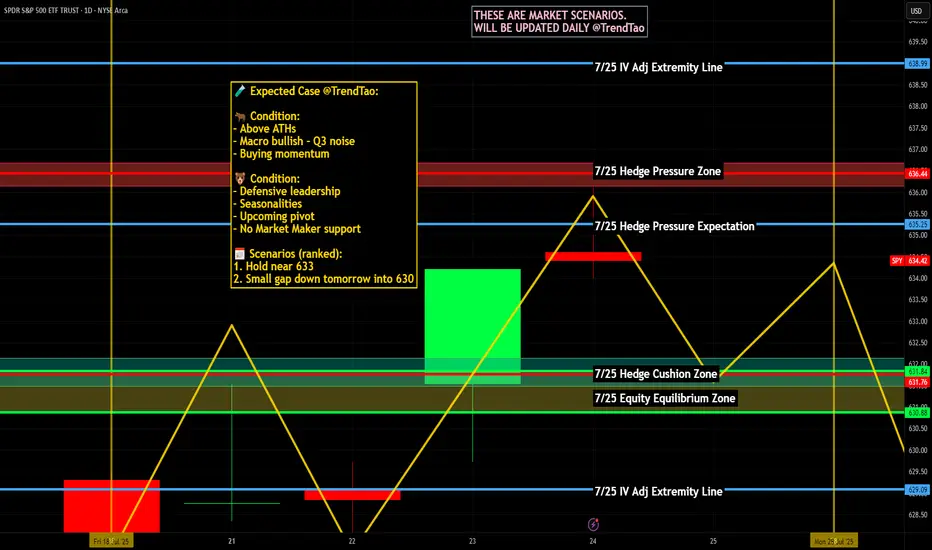
Nightly $SPY / $SPX Scenarios for July 24, 2025🔮 Nightly AMEX:SPY / SP:SPX Scenarios for July 24, 2025 🔮
🌍 Market-Moving News 🌍
🤝 U.S.–EU & U.S.–Japan Trade Optimism Lifts Sentiment
The S&P 500 and Nasdaq hit record-high closes on July 23, fueled by optimism over a potential U.S.–EU trade deal mirroring the U.S.–Japan framework, with the EU-set tariff on autos potentially halved to 15%
💵 Dollar Retreats, Yields Climb
As markets shifted toward risk assets, U.S. Treasury yields increased and gold softened, while the dollar eased—highlighting growing confidence in trade-driven growth news
🏦 Fed Independence Under Pressure—But No July Cut Expected
A Reuters poll shows economists see heightened political pressure on the Fed jeopardizing its independence, though the consensus remains that rates will stay unchanged this month
📊 Key Data Releases & Events 📊
📅 Thursday, July 24:
8:30 AM ET – Initial Jobless Claims
Weekly tally of new unemployment benefit applications—key indicator of labor-market conditions.
10:00 AM ET – New Residential Sales (June)
Tracks signed contracts for new homes, offering insight into housing demand under tightening mortgage rates.
All Day – Trade Headlines & Fed Watch
Continued focus on U.S.–EU trade developments and any follow-up to Fed independence concerns from policy circles.
⚠️ Disclaimer:
This information is for educational and informational purposes only—not financial advice. Please consult a licensed financial advisor before making investment decisions.
📌 #trading #stockmarket #trade #economy #Fed #housing #jobs #technicalanalysis