GBPJPY – breakout loading: final leap to 200.500?After days of compression, GBPJPY is flashing clear signs of an explosive breakout.
Price is holding firmly above the ascending trendline and consolidating right at the top of the FVG zone – a strong signal that buyers are preparing to punch through the 200.500 resistance in one decisive move.
Meanwhile, the JPY continues to lose ground as the BoJ shows no clear intention to hike rates, while GBP gains support on expectations that the BoE will maintain its hawkish stance longer due to persistent core inflation.
Trade setup (reference):
Buy limit: 198.900
SL: below 198.500
TP: 200.500
Technical Analysis

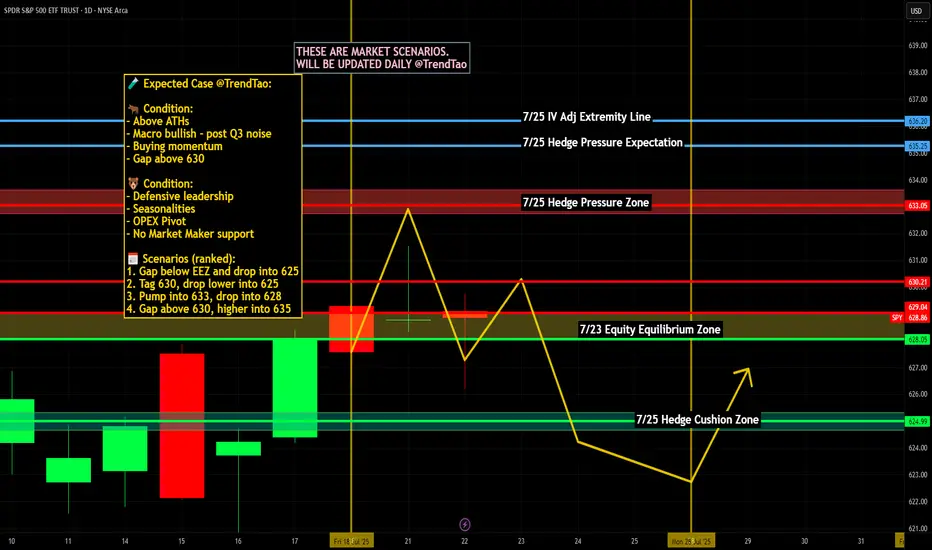
Nightly $SPY / $SPX Scenarios for July 23, 2025🔮 Nightly AMEX:SPY / SP:SPX Scenarios for July 23, 2025 🔮
🌍 Market-Moving News 🌍
📈 Morgan Stanley Stays Bullish
Morgan Stanley reaffirmed its optimistic view, forecasting the S&P 500 will reach 7,200 by mid‑2026. They cited strong earnings and anticipated rate cuts as key drivers, though warned of risks from rising Treasury yields and tariff-related cost pressure
📉 Inflation Debate Reignites
A renewed debate is underway regarding whether tariffs are "transitory" or persistent inflation drivers. Treasury counselor Joseph Lavorgna argued tariff impacts will be one-off, while others caution long-term price pressures may persist, complicating Fed policy directions
🏛️ Calls for Fed Reform Intensify
Treasury Secretary Scott Bessent suggested structural reforms to the Federal Reserve could have greater long-term impact than removing Chair Powell, highlighting ongoing concerns over central-bank governance amid political criticism
💳 Investors Shift to Corporate Bonds
As equity valuations have surged, investors are reallocating toward investment-grade corporate bonds, reducing credit spreads to the tightest levels since 1998—a sign of elevated risk appetite balanced with caution
📊 Key Data Releases & Events 📊
📅 Wednesday, July 23:
(No major U.S. economic releases)
Market focus remains on tech earnings (Tesla, Alphabet) and Fed signals following Tuesday’s Powell address.
⚠️ Disclaimer:
This information is for educational/informational purposes only and does not constitute financial advice. Please consult a licensed financial advisor before making investing decisions.
📌 #trading #stockmarket #economy #tariffs #Fed #earnings #corporatebonds
USDJPYDate:
July 22,2025
Session:
Tokyo and London session
Pair:
USDJPY
Bias:
Long
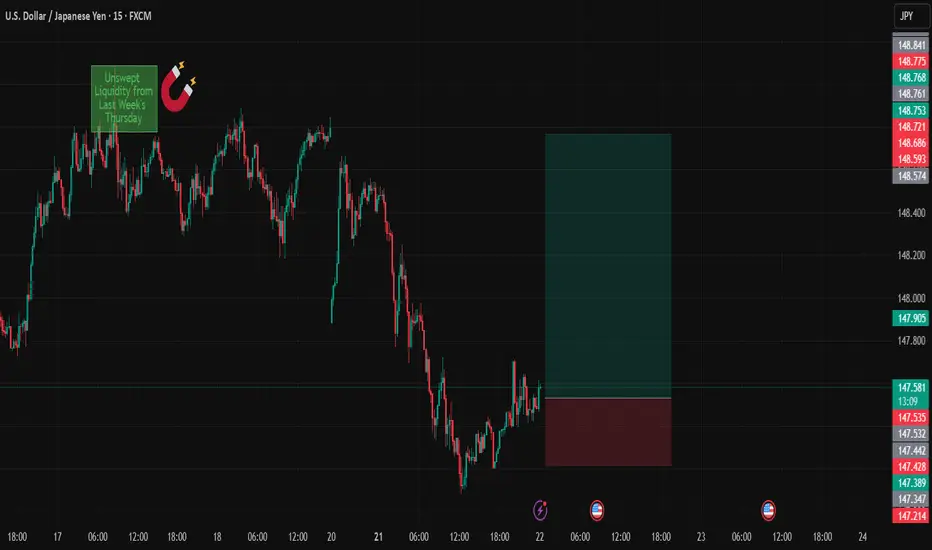
1. Clean liquidity pool left unswept from last week's NYC Open (Thursday).
Took this trade earlier today but looks like price wanted to consolidate in the liquid pool its currently in. I still hold the same idea and think the sweep will definitely take place sometime this week. Now looks like the perfect time to enter. If Asia session cant get it done its up to London and New York session.
Entry:147.534
Stop Loss:147.215
Target:148.768
RR:3.89
NZDUSD Is a Short-Term Rebound on the Table?NZD/USD is down nearly 0.4% in Tuesday’s European session, trading near the key support area of 0.5940 — a confluence of the 0.5 Fibonacci retracement and the midline of a descending channel. The pair is pressured by rising expectations that the RBNZ may cut rates in August, while the USD remains volatile amid uncertainty surrounding trade talks between the US and its key partners.
🔍 Technical Overview – Structure & Momentum
✅ Overall Trend: Bearish short-term (descending channel)
✅ Current Structure: Price is testing key technical support at 0.5940
✅ Volume Profile: VPOC and upper supply zones remain key targets on a bounce
NZD/USD continues to respect the bearish channel structure. However, the support zone at 0.5940 (Fibo 0.5 + recent demand) is showing signs of holding. If price sustains above this level, a bullish correction toward the 0.6006 and 0.6040 supply zones is a valid scenario.
🧭 Trade Scenarios
🔸 Bullish Short-Term Scenario (if 0.5940 holds):
Entry: Buy around 0.5940
TP1: 0.60064 (VPOC + supply zone)
TP2: 0.60400 (OBS sell zone)
SL: Below 0.5905 (sell-side liquidity break)
🔹 Bearish Continuation (if support breaks):
A clean break below 0.5905 confirms downside continuation
Look for retest and short entries targeting deeper channel lows (0.586x–0.583x)
⚠️ Macro Risk Drivers
Growing expectations of an RBNZ rate cut in August
Ongoing US trade negotiation uncertainty with key partners
Potential USD volatility around upcoming macroeconomic releases
📌 Key Price Levels to Watch
Technical Support 0.5940 Fibo 0.5 + mid-channel
Sell-Side Liquidity 0.5905 Bearish confirmation if broken
VPOC + Supply Zone 0.60064 First upside target
OBS Sell Zone 0.60400 Final bullish target / resistance
💬 The descending channel remains in control, but 0.5940 could be the key pivot. Wait for confirmation before entering, and watch volume closely.

Gold 22/07 – Reversal in Sight After $3400? Watch These Key Zone XAUUSD – Intraday Market Outlook (22/07)
Gold posted a strong rally in the previous session, completing its short-term impulsive wave structure. However, as price approached the psychological resistance at $3400, it began to lose momentum, and a clear reversal candle appeared — a signal that today’s session may favour a pullback or correction.
🔍 Technical Overview
After printing a short-term top, gold is now retracing and has reached a critical support area: the FVG High Zone on the H1 chart. If bearish pressure continues and this level fails to hold, price is likely to drop further in search of deeper liquidity zones.
🔽 Key BUY Zones to Monitor Today
✅ Zone 1 – EL (End Liquidity within FVG): 3367 – 3350
→ A zone with strong potential for short-term rebounds due to previous liquidity sweeps.
✅ Zone 2 – Confluence of FIBO 0.5–0.618 + VPOC (3350 – 3335)
→ A technically significant area where multiple factors align — ideal for medium-to-long term entries.
📌 Trade Setup Ideas
🔸 BUY ZONE: 3351 – 3349
Stop Loss: 3344
Take Profit Targets:
3355 – 3360 – 3365 – 3370 – 3375 – 3380 – 3390 – 3400 – ???
🔸 BUY SCALP ZONE: 3366 – 3364
Stop Loss: 3360
Targets: 3370 – 3375 – 3380 – 3385 – 3390
🔻 SELL ZONE: 3420 – 3422
Stop Loss: 3427
Targets: 3415 – 3410 – 3405 – 3400 – 3390 – 3385
⚠️ Market Risk Reminder
While no major economic data is expected today, that doesn’t mean the market will stay calm. Unexpected volatility can still arise from geopolitical tensions or unscheduled central bank comments. Gold tends to compress and break out aggressively in low-news environments.
📌 Protect your capital with disciplined Stop Loss and Take Profit levels — no forecast is ever 100% certain.
📈 Strategic Outlook
Short-term bias: Market is likely to continue correcting
Medium to long-term plan: A deeper pullback could offer an excellent opportunity to build long positions from key demand zones, especially as markets begin to price in potential Fed rate cuts and gold continues its long-term bullish trend.
💬 Be patient, wait for confirmations, and trade with a clear plan — that’s what separates consistency from chaos.

BTC/USD – Bullish Pennant Hints at Potential Continuation >$120KBitcoin remains in a strong uptrend, consolidating just below the $120,000 level after a powerful breakout from the $112K zone earlier this month. Price action has formed a classic bullish pennant pattern on the daily chart, characterized by converging trendlines and declining volume—a textbook setup for trend continuation.
The uptrend remains technically intact, with BTC well above its 50-day SMA ($108.7K) and 200-day SMA ($94.8K), both of which are rising and supportive of bullish momentum. The RSI at 63.2 reflects healthy, but not overbought, conditions, while the MACD maintains a positive crossover above the zero line, though it has started to flatten during the consolidation.
A breakout above the pennant resistance (~$119K) could trigger the next leg higher, potentially targeting a measured move toward the $128K–130K area. However, if sellers manage to push price below the lower pennant boundary and horizontal support at $112K, a deeper correction toward $100K cannot be ruled out.
Bias: Bullish continuation favored as long as price holds above $112K. Watch for a breakout to confirm upside momentum toward new highs.
Time frame: Medium-term (days to a few weeks)
-MW

AUD/USD Channel Breakdown Could Threaten Bullish StructureAUD/USD is currently holding just above the 0.6500 psychological level after retreating from the 0.6558 Fibonacci resistance (61.8% retracement of the October–April decline). Price action has recently broken beneath the lower boundary of a rising wedge pattern—a traditionally bearish signal—raising the risk of deeper downside ahead.
The 50-day SMA (0.6498) and 200-day SMA (0.6399) are converging, with the former now acting as dynamic support following today’s bounce. However, momentum indicators offer limited bullish conviction: the RSI hovers near neutral at 51.5, and the MACD is flatlining just above zero, suggesting a pause in directional bias.
If bears push price back under 0.6500, the rising wedge breakdown could accelerate toward the 200-day SMA and potentially the horizontal support zone at 0.6178. On the flip side, a recovery above 0.6558 would invalidate the wedge and open the door for a run toward the 78.6% retracement near 0.6730.
Bias: Cautiously bearish while below 0.6558, especially if daily closes begin to settle under 0.6500. A loss of the 200-day SMA would confirm a trend reversal.
Time frame: Short- to medium-term (days to weeks)
-MW

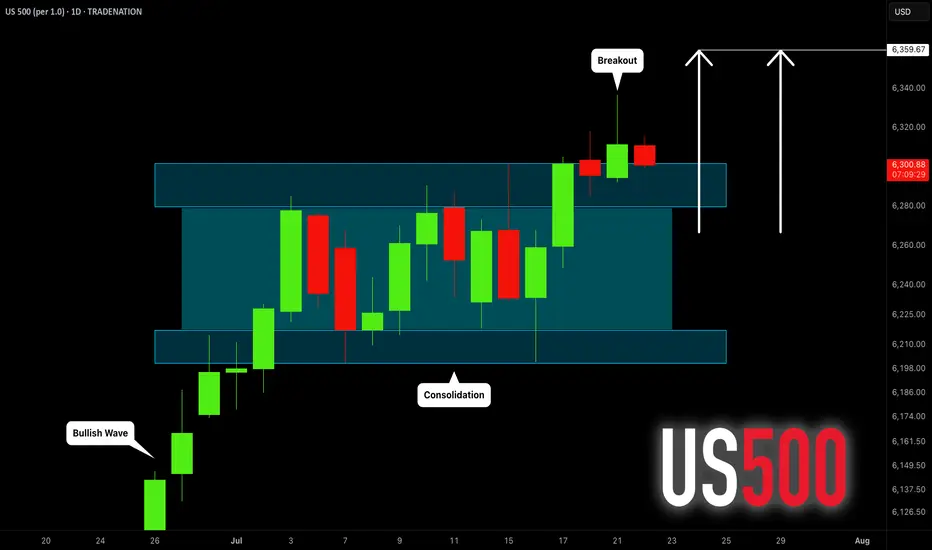
S&P500 INDEX (US500): Bullish Trend Continues
US500 updated a higher high this week, breaking a resistance
of a bullish flag pattern on a daily time frame.
I think that the market will rise even more.
Next goal for the bulls - 6359
❤️Please, support my work with like, thank you!❤️
I am part of Trade Nation's Influencer program and receive a monthly fee for using their TradingView charts in my analysis.
USDJPY Correction Complete, Is the Bullish Trend Back in play?After pulling back from the recent high near 149.17, USDJPY has shown signs of strength again, rebounding off the confluence support at the ascending trendline. The bullish narrative is supported by a hawkish FOMC tone and news that a U.S. federal court temporarily blocked Trump-era tariffs. The pair now awaits upcoming U.S. economic data for further directional clarity.
🔍 Technical Outlook – Structure & Momentum
✅ Primary trend: Bullish
✅ Correction phase: Completed near CP zone and trendline
✅ Key structural areas: FVG Zone, CP Zone, and trendline remain intact
Price has responded positively from the CP Zone + OBS Buy Zone around 147.438, aligning with the uptrend line. As long as this structure holds, buyers may push the market toward the next resistance zones.
🧭 Trade Scenarios
🔸 Bullish Bias (preferred scenario):
As long as price holds above 147.438, we expect continuation toward the FVG zone, with immediate targets at the GAP + OBS Sell Zone (148.703) and extended potential to the Buy-side Liquidity zone at 149.122.
A clean breakout above 149.122 opens the door to Fibonacci extensions: 149.72 and 150.05.
🔹 Bearish Scenario (if invalidated):
If price breaks below 147.438 and loses the trendline, we may see a deeper drop toward the Liquidity Buy Zone at 146.825, where strong buying interest is expected to re-enter the market.
⚠️ Macro Risk Drivers
Hawkish FOMC minutes continue to support USD strength
Paused trade tariffs reduce political headwinds, improving risk sentiment
Upcoming U.S. economic data could trigger sharp intraday moves → watch closely
📌 Key Price Zones
Liquidity Buy Zone 146.825 Major long re-entry zone
CP + OBS Buy Zone 147.438 Current active support
FVG Zone 148.20 – 148.68 Intraday bullish target
GAP + OBS Sell Zone 148.703 Short-term resistance
Buy-side Liquidity Zone 149.122 Final bullish objective
💬 Structure remains bullish unless the trendline breaks. Stay patient, wait for confirmations at key zones, and follow your plan with disciplined risk management.

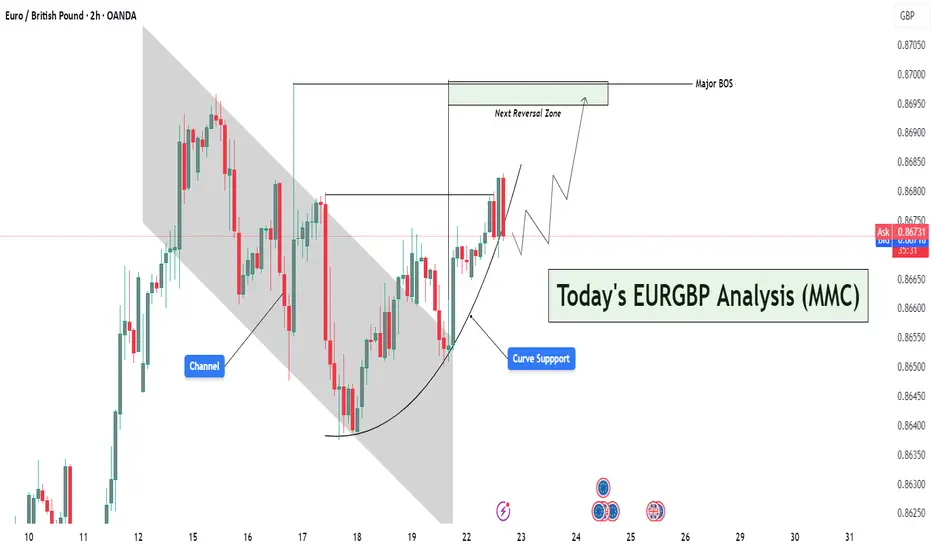
EURGBP Curved Support Breakout – Targeting Reversal Zone🔍 Market Context & Structural Narrative (MMC Style)
The EURGBP pair is currently displaying a textbook MMC structural evolution, transitioning from a bearish trend into a potential bullish leg driven by curve dynamics and trap-break logic.
🔨 Phase 1: Bearish Channel & Trap Formation
The market initially moved within a clearly defined descending channel, which acted as a trap for reactive sellers. Each lower high and lower low within the channel created a perception of sustained bearishness, luring breakout traders and late sellers into short positions.
✅ Key Insight:
This trap zone represents the first step in MMC logic — create a visible structure, generate bias, then prepare for inversion.
🌙 Phase 2: Curve Support – Psychological Accumulation
Around the base of the channel, the market began forming a rounded bottom or curve support. This is a signature MMC accumulation pattern, where market makers gradually absorb sell orders and build long positions without triggering immediate attention.
The curve support has the following implications:
Represents passive accumulation.
Suggests waning bearish pressure.
Builds bullish pressure subtly, often missed by retail traders.
🧠 MMC Mindset Tip:
Curved price action isn't just technical — it's psychological. It represents a controlled shift in sentiment, not an impulsive change, which is what makes it so powerful.
💥 Phase 3: Break of Structure (BOS) – Confirmation of Strength
Price breaks out of both the descending channel and the curved base, leading to a Major Break of Structure (BOS). This BOS is critical, as it confirms the invalidity of the previous bearish narrative and activates a new bullish leg.
📌 This BOS is more than a line — it’s a wall of liquidity getting broken. Price has now closed above key swing highs, which suggests:
Smart money is in control.
Trend shift is validated.
New demand zone created below.
🎯 Projection: The Path to the Next Reversal Zone (NRZ)
Following the breakout, price is projected to:
Possibly retest the breakout level (structure retest) aligned with the curve support — a healthy bullish pullback.
Then move higher towards the Next Reversal Zone (NRZ), which is your defined target area.
📌 NRZ Insight:
This zone is where the market is likely to face:
High liquidity.
Strong previous supply.
Potential profit-taking by early bulls.
Thus, this becomes the make-or-break zone — price either:
Reverses sharply,
Or breaks through and continues the bull rally.
⚠️ Multiple Scenarios Based on MMC Conditions
✅ Scenario 1: Retest & Bounce (Ideal MMC Setup)
Price pulls back to retest the breakout level or the curve support.
Shows bullish confirmation (e.g., pin bar, bullish engulfing).
Targets the NRZ above 0.8700.
❌ Scenario 2: Failed Retest – Fakeout Trap
Price breaks below the curve and structure again.
Suggests that the BOS was a false breakout.
Could re-enter the previous bearish channel structure.
🔄 Scenario 3: Direct Rally Without Retest
Strong momentum buyers push price directly to NRZ.
Wait for reaction at NRZ — could trigger a reversal or continuation depending on price behavior.
🧠 MMC Strategic Takeaways:
Trap → Break → Shift is the psychological framework in play.
The curve is not just support — it's evidence of silent accumulation.
The NRZ isn’t just resistance — it's the battleground where MM logic resolves.
🔐 Trading Insights (Optional Entry Ideas):
Entry: On bullish confirmation near 0.8660–0.8665 (curve/structure support).
SL: Below curve base (e.g., 0.8640).
TP: Near or slightly below NRZ (0.8700–0.8705), partial profits or full exit.
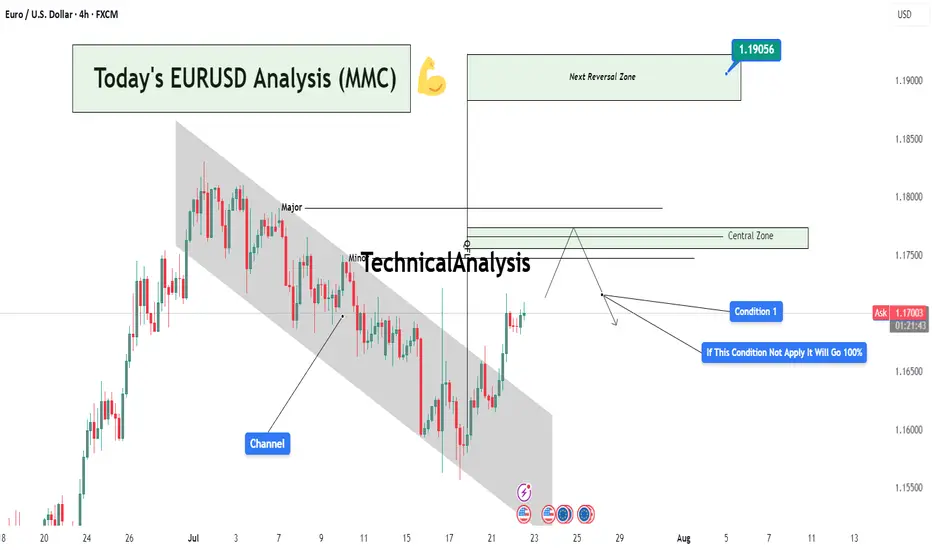
Today's EURUSD Analysis : Channel Break : EURUSD Eyes 1.19056Chart Overview:
The EURUSD pair has broken out of a well-defined descending channel, indicating a potential shift in momentum. Price has now approached a critical Central Zone that acts as a probable reaction or reversal area. This zone lies between minor and major supply levels.
🔍 Key Technical Highlights:
Descending Channel:
Price was previously trapped in a bearish channel. This channel was respected with multiple touches on both upper and lower bounds, showing controlled bearish structure.
Breakout & Momentum Shift:
The recent bullish breakout above the channel suggests buyers are gaining control. A strong candle has closed outside the structure, confirming the breakout.
Major & Minor Zones:
Two levels are marked just above the breakout:
Minor Resistance: First possible supply zone where price may pause.
Major Resistance: A stronger historical level and the top of the Central Zone.
Central Zone Reaction Area (CZRA):
This is the MMC's focus area — price is expected to react here. Either we see a rejection that could confirm a reversal setup, or price slices through, opening the door to the Next Reversal Zone around 1.19056.
📌 Strategic Condition (MMC Logic):
Condition 1:
If price respects the Central Zone and shows bearish signs (e.g., wick rejections, engulfing candles, divergence), we expect a strong pullback or reversal toward previous demand levels.
If Condition 1 Fails:
The annotation clearly states: “If this condition not apply, it will go 100%.”
Meaning: If price breaks and holds above the Central Zone, it confirms bullish strength, targeting 1.19056 — the Next Reversal Zone (NRZ).
📊 Trader's Mindset (MMC Application):
This setup is a classic MMC structure trap-break scenario:
The channel traps sellers,
The breakout invites buyers,
And the Central Zone becomes the battlefield.
Wait for confirmation, not assumption. Whether it's rejection or breakout, risk management and reaction-based trading are key.
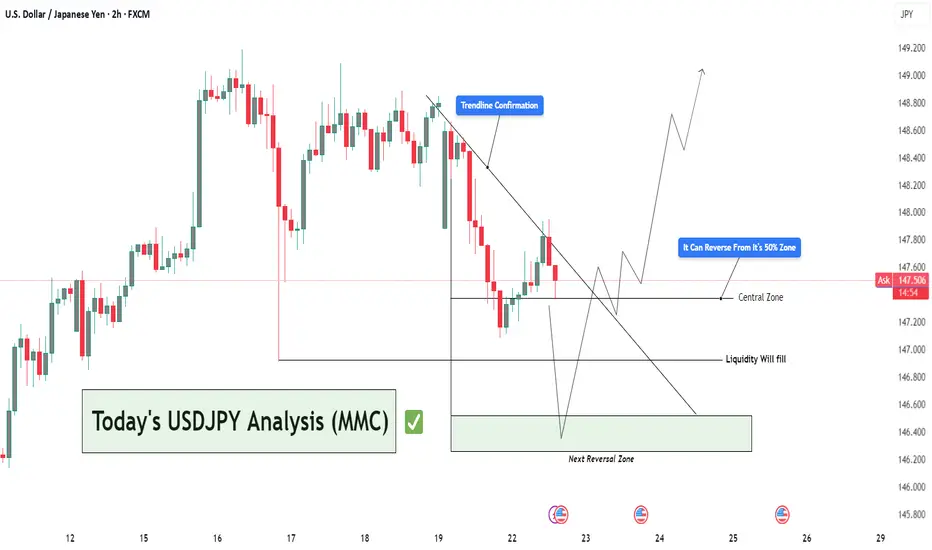
USDJPY Analysis : Trendline Breakout, Liquidity Trap & MMC Zone🔍 Full Technical Breakdown:
In today’s USDJPY 2H chart, the market is unfolding exactly as per Mirror Market Concepts (MMC). We’ve identified a clean trendline breakout, and now price is reacting between the Central Zone (50%) and the Next Reversal Zone, where liquidity is expected to be filled. Let's break down each zone and movement to understand how price is being manipulated and where we can take action.
🔵 1. Trendline Confirmation – The First Sign of Strength
The trendline was tested multiple times from the top, acting as resistance. But recently, price broke above this line with strength, signaling a potential bullish reversal. You've rightly marked it as "Trendline Confirmation" — this is where structure shifted from bearish to bullish.
This is a classic MMC principle — breakout above manipulated resistance, followed by a pullback for re-entry.
The breakout wasn’t just a wick; it had body strength, indicating real buyer presence.
Now, price is pulling back to retest the trendline from above, a typical MMC behavior before continuing upward.
⚖️ 2. Central Zone – The 50% Trap
This zone represents the midpoint of the last major impulsive move. It's where most traders get confused, and institutions re-balance their entries.
You've highlighted: “It Can Reverse From Its 50% Zone” – and that’s accurate.
According to MMC, this is where smart money traps late sellers, takes liquidity, and initiates the next bullish leg.
If price holds above the 147.200–147.500 zone, we could see buyers stepping in aggressively.
🟩 3. Liquidity Fill – Next Reversal Zone
If price doesn’t hold the Central Zone, we don’t panic — this is where MMC becomes powerful.
Beneath current structure lies liquidity — previous stop hunts and unfilled orders.
That area is your Next Reversal Zone around 146.200–146.400.
It’s a liquidity trap — market might dip there just to manipulate emotional traders, then reverse with force.
This is exactly where you’ve written “Liquidity Will Fill” — meaning smart money might fill orders there before moving up.
🧭 Possible Price Paths:
🔼 Bullish Scenario (High Probability):
Trendline retest holds as support.
Price bounces from the 50% Central Zone.
Targets: 148.800 – 149.200 (previous highs and clean breakout zone).
Confirmation: Bullish engulfing candle or strong wick rejection at Central Zone.
🔽 Bearish Trap Scenario (MMC-Based):
Price dips below Central Zone into liquidity zone.
Traps sellers and triggers stop-losses.
Reverses sharply from Next Reversal Zone (Liquidity Zone).
This is where smart money positions themselves for the real move up.
🧠 MMC Insight:
This structure is textbook MMC – clean manipulation zones, false breakout traps, and a trending bias powered by smart liquidity plays.
Trendline breakout = initial intent
Central zone = confusion zone
Liquidity trap = entry for smart money
📢 The goal is not to predict, but to react with precision when the market reveals its hand.
🕒 Timeframe: 2H
📌 Strategy: Mirror Market Concepts (MMC) | Trendline + Liquidity + Midpoint Trap
📈 Bias: Bullish, but waiting for confirmation at either Central or Liquidity Zone
🔍 Sentiment: Cautiously Optimistic
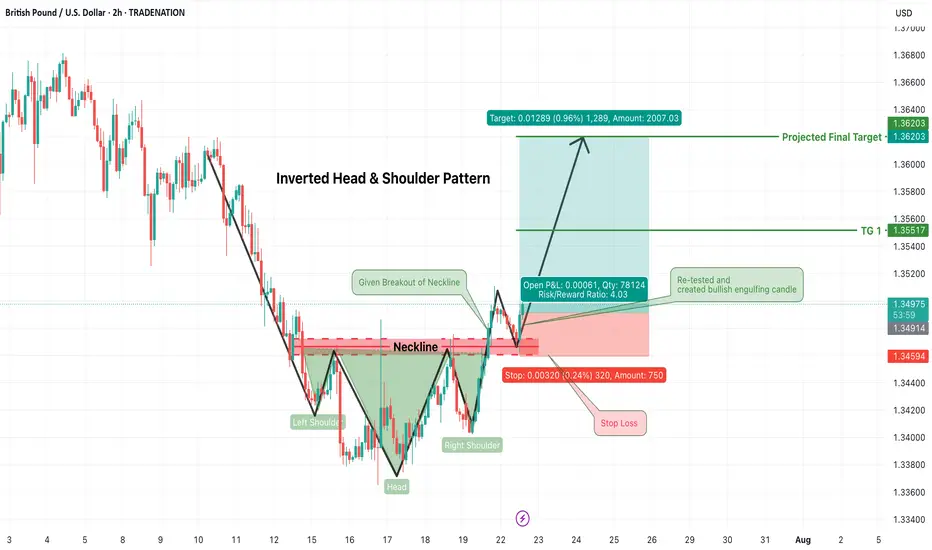
GBPUSD Long Trade Alert – Inverted Head & Shoulders BreakoutGBPUSD has confirmed a classic Inverted Head & Shoulders pattern, signaling a strong bullish reversal opportunity on the 2-hour chart. Price has successfully broken above the neckline resistance zone (~1.3490) and has now retested that zone, forming a bullish engulfing candle — an ideal confirmation for long entries.
🟢 Trade Plan:
Entry: After bullish engulfing candle formed on neckline retest (~1.3490–1.3500)
Stop Loss: Just below the right shoulder low / retest swing low (~1.3455)
Risk/Reward Ratio: ~4:1 (High reward with tightly controlled risk)
🎯 Target Levels:
Target 1: 1.3555
Final Target (Projected): 1.3620
These levels align with structure resistance and measured move of the pattern
📌 Why This Trade Matters:
Pattern confirmed ✅
Retest successful ✅
Bullish confirmation candle ✅
Clean invalidation and upside potential ✅
This is a textbook reversal play, offering solid structure, clear stop placement, and attractive upside. Perfect for swing traders or short-term position setups.
📉 Trade what you see, not what you think. Let price action lead your execution.
=================================================================
Disclosure: I am part of Trade Nation's Influencer program and receive a monthly fee for using their TradingView charts in my analysis.
=================================================================
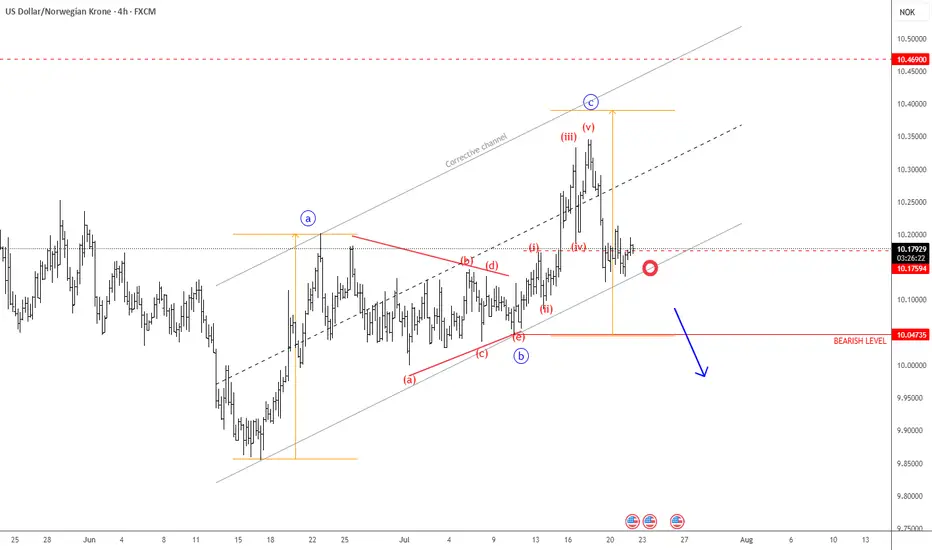
USDNOK Remains BearishUSDNOK made a three-wave rise from the recent low, indicating an abc correction within a downtrend—especially considering the triangle in wave "b" in the middle, and the current sharp decline following a completed five-wave impulse in wave "c". As long as this structure remains intact, there is still a risk of another leg lower. Therefore, we can expect further weakness toward the June lows, especially if it breaks below the channel support line. Just watch out for short-term intraday pullbacks.
BTCUSD Analysis – Supply Pressure vs Demand Rejection 📊 Overview:
This BTCUSD 2-hour chart is giving us a clear structure of how price is currently reacting between a strong demand base and a descending trendline supply. We're at a critical decision point, where both buyers and sellers are gearing up for a potential breakout or breakdown. Let’s break it down level by level.
🟢 Demand Zone – Major Support Holding Firm
The Major Support Zone marked at the bottom of the chart is not just any random area—it has been tested multiple times and acted as a launchpad for bullish moves previously. This is also aligned with the Previous Reversal Zone, which adds confluence to this demand base.
Price dipped into this zone and immediately rejected with strong bullish candles, showing aggressive buyer interest.
This is a high-probability area for long setups as long as price stays above it.
You’ve noted on the chart: “If market closes this supply, we will double it” – that makes sense because a confirmed hold above this base increases the probability of upside continuation.
🔻 Trendline & Supply Zone – The Wall Ahead
Moving up the chart, price is being pressured by a descending trendline, acting as dynamic resistance. This trendline is not just drawn for decoration—it has rejected price at least twice already, and is also intersecting with a minor horizontal resistance zone.
This creates a confluence of resistance, making it a tough wall for buyers to break through without strong volume.
You’ve labeled it as “Evidence 1”, meaning the first confirmation of supply reacting here.
If BTC fails here again, we could easily see another pullback to the 116,800 – 116,400 range.
⚖️ QFL Pattern in Play
The QFL (Quick Flip Logic) is in action, where price aggressively dropped and formed a base, followed by a sharp move up. Price is now attempting to return to that base (demand zone) for a potential flip back upward.
If QFL holds and price breaks above the trendline, this will be a strong reversal confirmation.
This aligns with many institutional trading strategies which look for such formations near support zones.
📈 Potential Bullish Scenario:
Break above the descending trendline resistance
Price sustains above Minor Resistance Zone (around 118,800 – 119,600)
Next target: Major Resistance Zone between 120,800 – 121,200
This could create a higher-high structure and resume overall bullish trend
📉 Potential Bearish Scenario:
Failure to break the trendline
Rejection leads to price retesting the Major Support
If that zone breaks cleanly (especially below 116,400), price may drop toward 115,600 or lower
This opens up a possible short opportunity depending on price action and momentum
🎯 Conclusion:
This chart is a textbook example of consolidation between major zones. Bulls are defending hard at the bottom while bears are pushing down from the top. The direction of the breakout will dictate the next major move. Until then, wait for confirmation, avoid early entries, and let the market show its hand.
🧠 Patience = Profits.
🕒 Chart Timeframe: 2H
📌 Strategy in Focus: Supply & Demand Zones, Trendline Breakout, QFL Base Pattern
📍 Sentiment: Neutral-Bullish (Watching Trendline Reaction)

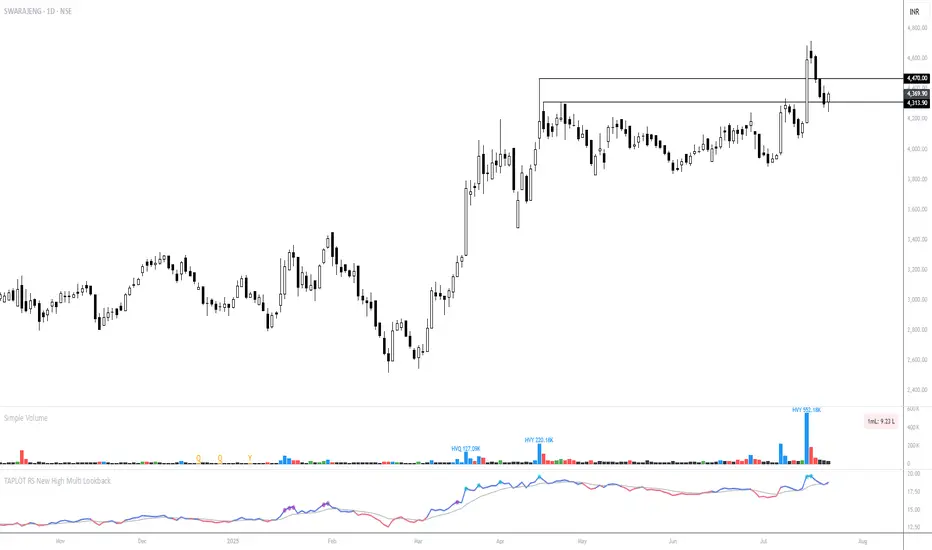
SWARAJENG - Earnings-Driven Breakout & RetestTechnical Overview
Trend: The chart shows a clear upward trend since early 2025. The price consolidated in a tight range for several months before breaking out convincingly.
Breakout: The breakout coincided with a notable spike in volume, indicating strong participation, likely due to robust earnings.
Current Price Action: After the breakout above the 4,313–4,350 resistance zone, the stock surged to fresh highs and is now pulling back, retesting the breakout zone as support.
Technical Setup
Support Levels:
4,350: Recent breakout level, now serving as immediate support.
4,313: Lower boundary of the support zone.
Resistance:
4,490 is the upper part of the breakout zone and the next resistance on upside moves.
Recent high (~4,700): Psychological and technical resistance.
Moving Averages: Price remains above the clustered short-term EMAs, supporting bullish sentiment.
Volume: Heavy buy volume on breakout; lighter volume during the pullback—suggesting selling pressure is mild so far.
Momentum (RSI/TA indicator): Still above the midline, positive but not overbought.
Action Plan
Bullish Scenario:
If price stabilizes and bounces off the 4,313–4,350 support zone—watch for bullish reversal candlesticks (e.g., hammer, bullish engulfing).
Entry: Consider long positions if the stock holds above 4,350 with a clear up-day and renewed volume.
Bearish Scenario:
If price breaks and closes below 4,313 on high volume, expect a deeper retracement (watch for next EMA or previous swing lows as possible supports).
Action: Consider tightening stops or reducing long exposure if the support fails.
Neutral/Wait-and-Watch:
If the price moves sideways or in a tight range near support, wait for clear resolution—either a decisive bounce or breakdown.
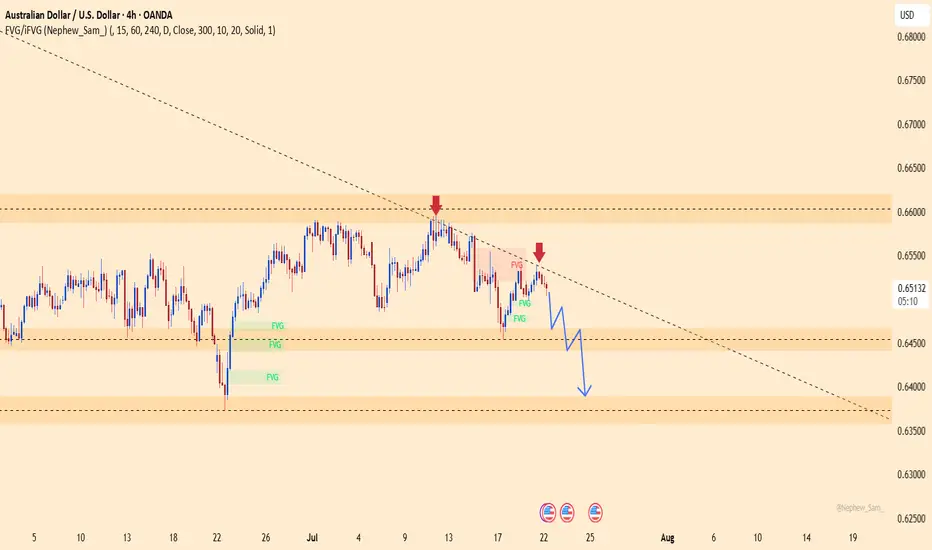
AUDUSD – Sellers taking over, the drop is on!This pair just got slapped hard at the descending trendline, right as it hit a familiar resistance zone. No more doubts – buyers are losing steam, and sellers are waiting to strike.
Market sentiment from Down Under is shaking, with weak economic signals piling up. Meanwhile, the mighty U.S. dollar is reclaiming the spotlight after gold’s flashy surge. The tide has turned!
Unless a miracle shows up, AUDUSD is set to dive deeper – and this is the perfect stage for traders who thrive on strong downtrends.
Sellers are in position – are you ready to join the ride?
Will cryptos lose their appeal, as more regulation comes in?In this new world, where governments and financial institutions are getting more and more interested in cryptos, will those start losing their appeal?
Let's take a look at CRYPTO:BTCUSD
MARKETSCOM:BITCOIN
CRYPTO:ETHUSD
MARKETSCOM:RIPPLE
Let us know what you think in the comments below.
Thank you.
75.2% of retail investor accounts lose money when trading CFDs with this provider. You should consider whether you understand how CFDs work and whether you can afford to take the high risk of losing your money. Past performance is not necessarily indicative of future results. The value of investments may fall as well as rise and the investor may not get back the amount initially invested. This content is not intended for nor applicable to residents of the UK. Cryptocurrency CFDs and spread bets are restricted in the UK for all retail clients.

The EUR & the USD. Events that can affect the move this weekThis week we are monitoring EUR and USD carefully, as we could see some interesting moves, due to some events on the economic calendar. Let's dig in.
FX_IDC:EURUSD
MARKETSCOM:EURUSD
TVC:DXY
MARKETSCOM:DOLLARINDEX
Let us know what you think in the comments below.
Thank you.
75.2% of retail investor accounts lose money when trading CFDs with this provider. You should consider whether you understand how CFDs work and whether you can afford to take the high risk of losing your money. Past performance is not necessarily indicative of future results. The value of investments may fall as well as rise and the investor may not get back the amount initially invested. This content is not intended for nor applicable to residents of the UK. Cryptocurrency CFDs and spread bets are restricted in the UK for all retail clients.

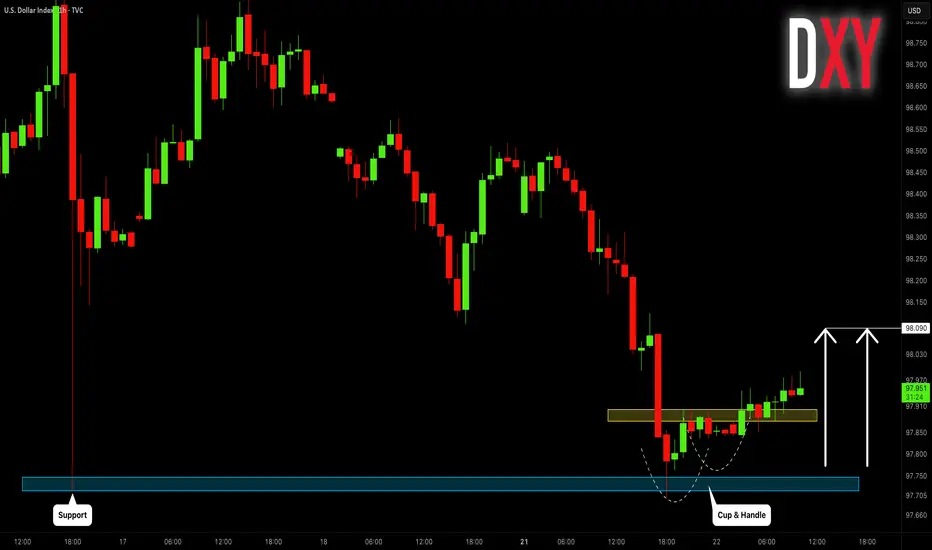
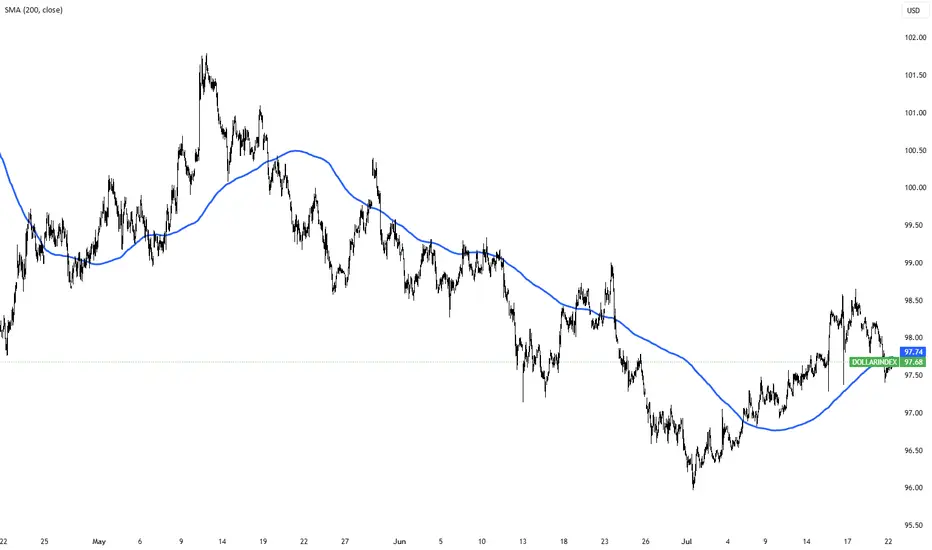
Dollar Index (DXY): Time to Recover
It looks like Dollar Index is going to recover after a yesterday's
rapid fall.
The market reached a key support and formed a cup & handle pattern on that.
We can expect a pullback at least to 98.09 level.
❤️Please, support my work with like, thank you!❤️
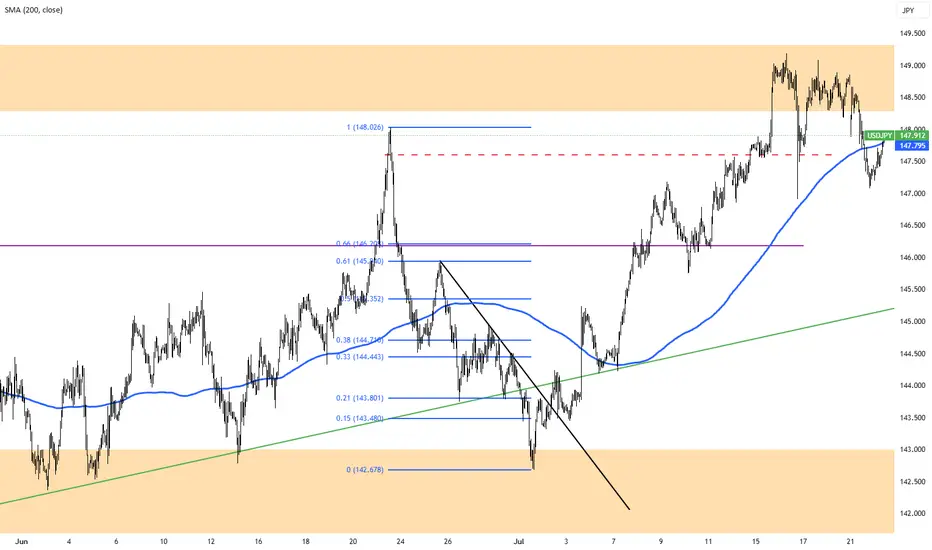
Yen Holds Firm as Ishiba Stays in OfficeThe yen hovered around 147.5 per dollar on Tuesday, holding its 1% gain as markets digested Japan’s election outcome. Despite the ruling coalition losing its upper house majority, Prime Minister Shigeru Ishiba is likely to stay in office, easing political concerns. Ishiba confirmed his continued involvement in US trade negotiations. Meanwhile, opposition parties are expected to advocate for fiscal stimulus and tax cuts, which could pressure the yen and push bond yields higher. Trade discussions with the US remain on schedule for the August 1 deadline.
Resistance is at 147.75, with major support at 146.15.
Dollar Index Holds Below 98 as Markets Await Trade Deal ProgressThe dollar index remained below 98 today, extending its two-day decline as investors watched trade negotiations ahead of the August 1 deadline. Treasury Secretary Scott Bessent said deal quality is the priority, suggesting Trump could grant extensions to countries showing real progress.
Markets are also focused on Fed Chair Powell’s speech for signals on interest rates. Despite Trump’s push for a cut, traders are not expecting action this month.
Gold 22 July 2025 updateGood afternoon, update to last week's post of 21 July on gold, which worked yesterday, new zone to buy, the chart shows everything in detail, so today with the message "brevity is the sister of talent"
#GOLD
BUY LIMIT ZONE 3365-3370
🎯 TP1: 3385
🎯 TP2: 3400
🎯 TP3: 3412
🎯 TP3: 3428
⛔️ Stop loss: 3355
Regards, Totoshka™
