VEDANTA LTD KEY ZONE..This is the 1 hour chart of VEDL.
VEDL is currently trading near its pattern (Broadening) resistance zone in the 462–465 range.
The stock is trading with in a channel, with its support zone in the 440–445 and resistance zone 485-495 range on the hourly chart.
If this level is sustain,we may see higher prices in VEDL
If VEDL breaks below its support zone, we may see lower levels around 415-405 range .
THANK YOU !!
Technicalindicators

SHREE DIGVIJAY CEMENET AT LONG TERM SUPPORT ZONEThis is the Weekly chart of SHREDIGCEM.
SHREDIGCEM is trading near it's long term support zone at 60-70 range.
stock has been moving within a long-term parallel channel, with a well-established support zone in the range of ₹65–₹70.
Currently, the stock is forming a broadening pattern near its support zone, with the pattern support range between ₹70–₹75.
If this level is sustain then,we may see higher prices in SHREDIGCEM.

XAUUSD – NFP STORM AHEADXAUUSD – NFP STORM AHEAD: WILL GOLD BREAK HIGHER OR FACE A DEEP CORRECTION?
Gold is entering a critical phase ahead of tonight’s Non-Farm Payrolls (NFP) report — one of the most influential economic releases globally. With US-China trade tensions resurfacing and growing concerns over US national debt, the precious metal market is likely to experience high volatility during the US session.
🌍 MACROECONOMIC & POLITICAL OUTLOOK
Trade negotiations between the US and China have resumed, with China reaffirming its intent to defend strategic metal exports amidst ongoing tariff threats.
The US national debt is projected to reach $55 trillion by 2034, prompting central banks worldwide to continue stockpiling gold as a hedge against fiat devaluation.
Fed Chair Jerome Powell maintains his stance of “not rushing to cut rates,” but political pressure — especially from former President Trump — is escalating rapidly.
Unemployment Claims fell slightly last week, reinforcing the view of a weakening labour market. If tonight’s NFP print disappoints, gold may surge on renewed expectations of future Fed easing.
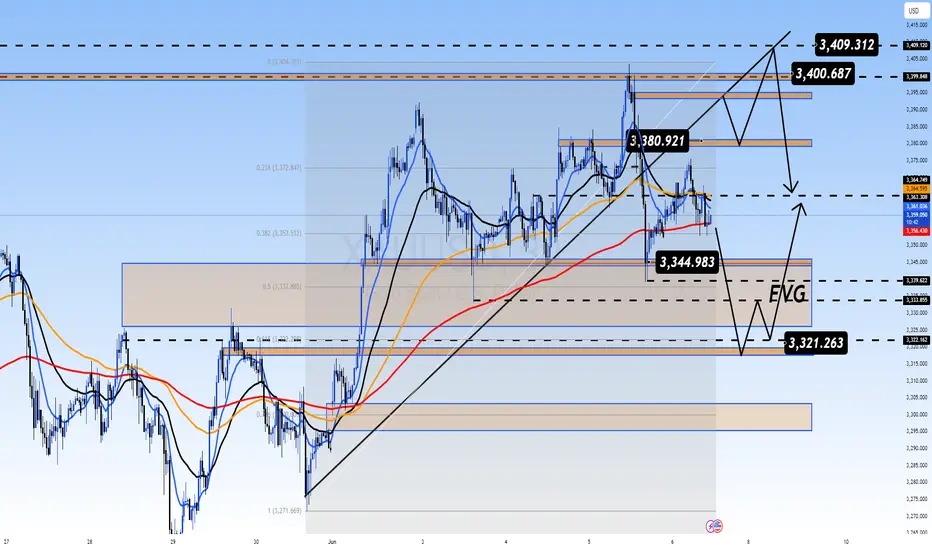
📈 TECHNICAL ANALYSIS (H1 – EMA 13/34/89/200)
Gold has formed a classic impulsive wave structure, with recent highs tested around the 3408 – 3410 resistance zone.
Price action is consolidating near the EMA 89 and EMA 200, suggesting indecision and building energy for a potential breakout.
A breakdown below the 3344 – 3332 support zone could trigger a move toward the FVG liquidity block near 3320, a potential institutional buy level.
🔍 STRATEGIC KEYLEVELS TO WATCH
Resistance levels: 3380 – 3392 – 3408 – 3436
Support levels: 3365 – 3350 – 3344 – 3332 – 3320
🧭 TRADE SETUPS
🔻 SELL ZONE: 3408 – 3410
Stop Loss: 3415
Take Profit: 3404 → 3400 → 3395 → 3390 → 3380 → 3370 → 3360 → 3350
🔵 BUY ZONE: 3318 – 3316
Stop Loss: 3310
Take Profit: 3322 → 3326 → 3330 → 3335 → 3340 → 3350 → 3360 → ???
✅ CONCLUSION
Gold is “holding its breath” before the potential NFP-triggered breakout.
If NFP disappoints → USD weakens → Gold could explode above 3410.
If NFP beats expectations → Sellers may take full control and shift the market into a correction phase.
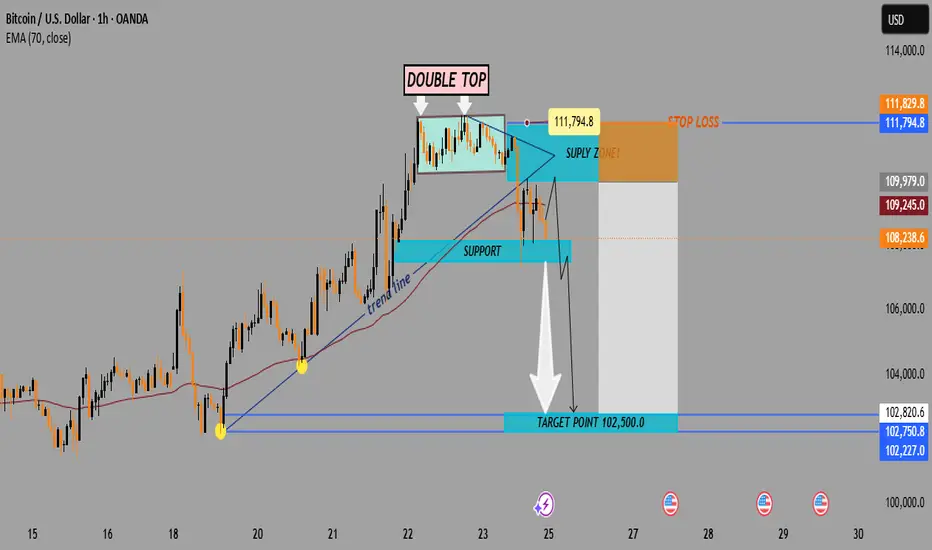
Bitcoin (BTC/USD) 1H Chart Analysis – Double Top Signals BearishPattern Formed: DOUBLE TOP
⚠️ Bearish Reversal Pattern Spotted!
📍 Formed near 111,794.8
⬆️ Price tested the top twice and failed – strong resistance confirmed!
Key Zones:
🔶 SUPPLY ZONE (Resistance):
🟧 111,794.8 - 111,829.8
🔼 Expect selling pressure here!
🔷 SUPPORT Zone (Broken!):
🔻 Price fell below this level, confirming a bearish breakout
🟩 TARGET ZONE:
🎯 102,500.0
✅ This is the likely drop target based on the pattern
🧊 Other minor supports:
* 102,820.6
* 102,750.8
* 102,227.0.
Indicators:
📈 Trend Line
* Supported the price during the uptrend
* ❌ Now broken — indicates momentum shift
📉 EMA 70 (Red Line)
* Current Price (108,238.6) is below EMA 70 = 109,245.0
* Indicates bearish pressure.
Trade Setup:
🔽 Short Entry Idea: After support break
🛑 Stop Loss: 111,829.8
🎯 Take Profit: 102,500.0
⚖️ Risk-Reward looks attractive!
Summary:
📉 Bearish bias confirmed by:
* Double Top pattern
* Supply zone rejection
* Support break
* EMA crossover
🚨 Traders Watch Out: Bears are in control — next major stop likely at 102,500.0!
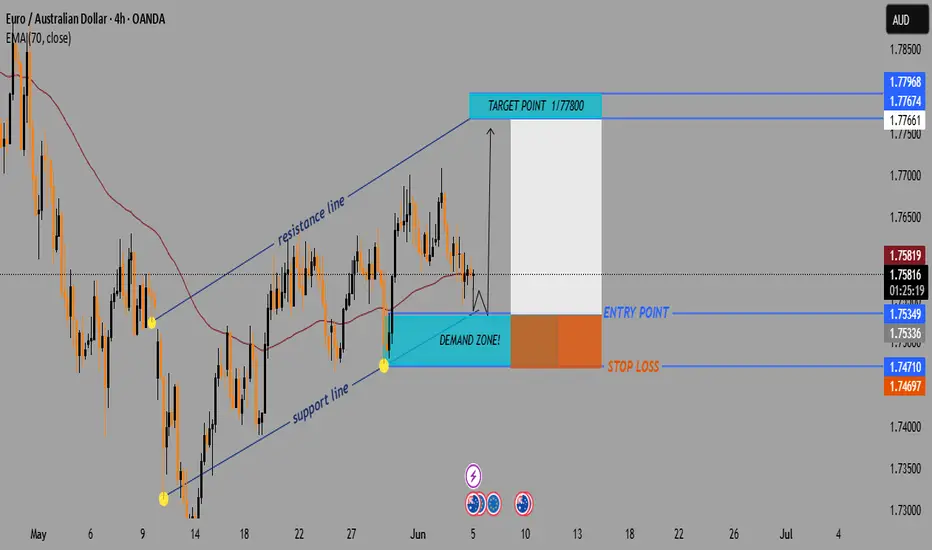
EUR/AUD Bullish Channel Trade Setup –Demand Zone Bounce Strategy📉 1. Downtrend Ends
🔽 Price was falling earlier (left side of chart)
🔄 Then it reversed at the bottom of the channel (yellow dot)
➡️ Trend Change Begins
📈 2. Uptrend Channel Forms
📊 Channel consists of:
🔵 Resistance Line (upper blue)
🟢 Support Line (lower blue)
🔁 Price is bouncing between these two lines like a pinball:
🔵 Resistance Line
| 🔼
🟢 Support Line
💠 3. Key Trading Zone
🔷 DEMAND ZONE: (Bright blue box)
🟦 Between 1.74697 and 1.75349
👉 Buyer interest expected here
🎯 4. Trade Setup (Bullish Idea)
🟢 Entry Point:
📍 1.75349
✨ Near support zone and channel bottom
🔻 Stop Loss:
🚫 1.74710
📉 Below the demand zone, protects from downside
🎯 Target Point:
🎯 1.77800
📈 Near the resistance line at the top of the channel
📊 Strategy Flow (Emoji Dots Path)
📉 🔽 🔽 🔽
🟡 Bottom found
⬆️ 🔼 🔼 🔼
📈 Enters channel
🟦 Price enters DEMAND ZONE
🔽
🔵 Entry: 1.75349
🔼
🎯 Target: 1.77800
✅ Final Thoughts
This is a clean bullish setup within a rising channel
✅ Wait for price action confirmation (like a bullish candle 🕯️) in the demand zone
🔒 Protect with your stop loss
🚀 Potential reward is strong if it bounces up
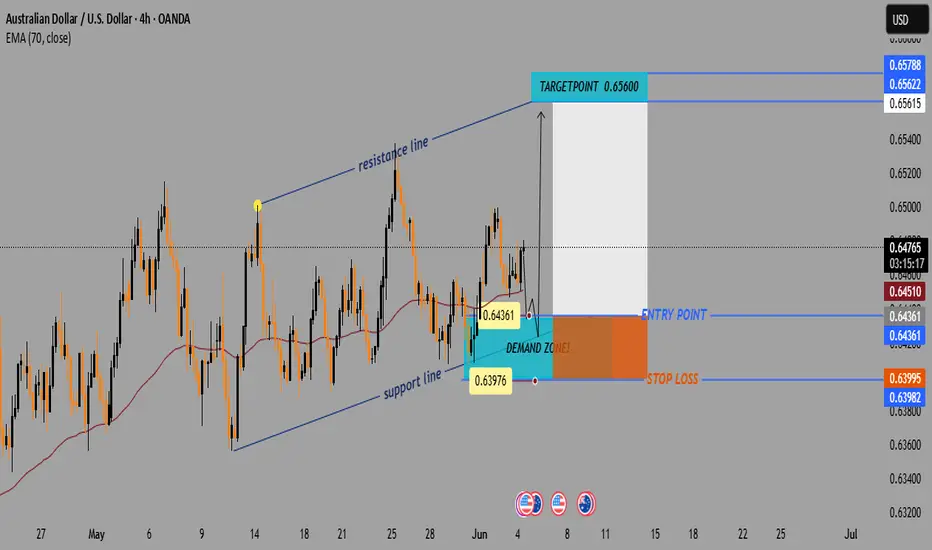
AUD/USD Bullish Setup: Demand Zone Bounce Toward 0.65600📈 Price Channel Analysis
🔼 The pair is moving within an ascending channel: • Support Line 🟦 – lower trendline showing bullish structure
* Resistance Line 🟥 – upper boundary acting as potential target
💡 This suggests bullish momentum is intact unless the price breaks below support.
📌 Key Trade Levels
🔵 Entry Point: 0.64361
* 👇 Positioned just above the DEMAND ZONE
* 📍Near the 70 EMA — a key dynamic support
🟨 Demand Zone: Area between 0.6400 – 0.6436
* 🧲 Buyers are expected here
* Good spot for a bullish entry
🔴 Stop Loss: 0.63995
* 🚨 Below the demand zone = limited risk
🟢 Target Point: 0.65600
* 🎯 Aligned with the upper resistance line
* Nice upside potential
⚙️ Technical Indicator
📉 EMA 70 (red line) = 0.64510
* Price is bouncing near it
* 📊 Acts as trend support — confirming buy idea
📊 Risk-to-Reward Ratio
🔻 Risk: ~36 pips (Entry → Stop Loss)
🔺 Reward: ~124 pips (Entry → Target)
✅ R:R Ratio ≈ 3.4:1 👍
🧠 Trade Idea Summary
📘 Trade Type 🔼 Buy (Long)
💰 Entry 0.64361
🛑 Stop Loss 0.63995
🎯 Target 0.65600
🌟 Bias Bullish
🔍 Final Thoughts
✅ Strong setup within a bullish channel
📉 EMA support + 🟦 Demand zone = Good confluence
📅 Watch out for USD news (see icons below chart)
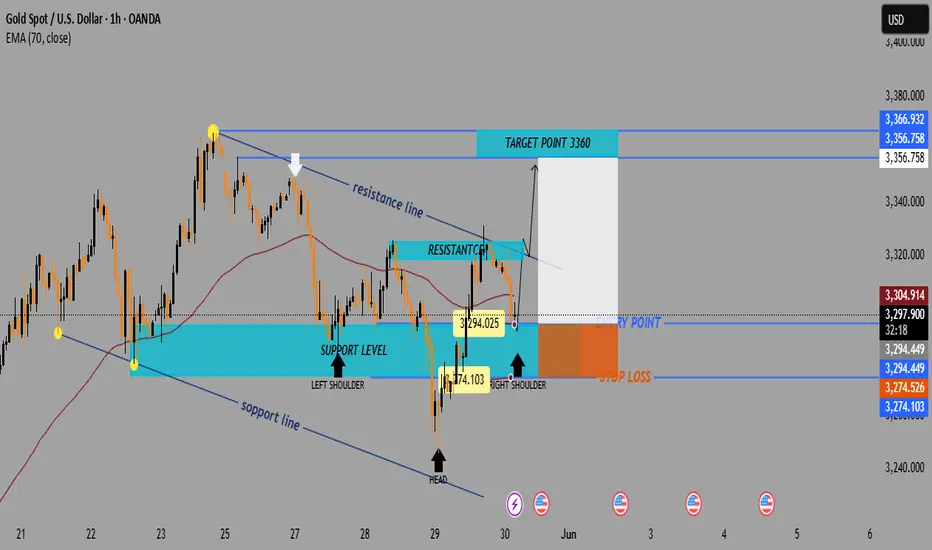
Gold (XAU/USD) – Inverse Head & Shoulders Breakout Setup🧠 Chart Pattern Identified: Inverse Head & Shoulders
🟡 Left Shoulder ➡️ Formed at a local dip.
⚫ Head ⬇️ Deepest low around 3,274.103.
🟡 Right Shoulder ➡️ Bouncing near the same zone.
🔁 This is a classic bullish reversal pattern — a break above the neckline could signal a strong upside move.
📊 Key Levels & Zones
🔵 Support Zone:
🟦 Area: 3,274 – 3,294
✅ Strong bounce seen here (highlighted by the head and shoulders base)
🔵 Resistance Zone:
📏 Just below 3,305 (marked as neckline)
✋ Price must break this to confirm the reversal
🔵 Target Point:
🎯 3360 📈
📏 Based on the height from head to neckline
🔵 Stop Loss Zone:
❌ 3,274.526
🔻 Below the head for safe risk control
⚙️ Trading Setup Summary
🔹 📍 Entry Point:
📌 Around 3,294.449
🚪 Enter on breakout above neckline
🔹 🎯 Target Point:
🏁 3360
🔹 🛑 Stop Loss:
🚫 3,274.526
🔹 Risk-Reward Setup:
🔍 Targeting a move of ~65 points
⚖️ Risk of ~20 points → solid R/R ratio
📈 Indicator:
🧮 EMA 70 ➡️ 3,305.005
⏳ Price currently testing it — a break above EMA would boost bullish confirmation.
📅 Economic Events:
📆 Multiple event icons suggest upcoming news — expect volatility!
⚠️ Be cautious during these times.
✅ Final Thoughts:
📊 Pattern suggests a bullish breakout is near 🚀
🔒 Use stop-loss and enter after breakout to manage risk effectively
🎯 Keep an eye on volume during breakout — it confirms strength
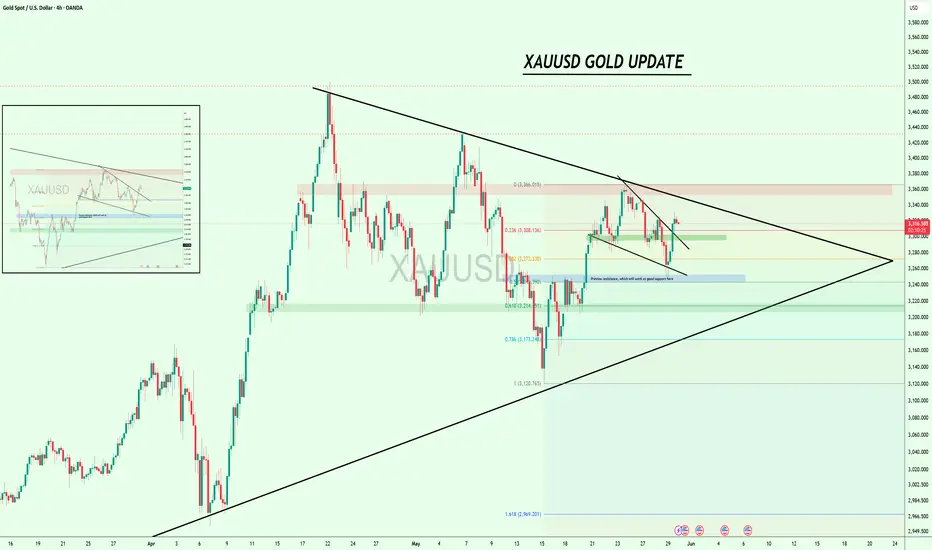
Gold Holding Pattern – Key Resistance AheadHey, friends
On the 4-hour time frame, TVC:XAU is forming a symmetrical triangle pattern, but we haven’t seen any breakout yet, we’re still trading inside the triangle.
If we look at the LTF, we’re currently at the 0.236 FIB level, which isn’t a very strong buying zone, but technically, we’ve broken out of a falling wedge and are now retesting it.
That looks pretty good, and if this setup plays out well, we could see an upward move toward $3,470.
However, there’s a strong resistance around $3,350 to $3,370 that we need to break first. If we break that, it will also confirm the breakout of the symmetrical triangle from the 4-hour chart.
So keep an eye on those areas!
#GOLD #forextrading
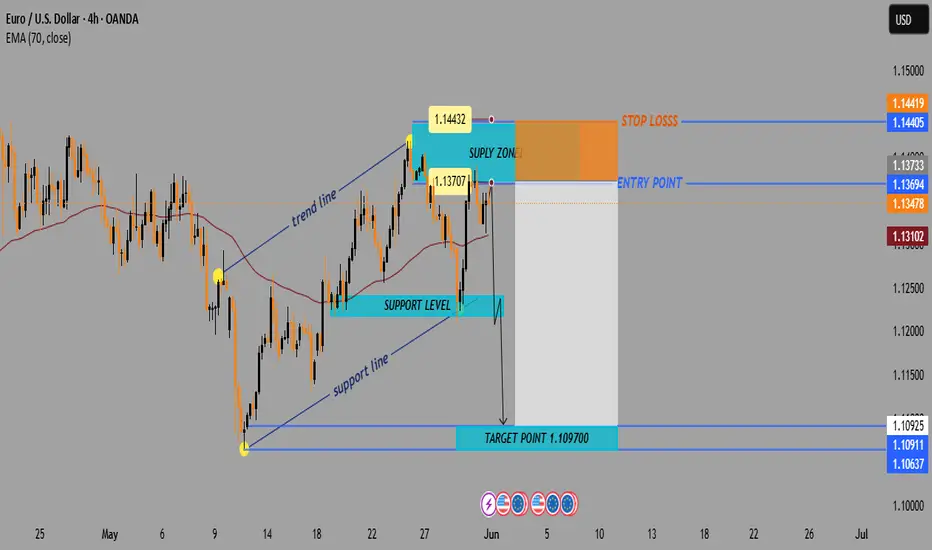
EUR/USD4H Bearish Trade Setup Supply Zone Rejection with 3:1 RRR🔷 Trend Overview
📈 Price was in a rising channel (trend line + support line).
❌ Channel broken on downside → potential trend reversal.
🟧 🔼 Supply Zone (Sell Area)
📍 Zone: 1.13707 – 1.14432
🟠 Price faced rejection here.
💡 Institutional selling likely in this zone.
🔥 This is the ideal short-entry area.
🟦 🔽 Entry Point
🎯 Entry: Around 1.13694
🧩 Sits just below supply zone = safer trigger.
✅ Wait for a bearish confirmation candle before entering.
🟨 Support Level
📉 Support Zone: ~1.13100 – 1.13400
📊 Recently broken with a strong bearish candle.
🧱 Used to act as a floor, now may act as resistance.
🟩 🎯 Target Point
✅ Take Profit: 1.10970
📎 Matches previous structure support.
💰 Lock in profits before the psychological level at 1.1100.
🟥 ⛔ Stop Loss
❌ Stop: 1.14419
📏 Placed above the supply zone for protection.
🛡️ Shields from false breakouts or spikes.
⚖️ Risk-to-Reward Ratio (RRR)
💡 Approx. 3:1 ✅
📉 Risk: ~70 pips
📈 Reward: ~270 pips
🔥 High-probability setup
📌 EMA (Exponential Moving Average – 70)
📍 EMA 70 at 1.13102
🔻 Price is below the EMA → favors bearish momentum
🧠 Pro Tips:
🔍 Watch for bearish engulfing or rejection candles at the entry zone.
🗓️ Be aware of major news events (ECB, Fed).
🧮 Adjust lot size for risk management (based on SL size).
✅ Summary:
🧩 Element 📊 Value
Trade Type 🔻 Short (Sell)
Entry Point 📌 1.13694
Stop Loss ⛔ 1.14419
Take Profit 🎯 1.10970
RRR ⚖️ ~3:1
Sentiment 📉 Bearish
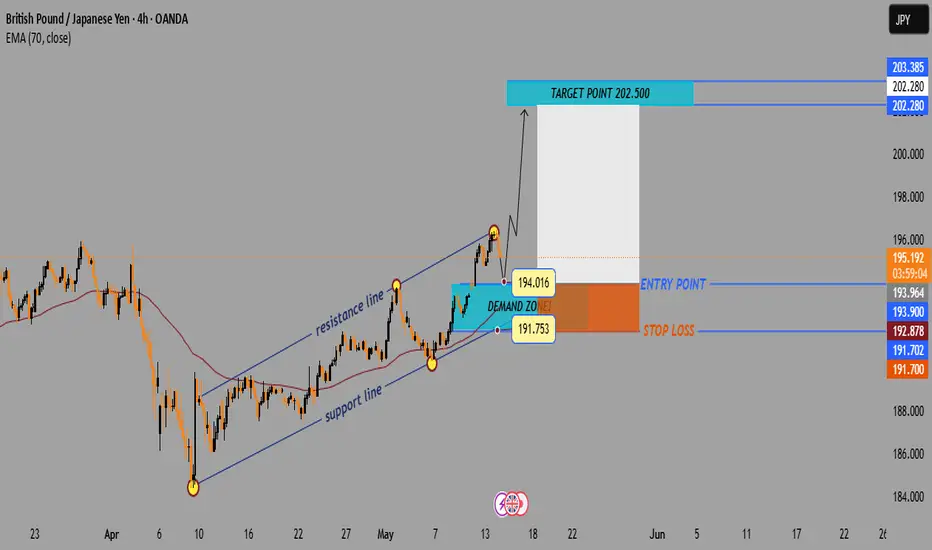
GBP/JPY 4H Chart Analysis – Bullish Channel Setup📈 Trend:
Price is moving in an ascending channel
🔵 Support line below
🔴 Resistance line above
---
Key Zones & Levels:
📍 Demand Zone (Buy Area):
Between 191.753 – 194.016
Price might bounce here before continuing up
🔵 Likely pullback expected here
🎯 Target Point:
202.500
🚀 If price respects the demand zone, this is the upside target
🟢 Entry Point:
Around 193.964 – 194.016
Optimal buying zone before the projected rise
❌ Stop Loss:
Below 191.700
🛑 Placed to minimize losses if price breaks down
---
Indicators:
📉 EMA (70):
Currently at 192.816
✅ Acting as dynamic support
---
Trade Plan Summary:
🔄 Wait for a retracement into the Demand Zone
🛒 Enter long near 193.964
⛔ Stop loss at 191.700
🎯 Target at 202.500
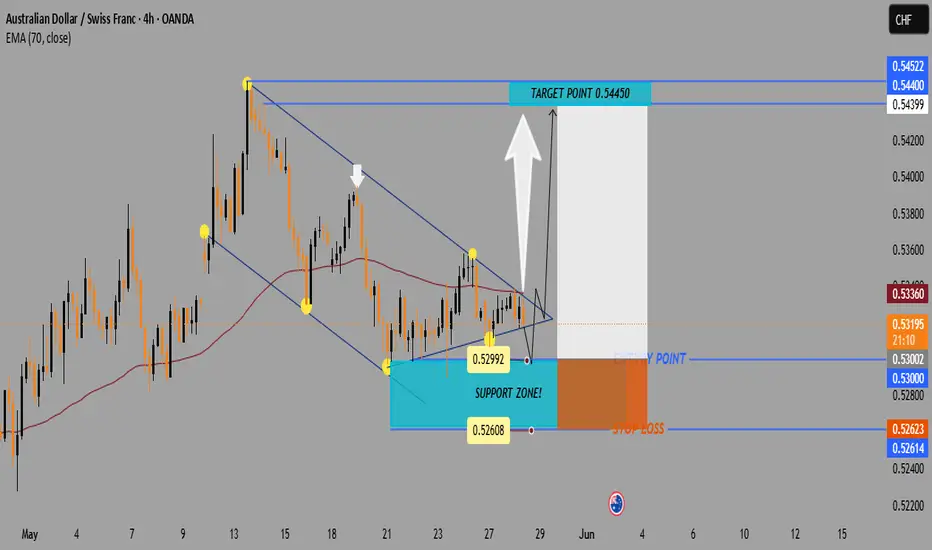
AUD/CHF Breakout Alert: Bullish Setup from Descending Wedge!🔻 Pattern: Descending Wedge
📐 Formed by lower highs and higher lows.
🟡 Indicates price compression — often a bullish breakout setup!
🔼 Breakout direction expected: UP
🟦 Support Zone
📍 Located around 0.52614 – 0.53000
📉 Price bounced multiple times here — strong buying interest
🛡️ Acts as a demand zone
🟢 Entry Point
🎯 Entry range: 0.53000 – 0.53188
💥 Breakout candle appears ready to close outside the wedge
⚡ Momentum may be building for a push higher
🎯 Target Point
🔵 Target: 0.54450
📈 Near recent highs — aligns with pattern breakout projection
🎉 Aiming for a good profit zone
🔴 Stop Loss
❌ Stop loss: 0.52623
🛑 Below the wedge and support — protects from a false breakout
⚖️ Keeps risk-reward ratio attractive
📊 Indicator
🧭 EMA 70 (Red Line) at 0.53360
🔄 Price hovering near it — crossing above = bullish signal
📌 Trade Setup Summary
🔸 Pair: AUD/CHF
🔸 Timeframe: 4-Hour (4H)
🔸 Pattern: Descending Wedge
🔸 Bias: Bullish
🔸 Entry: 0.53000 – 0.53188
🔸 Target: 0.54450 🟢
🔸 Stop Loss: 0.52623 🔴
✅ Conclusion
🚀 If price breaks above the wedge and EMA, this could be a high-probability long trade.
📏 Tight stop, wide target = good risk/reward setup!
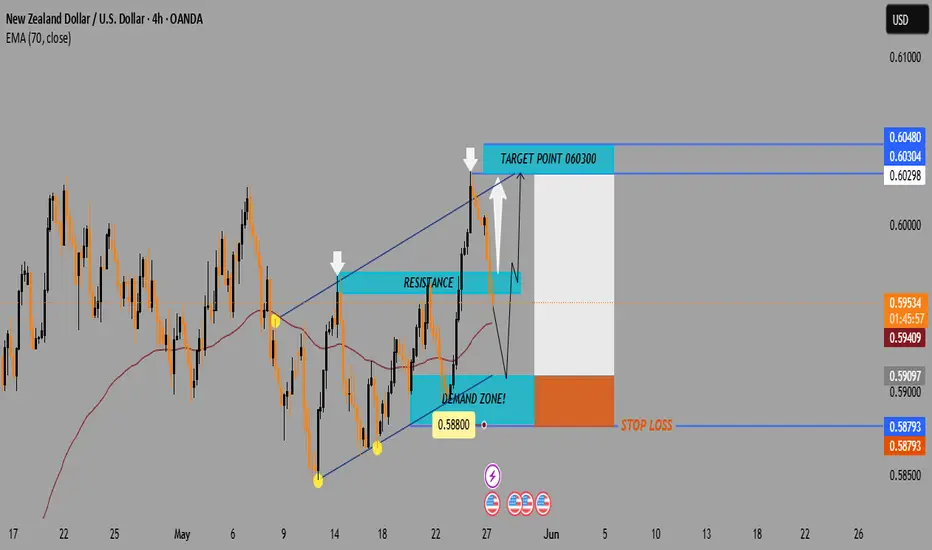
NZD/USD4H Chart Analysis Bullish Reversal Setup from Demand Zone📈 Price: 0.59552
📊 EMA 70: 0.59410 (🟤 Brown Line)
Chart Zones & Key Levels
🔷 Resistance Zone:
🔼 Around 0.60298 – 0.60304
🔹 Price reacted strongly here (🔽 white arrows)
🔹 Acts as a ceiling for now
🟢 Demand Zone:
🔽 Around 0.58800
✅ Buyers stepped in here before
📉 If price drops again, might bounce from here
🟥 STOP LOSS:
❗ 0.58793
🔸 Protects from deeper losses if trend breaks down.
TRADE IDEA
1️⃣ Entry Idea: Wait for a pullback into the Demand Zone
📉⬇️
2️⃣ Bullish Reversal Expected:
⬆️ Bounce toward Target Zone
🎯 Target Point: 0.60300
🟦 Profit zone marked in blue
💸 Good Risk/Reward ratio.
Indicators & Pattern
📐 Wedge Pattern:
🔹 Bullish breakout potential
🔹 Currently respecting the channel
📉 EMA Crossover Area:
🔸 Could act as dynamic support/resistance
🟤 Price hovering around EMA (0.59410)
Summary:
✅ Buy Setup if price holds above 0.58800
🎯 Target: 0.60300
🛑 Stop Loss: 0.58793
⚠️ Watch the price reaction at the Demand Zone for confirmation!
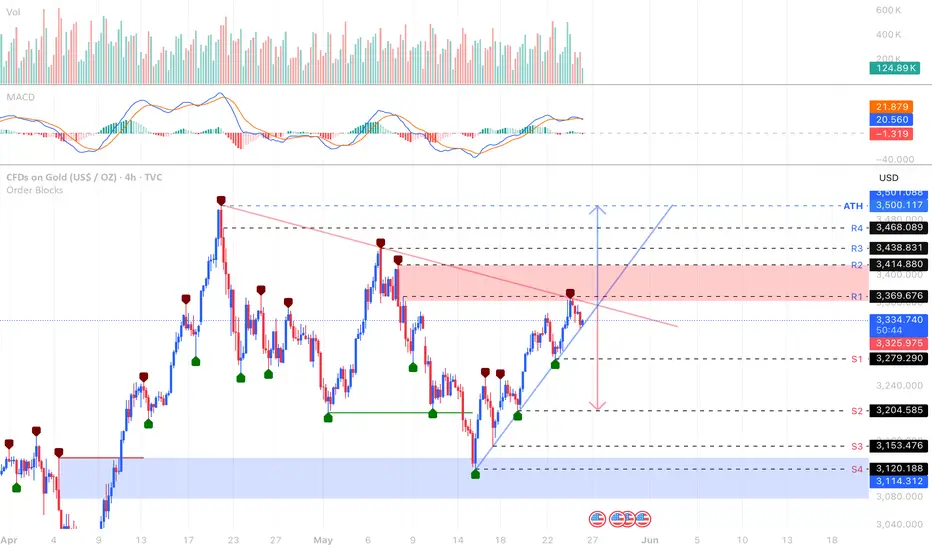
GOLD 4H - Key Reversal or Breakout Incoming ?It’s been an incredible run for GOLD leading up to this point, however we are now currently testing a major inflection zone around the $3,369–$3,414 level (R1-R2), intersecting both a bearish supply zone and descending trendline resistance. Price thus far has been riding a strong bullish trendline from mid-May, forming a clean ascending structure.
We’re now at a decision point:
• Bullish scenario: If price breaks above the 33669 (R1) & $3414 (R2) levels and holds, we could see a sharp move toward the ATH at $3,500. This would confirm trendline support and invalidate the supply zone.
• Bearish scenario: A rejection here could break the trendline and send gold back down to $3,280 (S1), with deeper targets around $3,205 (S2) if momentum accelerates.
MACD looks like it’s losing momentum and volume has been drying up a bit on this leg higher, possibly hinting at bullish exhaustion up here.
Considering the big picture context: FED rate cuts loom further out now with inflation still sticky, which puts pressure on gold short term. But longer term, central bank demand + global economic uncertainty still keeps the bias tilted bullish overall.
Position: OPEN
I still have my long position open from $3205ish however I did trim some on Friday and currently waiting for confirmation, it’s either a breakout & retest to the upside or a clean breakdown of the ascending trend line for shorts.
Daily / 4hr time frames are key here, watch for a close above or below for confirmation.
Let the market show its hand.
All the best dear traders and good luck for the week ahead !
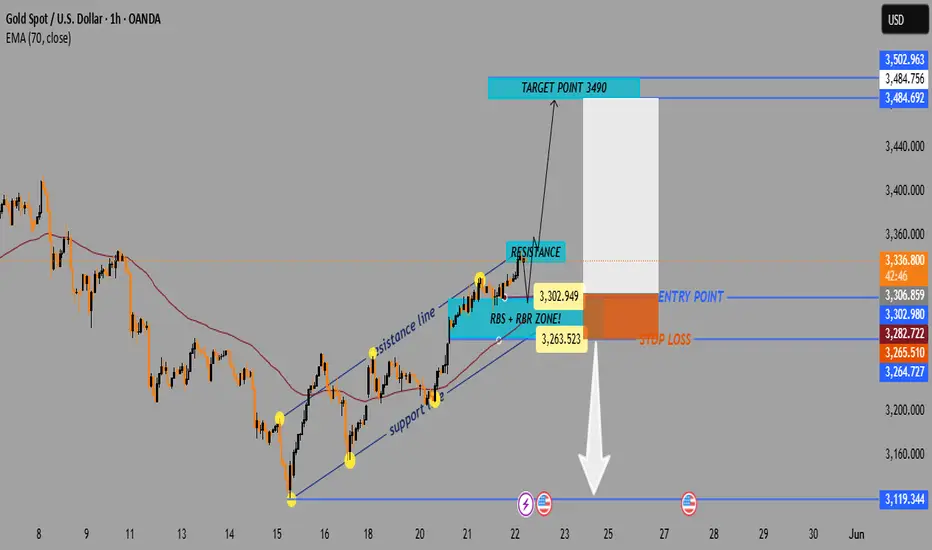
Gold (XAU/USD) Bullish Trade Setup – Breakout in ProgressTrend Overview
📈 Uptrend in Progress
Price is moving within an ascending channel:
🔵 Support Line (bottom of channel)
🔺 Resistance Line (top of channel)
Key Levels
Current Price:
● 3,337.53 (📍)
Trade Idea (Long Setup):
🔵 Entry Zone
● 3,306.85 – 3,302.98
(Wait for pullback into this area)
🟦 RBS + RBR ZONE – Previous resistance, now potential support
🔴 Stop Loss
● 3,265.51
💣 Protect your capital below support zone
🎯 Target
● 3,490
🚀 Bullish target based on breakout from channel and momentum
📉 EMA 70:
● 3,282.74 (📉 Red Line)
Helps confirm trend direction. Price above EMA = Bullish bias.
Outlook Summary
✅ Wait for a dip to entry zone
✅ Stop below recent support zone
✅ Target high at 3,490 if breakout continues
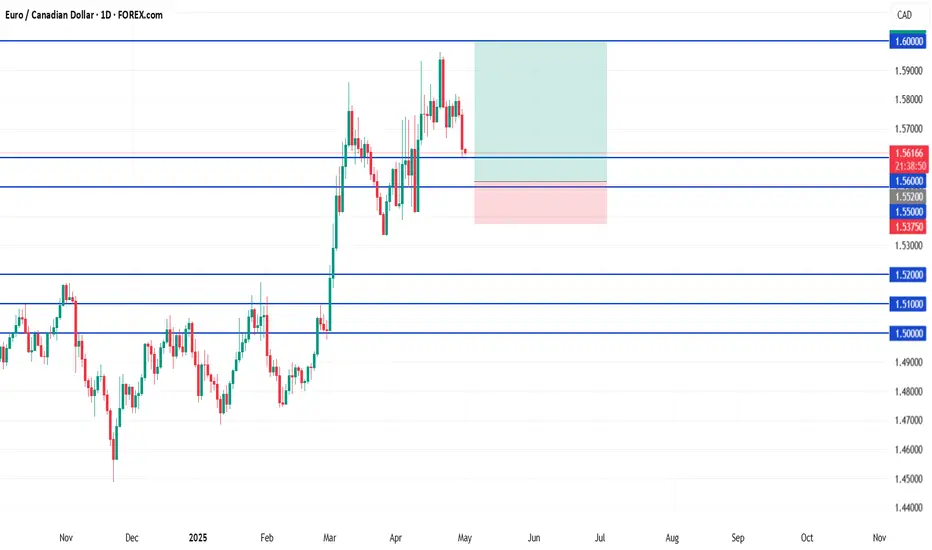
EUR/CAD LongMacro fundamentals favor EUR strength: Strong Q1 GDP, sticky inflation, and no urgency for ECB rate cuts.
CAD is weakening: Oil prices are down ~15% for the month, BoC is leaning dovish, and trade risks remain elevated.
Technical structure is bullish: EUR/CAD broke above multi-year resistance at 1.5500. Price is now pulling back into that zone, which is likely to act as support (classic break-and-retest setup).
Monthly and weekly candles both support a bullish continuation, and this entry gives you a clean structure with tight risk and high reward potential.
EUR/CAD Swing Long Trade Setup
Entry: 1.5520 (buy limit)
Stop Loss: 1.5375 (below weekly structure and invalidation point)
Take Profit 1: 1.5800
Take Profit 2: 1.6000
Gold 1-Hour Breakout Play • 3 210 3 340 • R : R 1 : 4🔍 Quick Chart Take
* 📉 Overall trend: down (still under the 200-MA)
* 🔺 Pattern forming: ascending triangle / wedge ➡️ potential breakout
📦 Zones
* 🟢 Demand / Entry: 3 181 – 3 210
* 🚧 Resistance cap: 3 235 – 3 250
* 🎯 Target: 3 340
⚔️ Trade idea
* ✨ Long at 3 210
* 🛑 Stop-loss 3 181
* 🏆 Take-profit 3 340
* 📏 R : R ≈ 1 : 4
👀 Watch for
* ✅ 1-h close above 3 250 ➡️ breakout confirmed
* ❌ Break of rising trendline or dip under 3 181 ➡️ idea dead
* 🗓️ Upcoming USD news (flag icon) & Dollar Index moves
🔑 Bottom line: Bullish pop inside a bigger bear trend—momentum play, keep the stop tight!

DXY Bearish Setup: Sell from Supply Zone to 99.100 TargetTrend: 📉 Bearish Bias
Key Zones & Strategy:
🔶 Supply Zone (Sell Area)
📍 100.584 – 100.906
⚠️ Price may face selling pressure here
🔵 Entry Point:
🎯 100.584 (bottom of supply zone)
🔴 Stop Loss:
❌ 100.906 (just above resistance)
🟢 Target Point:
✅ 99.100
📉 Aligned with lower support line
Technical Indicators:
📏 Descending Channel
🔽 Price moving within parallel downward trend lines
📊 EMA (70) – Orange Line
🔁 Acting as dynamic resistance
Trade Setup Summary:
📌 Sell in the Supply Zone
🛑 Stop Loss: 100.906
🎯 Target: 99.100
⚖️ Good Risk-Reward Ratio
Warnings & Tips:
⚡ Watch for Breakouts:
If price breaks above 100.906 ➡️ 📈 Bearish idea invalid
📰 Check News Events:
FOMC, CPI, or other USD events may cause volatility

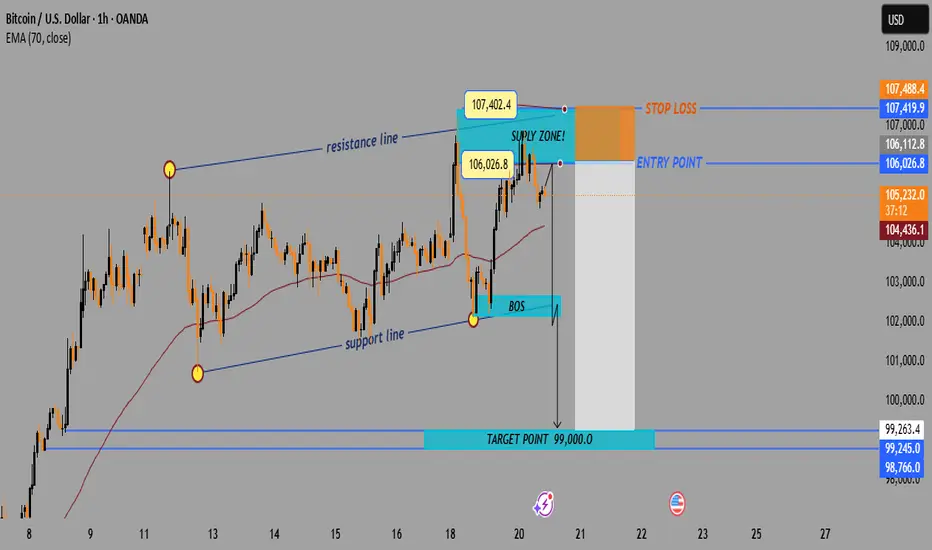
Bitcoin Short Setup –Supply Zone Rejection Trade Plan (1H Chart)(BTC/USD – Technical Setup)
🔵 Trend Setup:
⬆️ Resistance Line – Price is struggling to break above this level.
⬇️ Support Line – Price bounced several times here before breaking down.
🟢 EMA 70 – Currently around 104,435.9, acting as dynamic support/resistance.
📍 Key Levels:
🔴 Stop Loss Zone:
107,488.4 to 107,402.4
(🚨 Strong resistance, limit losses!)
🟡 Entry Point:
106,026.8
(🟨 Inside the Supply Zone – Ideal for Sell)
🟦 Supply Zone:
106,026.8 to 107,402.4
(⚠️ High selling pressure expected here!)
🔵 Break of Structure (BOS):
Price broke below the rising support line
(📉 Bearish confirmation!)
🎯 Target Point:
99,000.0
(💰 Take Profit Target!)
🔻 Trade Idea:
SELL at 106,026.8
🛑 Stop Loss: 107,488.4
✅ Target: 99,000.0
Risk-Reward looks solid.
This is a short setup expecting a drop after a retest of the supply zone.
AUD/CHF Bullish Breakout Setup – Demand Zone to Target 0.546001. Setup Overview
📈 Trade Type: Long (Buy)
📊 Chart Pattern: Trendline Breakout
📏 Indicator Used: EMA (70) — 🔴 0.53726
2. Key Price Levels
🔵 Demand Zone:
* 0.53225 – 0.53504
* Strong buying interest seen here
⬆️ Entry Point:
* Around 0.53517 – 0.53630
* Price is breaking above resistance and trendline
🛑 Stop Loss:
* Below 0.53219
* Protects against false breakout
🎯 Target Point:
* Primary TP: 0.54600
* Extended TP: 0.54697
* Previous supply/resistance zone
3. Structure Breakdown
📉 Trendline:
* Downward sloping trendline has been tested
* Price looks to be breaking out
📌 Resistance Turned Support:
* Break above 0.53500 confirms bullish momentum
📊 EMA (70):
* Current price is slightly below EMA
* Bullish confirmation if price closes above it
4. Risk-to-Reward
⚖️ R:R Ratio: Approximately 1:3
* Small stop loss for a much larger upside

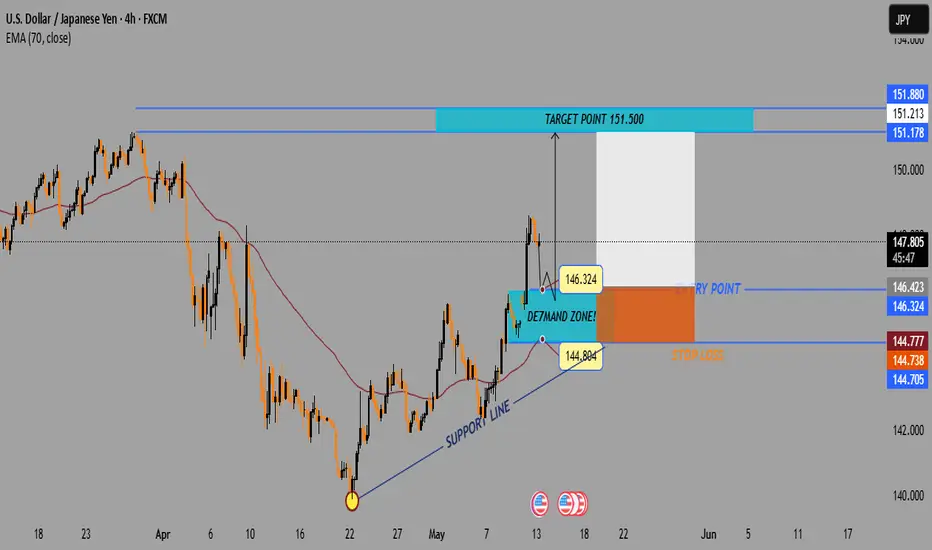
USD/JPY Bullish Setup – Demand Zone Buy Opportunity Toward 151.5🔍 Chart Overview (4H Timeframe):
Currency Pair: USD/JPY
Trend: 📈 Uptrend
EMA 70: 🔴 (144.776) – Price is trading above it = Bullish Bias
---
🟦 Demand Zone
📌 Zone: 144.804 – 146.324
💡 What it means: Strong buying interest expected here
🟢 Support line + EMA = Confluence zone!
---
✅ Entry Point:
📍 Between: 146.324 – 146.423
🎯 Best area for long (buy) position
📊 Wait for a pullback to this area before entering
---
❌ Stop Loss:
📉 Below demand zone
🔻 Range: 144.705 – 144.776
🛡️ Helps protect against unexpected drop
---
🎯 Target Point:
📈 151.500
🟩 Big reward area
🔥 Previous resistance zone = Ideal profit-taking point
---
🧭 Summary:
✅ Entry: 146.324
❌ Stop: 144.776
🎯 Target: 151.500
Risk-to-Reward: Excellent!
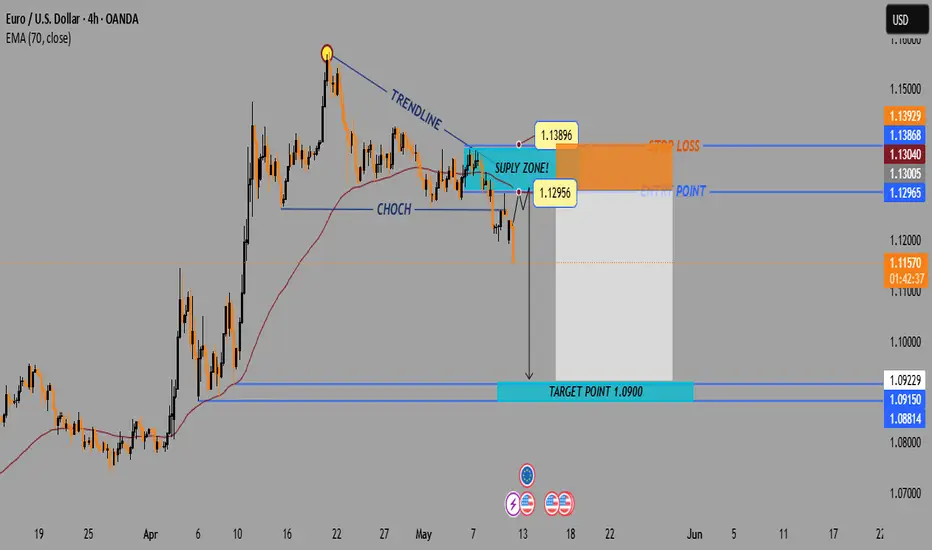
EUR/USD Bearish Setup: Supply Zone Rejection Toward1.0900 Target(Swing Trade Setup)
📉 Trendline + CHoCH Confirmation
🔻 Downtrend marked by a falling blue trendline.
🔄 CHoCH (Change of Character) shows a bearish market structure shift, confirmed by a lower low.
🟦 Supply Zone (Sell Zone)
💥 Strong seller reaction previously occurred between:
1.12956 – 1.13896
🔹 Wait for price to retrace into this zone.
🎯 Ideal for short entries.
🎯 Entry & Stop-Loss
🔵 Entry Point: Around 1.12956 – 1.13005
(below supply zone and EMA)
🛑 Stop Loss: 1.13896 – 1.13929
(above the last high + supply zone)
🟦 EMA 70 (Purple Line)
📈 Currently at 1.13051
Acts as dynamic resistance — strengthening the short setup.
🏁 Target Zone
🎯 Main Target: 1.09000
Marked as TARGET POINT 1.0900
🟦 Support Levels Inside Target Zone:
1.09229
1.09150
1.08814
✅ Summary of Trade Idea
📍 Short Position
⬆️ Entry: ~1.13000
🛑 Stop Loss: ~1.13900
⬇️ Take Profit: ~1.09000
⚖️ Risk-to-Reward: ~1:3+ potential
Are You Using Technical Indicators All Wrong?Most indicators aren’t broken. Most traders use them wrong.
Thousands of traders rely on RSI, MACD, and moving averages — and most of them still lose money. Why? Because they use tools the wrong way, in the wrong context, with the wrong mindset.
Let’s break it down:
1. Indicators don’t predict — they react.
RSI hitting 30 doesn’t mean “buy”. It means selling pressure dominated recently.
2. One tool ≠ one strategy.
MACD or CCI alone won’t build you a system. Context, confluence, and confirmation matter.
3. Emotional confirmation kills discipline.
Seeing RSI 70 after price moves doesn’t mean you’re late. It means your emotions want to join the move — not your logic.
🚨 Solution?
Use indicators as filters, not triggers.
Build rules. Track what works. Trade the system — not your excitement.
Want to see more posts like this? Let us know — We're preparing a series of deep-dives into indicator psychology and structure.
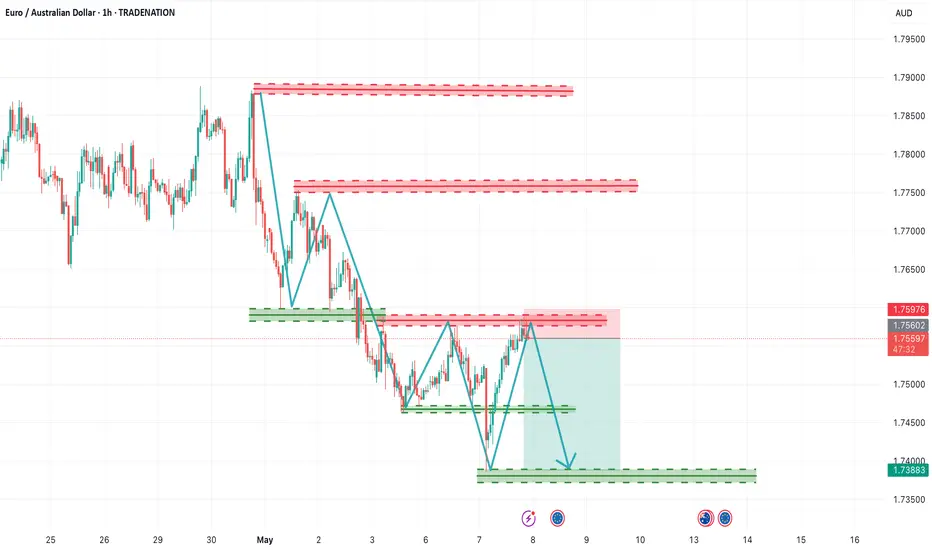
EUR/AUD Forms Bearish Lower High for Next Leg Down!Timeframe: 1-Hour (H1)
Ideal for swing or position-based intraday trades.
Entry Area (Supply Zone):
Price is reacting from 1.75850 – 1.75970 — strong resistance from prior structure.
Bearish Pattern:
Clear lower highs and supply test failure with rejection — confirms sellers' control.
Stop Loss:
Placed just above the resistance zone near 1.75976.
Target Zone (Demand):
Final green demand zone around 1.73880 – 1.74000 — key support and recent low.
Bearish Wave Projection:
Marked by consistent lower lows and tight bearish continuation structure.
Risk-to-Reward:
Very healthy setup with approx. 1:3+ RRR (ideal for professional entries).
==================================================================
Disclosure: I am part of Trade Nation's Influencer program and receive a monthly fee for using their TradingView charts in my analysis.