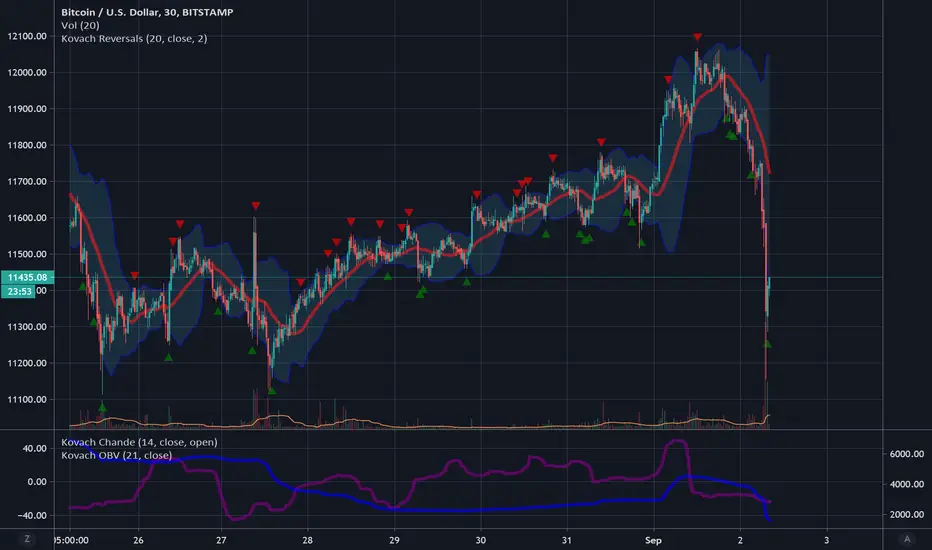
Bitcoin LongBitcoin may be ready for a long position. It took quite a hit, but is finding support. Both Kovach Indicators are solidly bearish, registering the smack down but the Chande, being an oscillator, is starting to curve up suggesting some support and perhaps a retracement. There is a green triangle on the Kovach Reversals Indicator which supports this.
Technicals
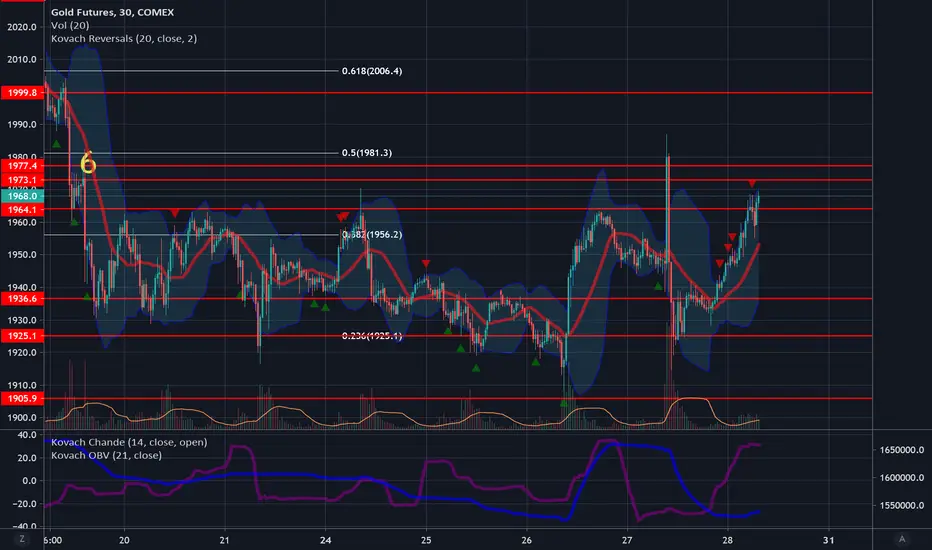
Top Ways to Trade the Volatility in GoldGold has been holding our range between 1905 and 1977 for a while now. The large price fluctuations have tested the extremes of this range, but have not broken them. You could have made serious $$$ clipping these levels. Currently, gold has caught some steam and is currently testing 1964. Be wary of this!! The Kovach OBV is not registering much momentum at all from this recent move! It is relatively flat, though looks to be tapering up ever so slightly. The Kovach Chande has risen, but looks to be finding an extremum and may recede soon, since it is an oscillator. What this means is that this rally in gold may be short lived. There are some significant technical levels above at 1964, 1973, and 1977. It is highly likely gold will face resistance at one of these. We are still bullish long term of gold, but this short term price action may give us some nice entry points for longer term holds, as well as short term scalps.
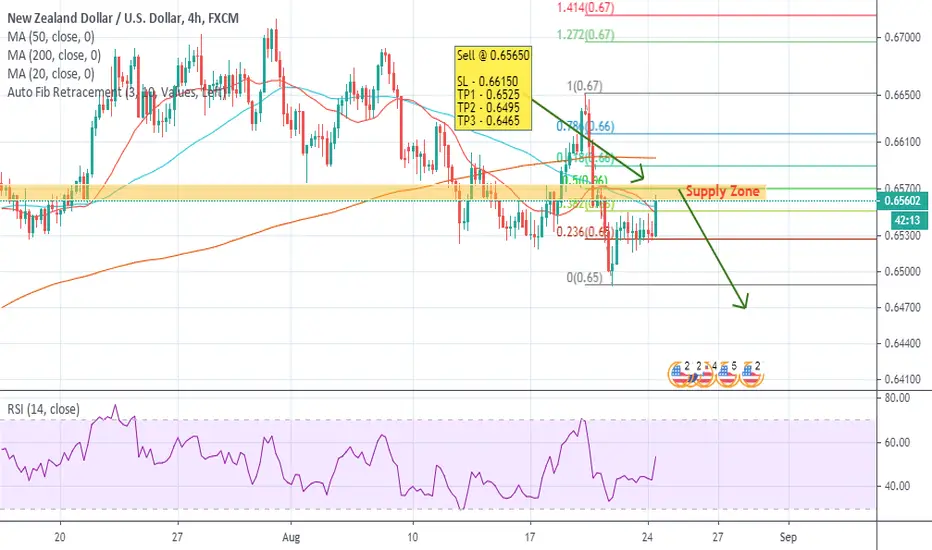
NZDUSD - Short TradeHey Traders!
I would like to share a NZDUSD possible short trade here.
As we can see price is approaching at supply zone and we will be looking for a sign of weakness in this zone. If a sign of weakness appears we will execute a short trade here. The best entry point for this trade will be 50% fibo level but a price rejection is must before we take a final decision and it can happen below 50% fibo as well.
Just look for a sign of weakness on H1 chart and enjoy your trade.
SL - 40 pips above your entry price if your entry price is different from what i have mentioned on the chart.
Have fun!
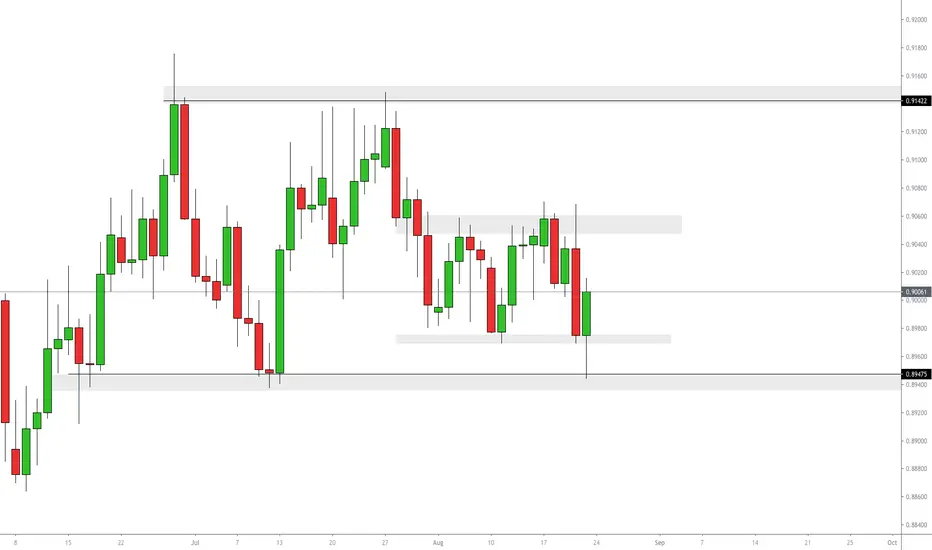
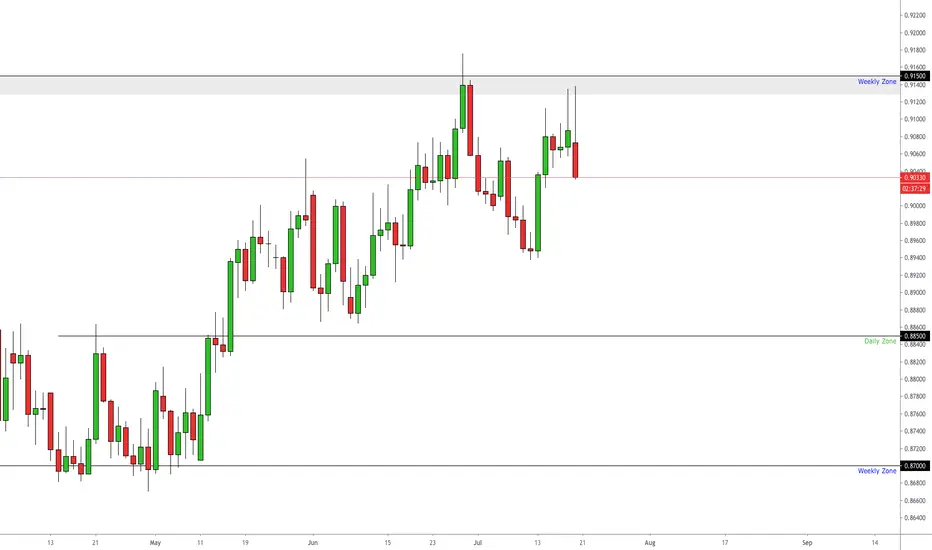
EURGBP: Anticipate .91500!Daily Time Frame: Reading price we can see that we broke the range (between .88750-.90500) and has tapped previous daily swings at .88500 key psychological support and immediately rejected back above .88750 quarterly psych.
If price manages to pullback and test .88750 support look for longs to .90500 and .91500. However, if price does not break .90500 look to reevaluate price action. Due to the uncertainty of market fluidity risk management is highly recommended.
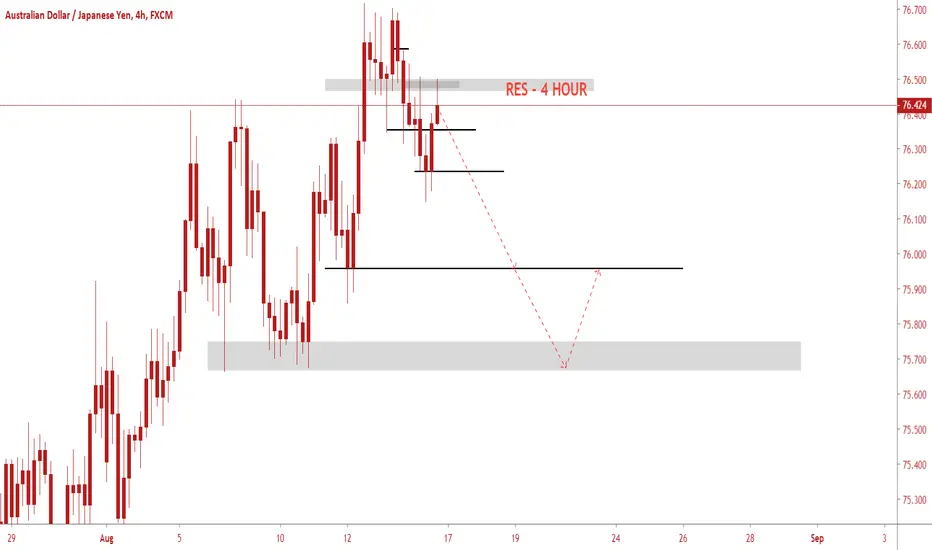
BIG SELL OPPORTUNITY ON AUD/JPY! DO NOT MISS OUT! Our very own AUD/JPY seems to be on a massive Daily Resistance which makes price lose momentum every time it gets near it.
FX:AUDJPY
The most important thing to look for is the 4H chart to make a lower low to confirm our downtrend, finding entries on the lower TF's, like the 30M which is forming a nice market range.
Be on the lookout for it!
Trading Plan Corporation!
AUDJPY D1 - Short SetupAUDJPY D1 - Video Analysis coming through on this one in a second, but could be something we look to swing next week.

Gold H4 - Short SetupGold H4 - Mixed signals from gold at the moment, currently consolidating after a nice selloff on our H4 support region (H&S we marked y'day). We have had a couple of attempts to push higher, but seems we have formed a consolidation range (effectively our flag). Waiting to see if we crack below this 1928 region to set new lows and break support, from here on the retest of 1928 we could look to jump in short.

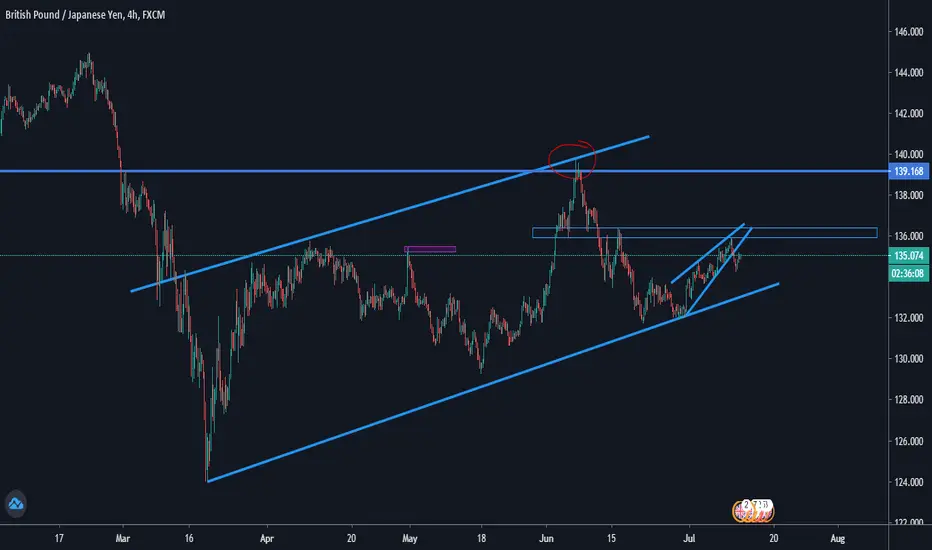
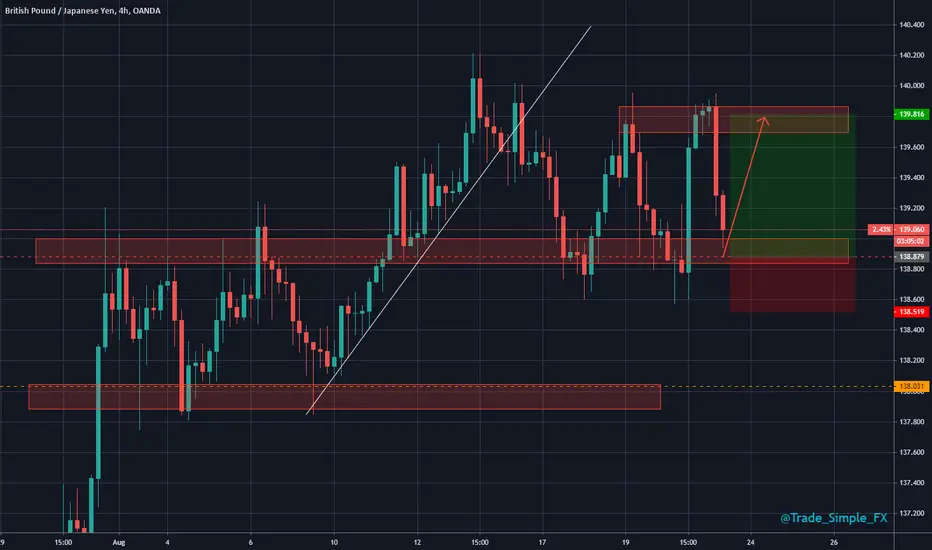
GBPJPY H4 - Long Trade SetupGBPJPY H4 - UK PMI data was positive, along with retail sales data before the session had even kicked off. Looking to see if we find support around 138.850, we could then look to trade back up to resistance.
GBPNZD REGULAR DIVERGENCE SPOTTEDThe RSI Divergence has been spotted on the hourly time frame signalling a switch of trend. Shorting from now on would be a good idea.
Best Way to Trade the Gold SelloffGold has cratered along with the other safe havens. It has careened through the 1900 handle back down to 1800's, currently finding support at 1863, which is a strong technical and Fibonacci level. It appears to have completed the 5-3 Elliott Wave. Observe that even with this correction, gold can still be considered in a 'bull phase'. Especially considering the bounce it had off 1863. Current levels may make a good entry point for a long trade. We are right at 1941 at the moment, which is another technical and fibonacci level. A narrow stop would be good risk management. The next level above is 1975, but below we have a vacuum zone to 1906. The Kovach OBV has taken a nosedive, registering the selling momentum. It does appear to be turning, along with the Kovach Chande, suggesting that this bear phase may be ending, or at least coming up for air.

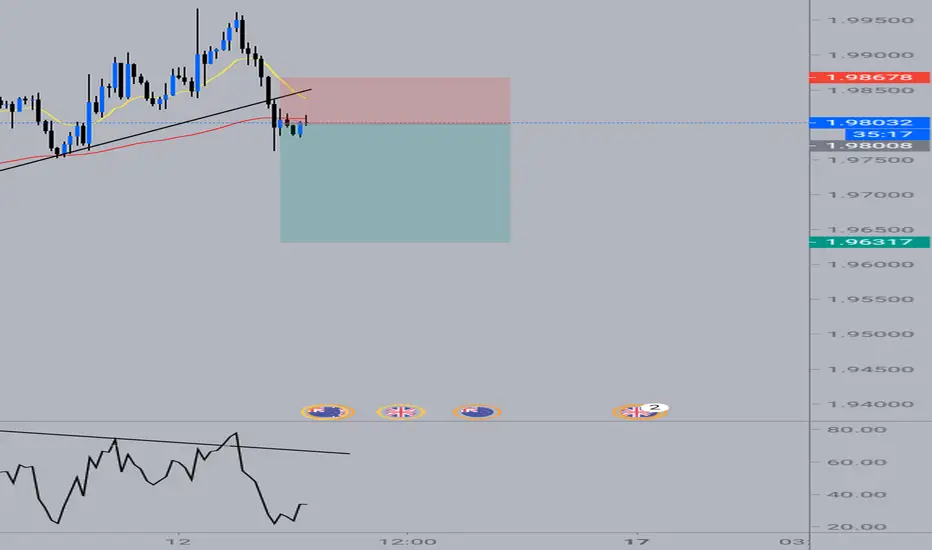
EURNZD LONG (POSITION TRADE) 2K+ PIPSDear Traders
The trade idea is position trade of holding it long term followed by confluences to support my set up with Risk Management of 1-2% risk.
1. 16th March 2020 is where Weekly Candlestick hitting all time high for Euro/NZD at 1.99271
2. Price immediately was reversed by a downtrend of price retracing back towards monthly support: 1.7100, however the end meets and price reversed with a morning star pattern at 1.7200
3. Price remain bullish after breakout, i am waiting for a retest/pullback to be found near daily level: 1.7625 for price to continue impulsive phase.
4. NZD was one of the first economy to recover the pandemic levels along with other asian currencies, however Euro/Usd, Eur/Jpy has recovered well the pandemic levels.
5. EURNZD is a slow pair but the idea is worth the risk and with the confluences, i am taking this trade with 1:14% risk to reward ratio set up
However i am waiting for final confluences before this trade lift off, currently BUY LIMIT ORDER is set.
Risk: 164 pips
Reward: 2310 pips

$EURGBP #EURGBP - Intraday Buys above .9100Healthy profits
Been tracking this
structure and liquidity points to the upside
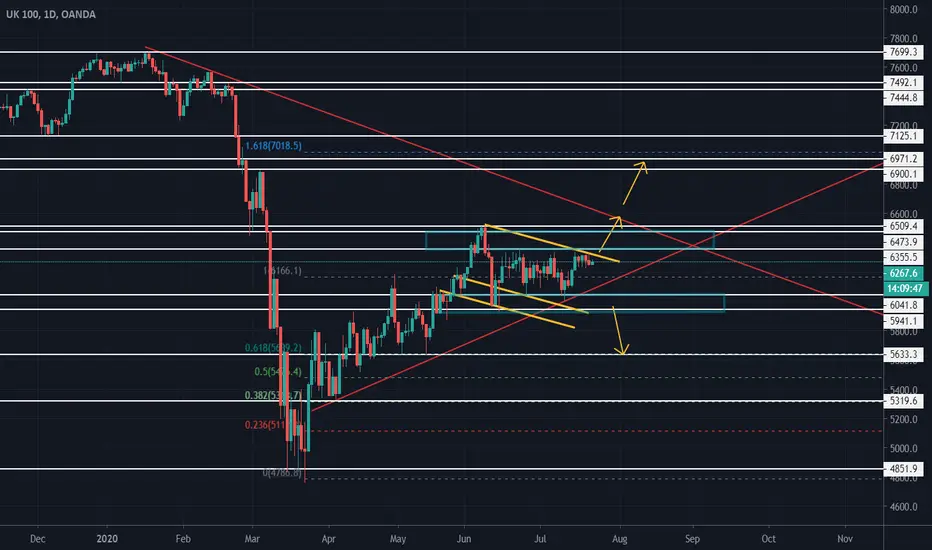
FTSE100 Could be on move soon...!FTSE100 UK.
It could be on move soon! How? Well past that key trend-line down in red, bullish flag formation as well if goes above out of the range it has been stuck in - the bulls are in control target within the next resistance key areas. However, if bears get in control, below the key trend-line out of range down next target near retracement fib levels which match support and resistance areas. Clean trade idea, put alerts or orders in to make it easier.
Remember: Just a trade idea, not a recommendation.
AUDUSD Continues To Test The Q1 HighAUDUSD is continuing to test the Q1 high and is currently trading a few pips higher than the significant 0.70 level. Technically price appears to be forming a bull pendant flag, as buying continually grinds the pair higher. Price hasn't been able to close above the Q1 level of 0.70162 however higher lows continue to be formed on the pair. Traders could look to hedge positions on the pair or wait for a break of the flag pattern to open positions.

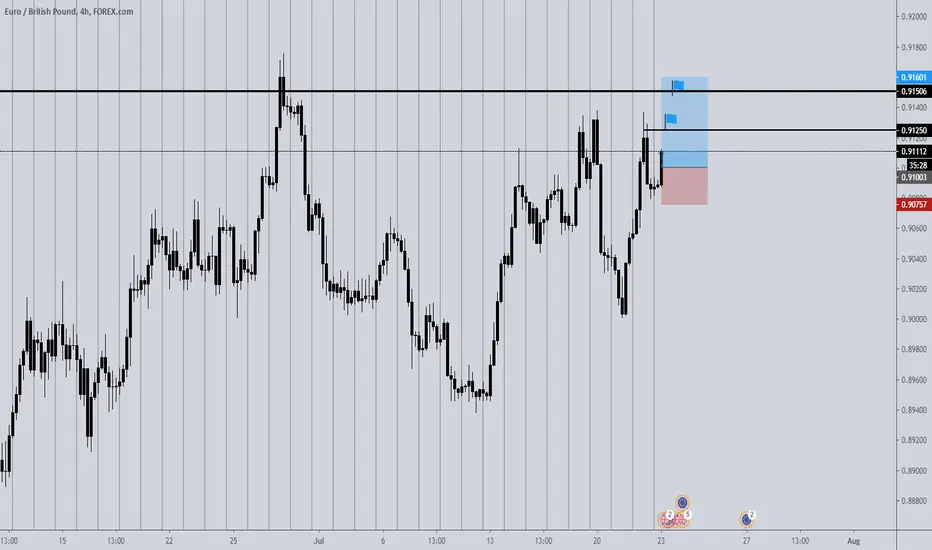
EURGBP: Rejecting .91500!Daily Time Frame: Starting on the higher time frames we can see price is creating a double top formation at .91500 key weekly zone with signs of wick rejection.
4hr Time Frame: Scaling down we can see that price is testing 4hr support. If price manages to hold below .91500 look for shorts down to .88500. However, if price manages to break and close above, we can potentially see longs to .93000 key resistance. Due to the uncertainty of market fluidity, risk management is highly recommended.
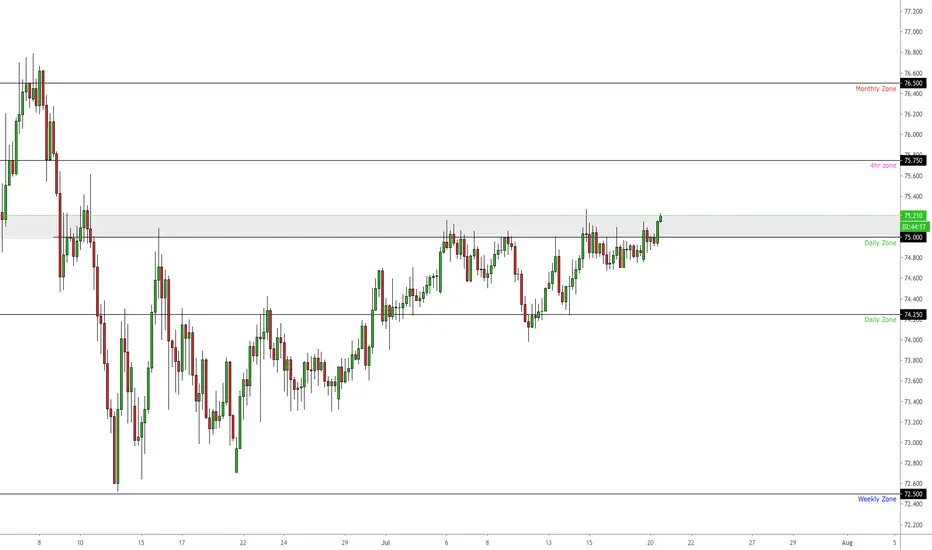
AUDJPY: Testing 75.000!Daily Time Frame: Starting on the higher time frames we can see signs of rejection at this area of daily resistance right around 75.000 key psychological zone.
4hr Time Frame: Scaling down we can see price creating multiple tops. If price manages to hold below this daily resistance, then look to sell this down to 74.250 and potentially 72.500. However, if price breaks above this zone look for a break and retest with signs of rejection in order to buy this up to 76.500. Due to the uncertainty of market fluidity, risk management is highly recommended.
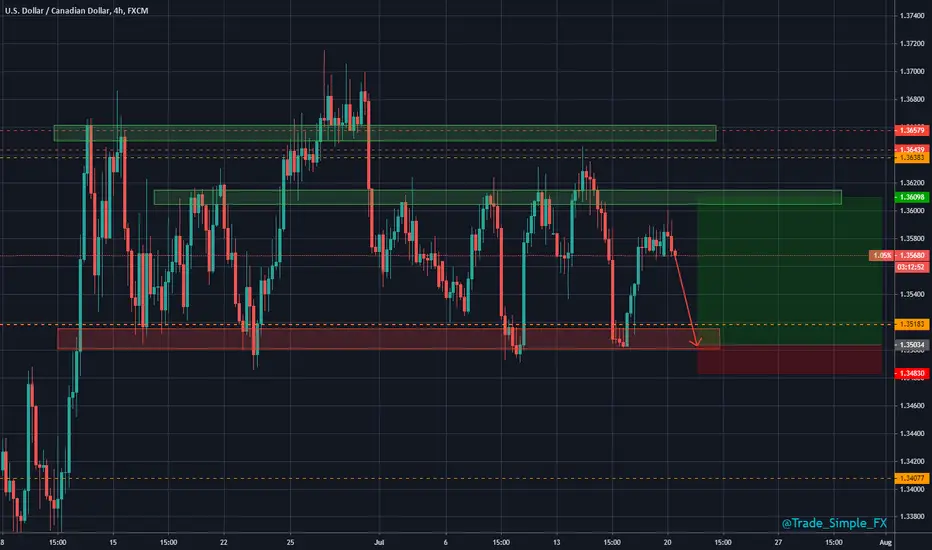
USDCAD H4 - Long Trade SetupUSDCAD H4 - Starting to scallop over here on UC, DXY dipping below 96.00, but still technically within support region a solid break of 95.70 and close would lead us further downside comfortably. Looking to buy from 1.35 back up to 1.36 again and trade that 100 pip range.
BORR LONGLook for 1.3 area for selling pressure. A lot of institutions might be cashing in their positions at this level. My resistance line should be hit-thus, closing the gap.
Fundamentals are up in the air but price correction is needed. Trend is broken and support has been established.

NZDCAD H4 - Short SetupNZDCAD H4 - Trendline break and retest seen here. Last couple of H4 candles have closed nicely bearish, trying to trade below 0.89, if we can sustain below, shorts would be probable. Interested to see where this next hourly candle takes us.

CADCHF H4 - Short Trade SetupCADCHF H4 - We monitored this yesterday and were looking for the retest, the rejection on the H4 candle started off nicely, but with just a couple of minutes left it's wicked up a fair bit, not to confirmation we are after, but lets just sit and wait for a little more clear rejection, possibly dig into the lower timeframe.

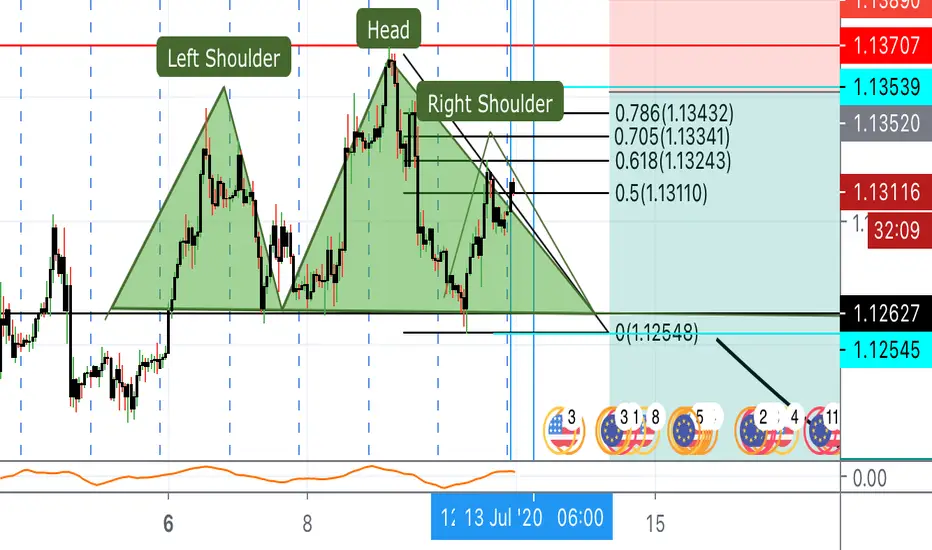
EURUSD SHORT TERM SELLS Head and shoulder pattern forming potentially confirming shorts for the coming week imo
GBPJPYOANDA:GBPJPY NEW WEEK,NEW OPPORTUNITIES TO SET NEW GOALS, GBPJPY LOOKING FORWARD TO THE BEARISH MOVEMENT AFTER THE RE-TEST TO THE RESISTANCE, LETS CONTINUE LEARNING OUR CRAFT TO REMOVE THAT 'L' AND START EARNING