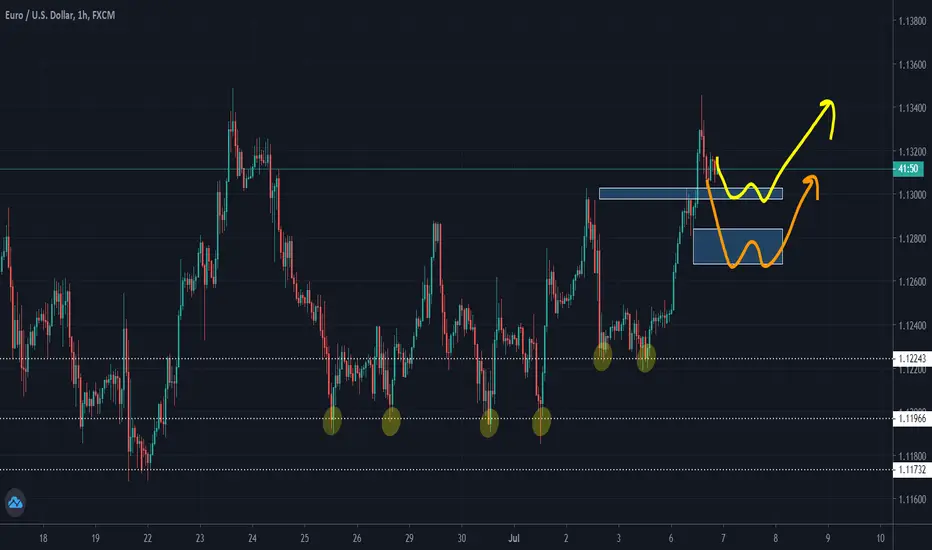
EURUSD FUNDAMENTAL AND TECHNICAL IDEAGood Day Everyone
Here's an idea on the EURUSD pair, as we've seen the EURO making major recoveries in the last cople of week the pair is in a uptrend which most signals point to it continuing as we go in on the pair..
The EURO has been strong against most major counterparts in the previous weeks in which global sentiments and the counter currency flow where the main drivers.
.
.
> With the European Central Bank (ECB) we saw some short-term buying for the EURO on Thursday.
> As i had mentioned the EURO has had some strong gains as we saw it hit 3 months high on Friday against the dollar after the European Central Bank (ECB) expanded its stimulus programme
> INVEST.COM - Head Of Mizuho Bank Peter Chatwell " The EURO will keep rallying and more towards $1.20 ,adding that ECB ha " dramatically" supported the EURO by reducing tail risk
.
.
- The dollar was modestly higher on Friday after data showed the U.S. labor market unexpectedly improved in May, but the currency ended the week lower, for a third consecutive week, as uncertainty about the U.S. economy capped gains.
INVEST.COM - The Labor Department's employment report showed the jobless rate fell to 13.3% last month from 14.7% in April, which was a post-World War Two high. It came on the heel of surveys showing consumer confidence, manufacturing and services industries stabilizing. Economic conditions have significantly improved as businesses have begun to reopen after shuttering in mid-March to slow the spread of COVID-19. U.S. dollar index =USD late Friday was up 0.18% to 96.93. It was down 1.4% from last Friday's close. On the day, the dollar was 0.38% stronger against the euro EUR= , at $1.129. Against the safe-haven Japanese yen JPY= , the dollar was up 0.44% to 109.61 yen.
"Today you've seen better-than-expected economic data coming out of the U.S. in terms of the jobs numbers," said Chuck Tomes, portfolio manager at Manulife Asset Management. "The reaction on the back of that has been expectations of better growth coming out of the U.S. as well as a steepening yield curve, both of which have provided a lift to the dollar."
The uncertainties about the economic outlook and the possibilities of a second wave of infections had capped the greenback's gains, Tomes added.
Some analysts said the May job gains in might not soon be repeated.
za.investing.com
.
.
.
We are curretly just above level 1.12754 wich was our resistance level now support the pair pushed through this level came down for a retest possibly signalling continuation to the upside so looking for long entries in the pair...
Target 1 - 1.13902
Target 2 - 1.14984
SL & ENTRY - FOLLOW YOUR RULES
RISK-MANAGEMENT
PERIOD - SWING
Technicals

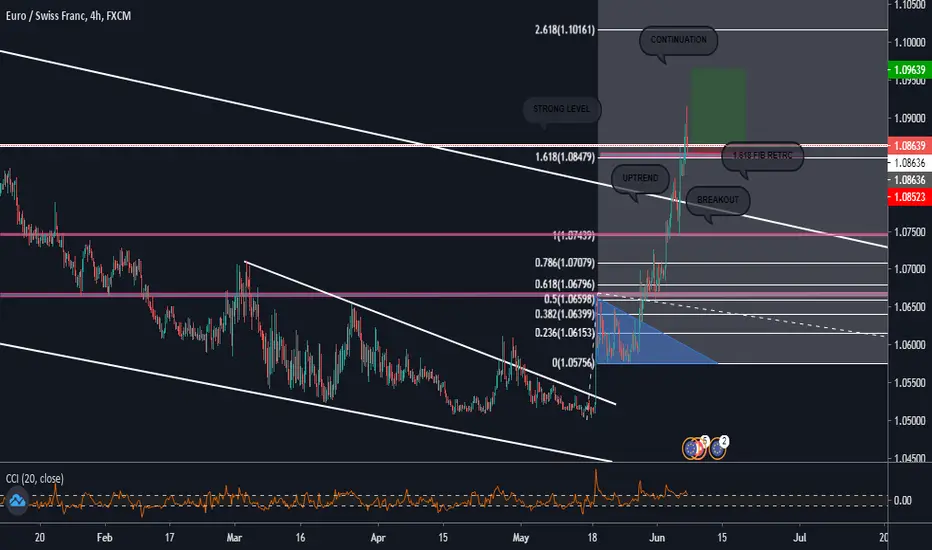
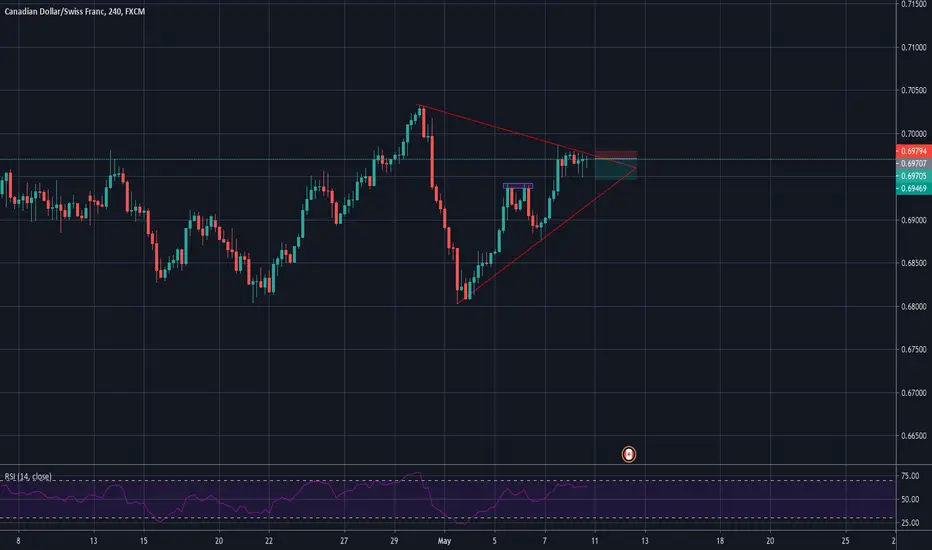
EURCHF FUNDAMENTAL AND TECHNICAL IDEAGood day everyone
Here's an idea on the EURCHF pair, The EURO has been strong against most major counterparts in the previous weeks in which global sentiments and the counter currency flow where the main drivers.
.
.
> With the European Central Bank (ECB) we saw some short-term buying for the EURO on Thursday.
> As i had mentioned the EURO has had some strong gains as we saw it hit 3 months high on Friday against the dollar after the European Central Bank (ECB) expanded its stimulus programme
> INVEST.COM - Head Of Mizuho Bank Peter Chatwell " The EURO will keep rallying and more towards $1.20 ,adding that ECB ha " dramatically" supported the EURO by reducing tail risk
.
.
.
EURCHF support for the EURO was bolsted on wed when Germany launched a 130 Billion EURO stimulus packaged after last months supporting a European union recovery fund that would bring the bloc closer to a fiscal union , EURCHF hit 5 months high while the European single currency rose to 13 month high against the EURJPY..
.
.
.
We broke resistance level 1.08636 just above 1.618 fib ext level pushed down for a retest of this level now support in the pair possibly signalling continuation to the upside so i will be looking for long entries in the pair...
target 1 - 1.09175
target 2 - 1.09664
sl & entry - follow your rules
RISK-MANAGEMENT
period - swing
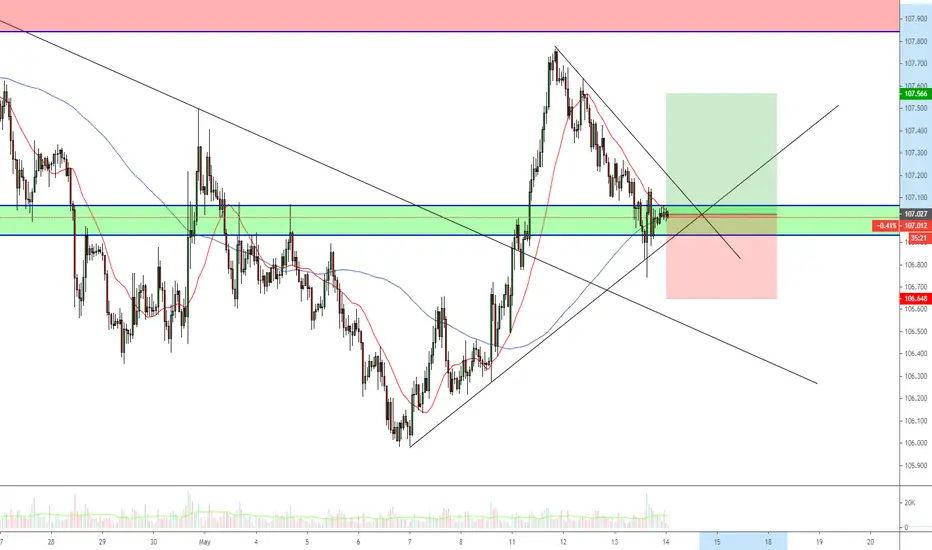
EURUSD long biasThis pair's value has been going to the upside for some time and I'm expecting to see even higher values in the upcoming days. I'm getting involved only when I see a clear confirmation from price. However price could decline and we could end up below the rectangle zones.
GBPCAD H4 - Long Trade SetupGBPCAD H4 - Rejected the breakthrough and retest yesterday, CAD data pulling ***CAD pairs downside after a bit of a delayed response. However, looking to find support again on that 1.68 handle for possibly buys early next week.

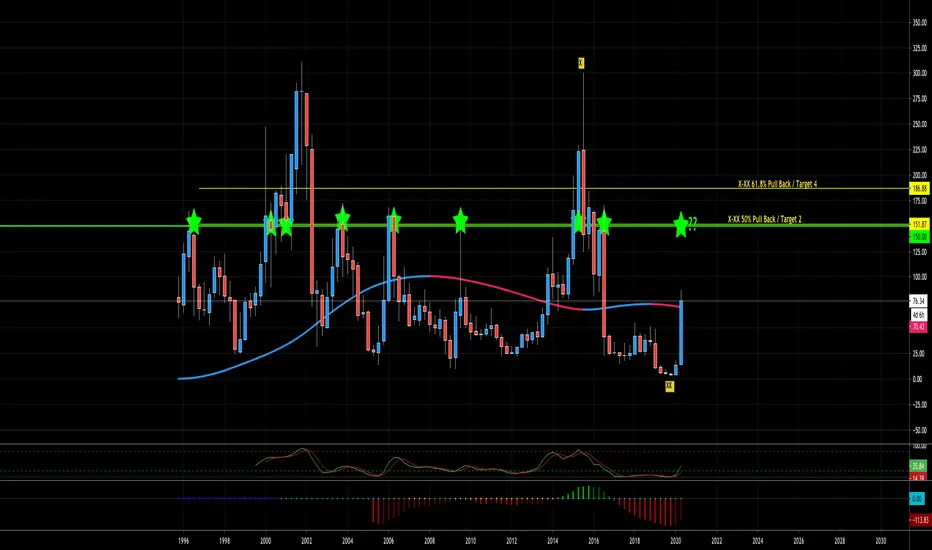
NVAX Long - $150 Target?I've been following NVAX since price was at $12. Fundamentally they have one of the most promising COVID vaccines and their Nano Flu shot beat Sanify's flu shot, whos been a market majority holder in that aspect.
Technically, we've tapped that $150+ zone 8 out of the last 9 fast rises over since the company IPO'd in 1996. Each of the rises have been driven by pandemic viruses..ie, swine flu, bird flu, H1N1, etc.
We have 4 days until the quarterly candle closes. If we close strong, we'd of closed above the coral, and momentum and RSI are correlating. I think we will see a short term sell off at the psychological $100 level. How much? I could see $80-$85 be a good rebuy zone to push price up to t $125 then $150. Buyers at $80, will probably be looking for a double on their investment which would put price at $160.
Let me know what you think!
Best Bond Trading Strategies for TodayAfter an extended 5th wave in the impulse, ZN has broken down (as anticipated from this pattern). After ranging yesterday, it is up to the vagaries of risk sentiment to decide where it will go next: if it will rally or breakdown further. It seems likely we will see strong resistance around 138'18 and 138'21. The Kovach momentum indicators are gradually shifting to the bearish side.

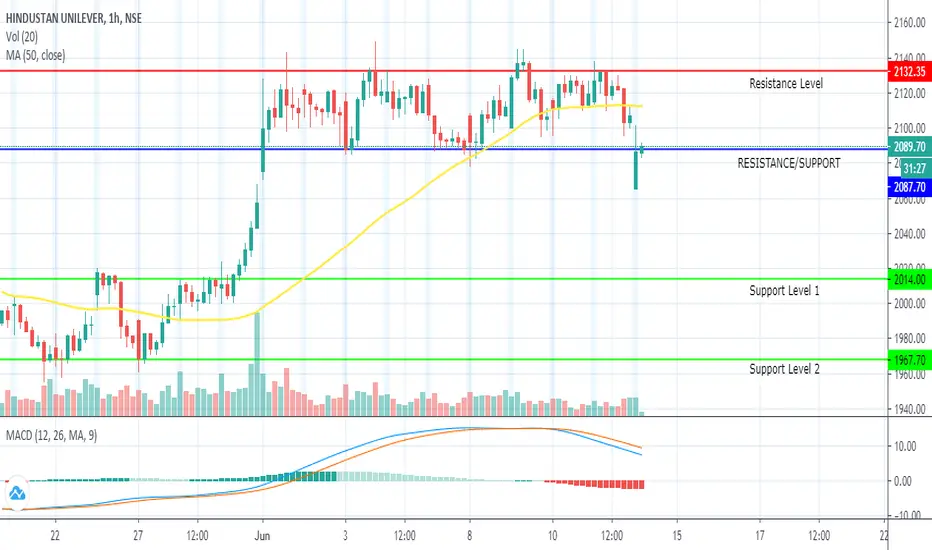
HINDUSTAN UNILEVER LIMITEDHINDUNILVR showcases the onset of the downtrend with the current gap down opening. The stock was in a bullish uptrend followed by a consolidated between a span of two weeks in the 2090-2130 range.
The current level (2085-2090) can be termed as both resistance and support because the price is trying to break above it. If price closes above this level as of today, the stock might again go into consolidation.
If not, the price can fall to the lower support levels:-
SUPPORT LEVEL 1 (2010-2015)
SUPPORT LEVEL 2 (1960-1970)
If the price falls to these levels, accumulation should be carried out.
THANKS
P
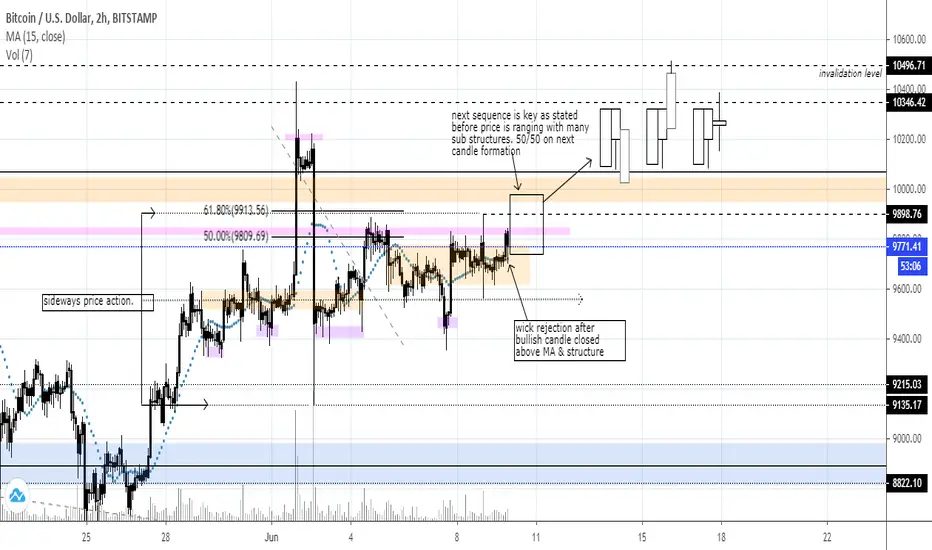
BTCUSD updatein addition to recent BTCUSD post, it is clearly visible that price is still ranging, and with that comes patience.
currently price is rejecting the lower half of its range giving it higher odds of potentially retesting recent highs before next more is definite.
top middle half of larger range.
patience is key.
anticipate - react - execute
cheers.
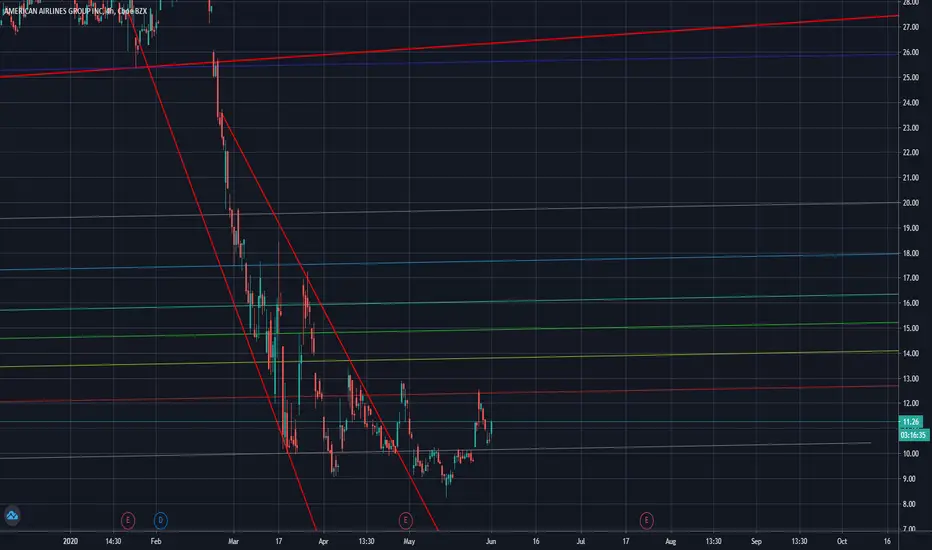
American Airlines Supportprice has respected the levels near the bottom range of the current price. As we are continuing to test the support levels and create a more prominant bias and the market condition begin to strength one can look for a potential in holding AAL towards previous highs. Although the time range for this correction to occur could take weeks over time as the consumer confidence raises.
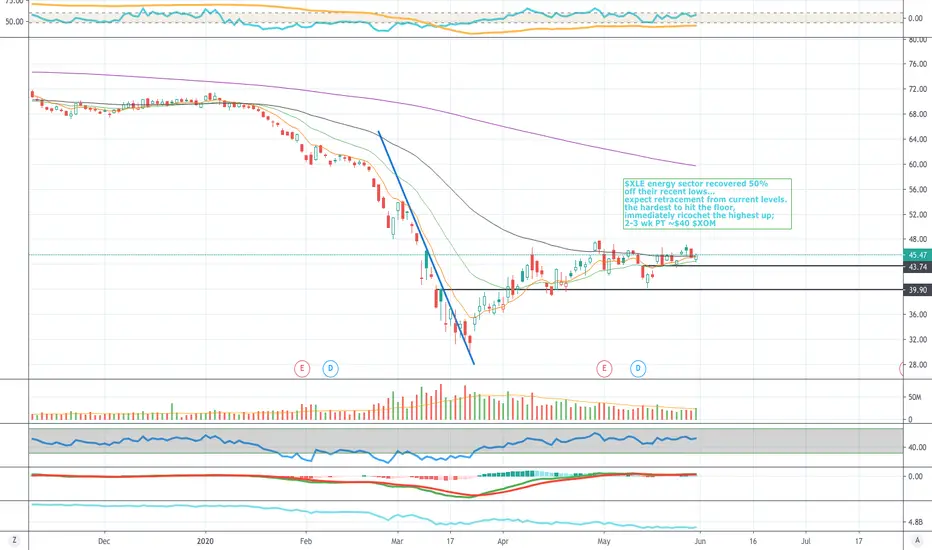
$XOM short term SHORT$XLE energy sector recovered 50%
off their recent lows...
expect retracement from current levels.
the hardest to hit the floor,
immediately ricochet the highest up;
2-3 wk PT ~$40 $XOM
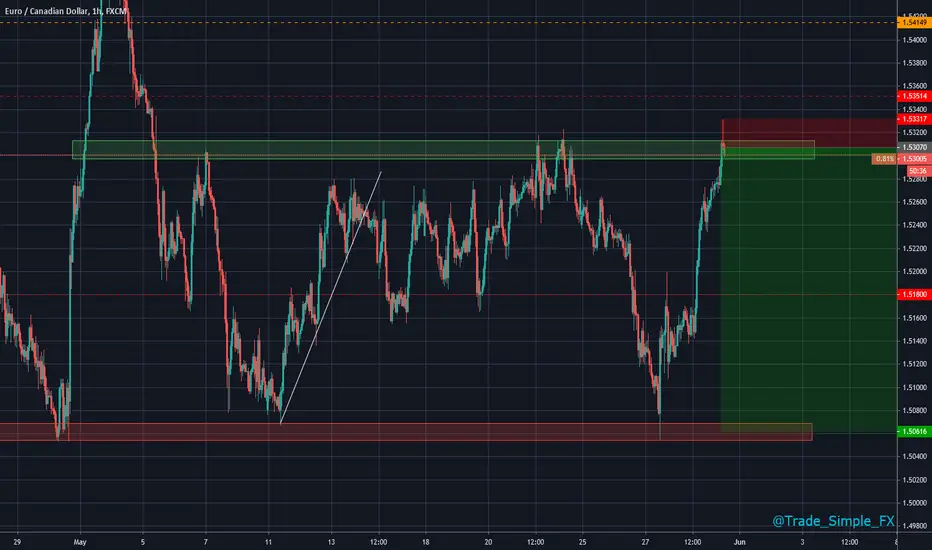
EURCAD H1 - Short SetupEURCAD H1 - I've adjusted resistance zones to show hourly resistance now rather than H4 resistance, sat around that 1.53 handle. EUR has ripped over recent trade, would be nice to see a correction. No confirmation here, I wouldn't suggest taking a trade until we see some... 1:11 with current projections, so can afford to lose some by waiting for some PA confirmation. H4 close is going to be intense, looks like it may break but H1 still technically intact.
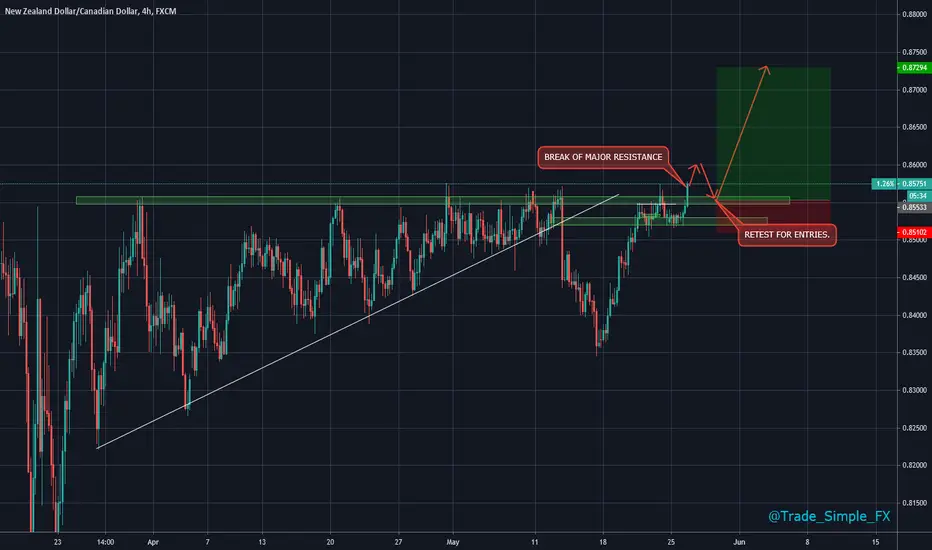
NZDCAD H4 - Long SetupNZDCAD H4 - Like I mentioned on the voicenote, big strength seen from these eastern pairs, AUD and NZD, outperforming as the week kicks off. Looking for a good H4 close, maybe another bullish H4, with a subsequent retest for long entries. at 0.85500.
EURUSDEURUSD one of my personal favourite pairs.
With this we are watching price on the lower timeframes (1D,4h,1h) move sideways so some good buys and sells at Support & Resistance but the overall picture is we are fast approaching a key level that as been respected since 2003 and this is where we could see price go into the Accumulation phase before EURUSD finally coming out of its downwards trend.

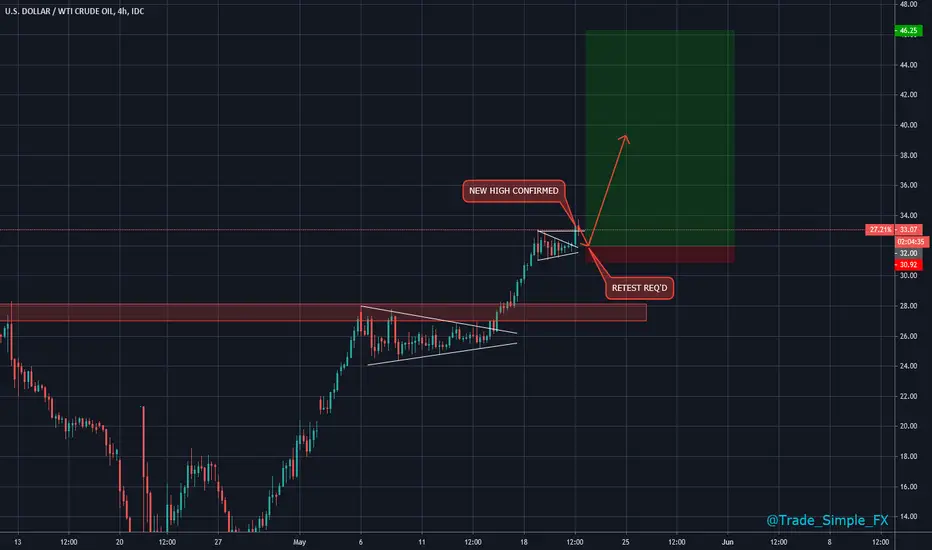
USDWTI H4 - Long Trade SetupUSDWTI H4 - Breakout already seen, looking for a retest to find support and then upside continuations. As lockdowns and government restrictions ease, we should see continued increase in WTI and XTI and aviation and motor industries start picking up again, obviously s/d.
USDCAD H4 - Long setupUSDCAD H4 - Retesting the trendline retest point, but ideally looking for buy entries on the red support zone around 1.38600, to be able to trade long up to 1.41400 ish.

USDJPY bullish continuation After NY session closed we clearly stayed above daily lows going into Asian session and new daily candle. Risk off tone and lower equities didn't help risk on sentiment but dollar bounced back after FED's Powell speech on excluding negative interest rates which is sentiment positive for USD. Pair broke previous high and made higher low at London close.
PATTERNS:
Bullish engulfing pattern and trend change on 1h and lower timeframes by swing pivots (breakout of previous swing high, new swing low not broken yet)
4h swing lows remain the same after previous highs got ceased and back tested positively (50% pullback co-relation).
Idea is to go long from his 50% retracement on solid r/r. ADR is 96 and by setting half ADR as sl I wont risk much of capital. Profits can be taken anywhere above 1/1 r/r. Maximum I would take is full ADR.
Entires can be made above 107.1 resistance, which may be safer entry and might co-relate with 100ema brekout on 15min timeframe and 100/20 ema b/o on 1h and 4h respectively.
AUDUSD ready to break lower?AUDUSD is at a pivotal zone. If we can see candle closure below the 2H zone, look for the retest of the zone before shorting, in the form of a pinbar, Bearish Harami or Engulfing. If we close at the zone and see a Bullish Harami form, get ready for liftoff.
USDCAD LongWe currently have USDCAD breaking a 4H S/R Level and we should see this go another 90 or so up to retest previous resistance. I have charted the 2H Zones it is trading between, feel free to ask me any questions.
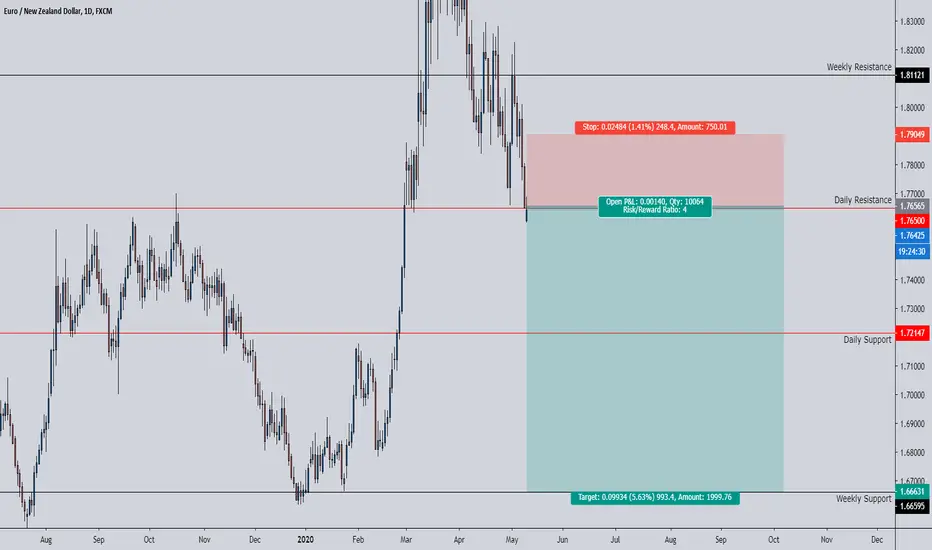
EURNZD Short - 1.6700 TargetEURNZD has broken some consolidation to the downside as both AUD and NZD pick up strength with great coronavirus handling and exports to Asia are picking up now that those parts of the world are re-opening. Even though Europe and the USA are struggling and consumer demand isn't as high, production countries such as Vietnam, Indonesia, China, Japan etc... will manufacture now while interest rates are cheap, labour is cheap, inputs are cheap and they will grow inventories for the future. So the raw materials that AUD and NZD economies send to these countries will be in high demand. I expect us to drop here!
USDCHF - running trade, let see how this plays out.... Very simply strategy, the chart speaks for itself.
For more information on our strategy please view our 'Scripts' page on our Trading view profile.
Our V2 strategy shows the SL and multiple TPs on the chart too.
Works on all instruments
Directly onto your own personal trading view - all devices work
Non repainting
Regards
Darren
Blue FX

CADCHF SHORT CADCHF SHORT POSITION 24 pips TP RRR= 2,74 SL 8,7 pips Let me know what do you think . SIMPLE TRADING= PROFITABLE TRADING
Ahrvo Weekly Sector Rankings: 4/27/2020With another week of earnings in the books, investors are starting to get a better idea of the impact that coronavirus is having on S&P 500 companies. It’s not pretty. For Q1 2020, the S&P 500’s earnings decline accelerated from -14.5% last week to -15.8% (worst since Q3 2009). The fall in earnings can be attributed to cyclical sectors- materials (down 25%), industrials (down 31%), financials (down 42%), consumer discretionary (down 42%), and energy (down 67%) sectors. Defensive sectors- utilities (up 4%), consumer staples (up 4%), health care (up 3%), and technology (up 1%) have faired much better. Of the 122 companies that have reported results, 60% reported both positive earnings and revenue surprises. However, it’s worth mentioning that analyst expectations were down 10% on average in March, so companies beating expectations are jumping over a lower hurdle.
Over the last week, the S&P 500 continued to climb higher, up ~4%. Media outlets have attributed the positive price movement to a possible coronavirus vaccine. The upward movement in price, coupled with decreasing earnings has caused the price-to-earnings ratio (valuation) of the S&P to become expensive relative to historical averages. Making buying stocks expensive at a time when economic uncertainty is at an all-time high. The forward P/E on the S&P 500 is 19.1x, higher than the 5 and 10 year average of 16.7x and 15x, and up from 14x in early March. As an example of the uncertainty facing company executives (and as a result, the investors/traders), only 50 of the 122 companies that have reported results mentioned EPS guidance for Q2 in their earnings presentations. Of the 50 companies, 30 mentioned they were no longer certain of their EPS guidance (forecast) for the year, with all 30 citing coronavirus as the primary reason. Out of the other 20 companies that provided guidance, 10 issued EPS guidance that was lower than previous expectations.
Over the last week, all but one (utilities) sector experienced an increase in price. In typical “risk-on” fashion, all cyclical sectors outperformed. Energy (ticker: XLE) led the way, up 9.6%. While financials (ticker: XLF), materials (ticker: XLB), industrials (ticker: XLI), and consumer discretionary (ticker: XLY) returned 6.7%, 6.5%, 4.9%, and 5.1%, respectively. Technology (ticker: XLK) was the only “defensive” sector to outperform, up 5.2%. Utilities (ticker: XLU), healthcare (ticker: XLV), consumer staples (ticker: XLP) returned -.28%,.77%, and .52% respectively. It’s worth noting that sector performance (rotation) was a complete reversal from last week when defensive sectors outperformed cyclicals and the market.
As the S&P 500 climbs toward the 3,000 price level, investors need to ask themselves whether the house being built is sitting on solid foundation. The market is trading on the positive news when the reality on the ground is much different- 30 million Americans unemployed over the last 6 weeks. The infusion of liquidity by the Federal Reserve and the U.S. government has helped to prop up asset prices. However, ask yourself this question. Why are investors buying into the market at a time when stocks are expensive, economic uncertainty is high, and company executives aren’t even able to articulate what they expect their companies to do over the next 3 to 6 months? It is a recipe for disaster. Although I remain net-long, I don’t plan on adding new capital to stocks until the market pulls back and valuations become reasonable (14x-16x earnings). As the high from stimulus begins to fade, that opportunity will present.
-Appo Agbamu, CFA
Ahrvo Score (Overall Score)
1)Technology (⬆️1 spot)
2)Utilities (⬇️1 spot)
3)Industrials (⬆️1 spot)
4)Consumer Staples (⬇️1 spot)
5)Consumer Discretionary (no change)
6)Financials (no change)
7)Basic Materials (no change)
8)Health Care (no change)
9)Energy (no change)
Momentum Score
1)Healthcare (⬆️1 spot)
2)Technology (⬇️1 spot)
3)Basic Materials (⬆️2 spots)
4)Consumer Staples (no change)
5)Utilities (⬇️4 spots)
6)Industrials (no change)
7)Consumer Discretionary (no change)
8)Financials (no change)
9)Energy (no change)
Growth Score
1)Financials (no change)
2)Industrials (no change)
3)Technology (no change)
4)Consumer Discretionary (no change)
5)Consumer Staples (no change)
6)Utilities (no change)
7)Health Care (no change)
8)Basic Materials (no change)
9)Energy (no change)
Quality Score
1)Consumer Discretionary (no change)
2)Industrials (⬆️1 spot)
3)Consumer Staples (⬇️1 spot)
4)Technology (no change)
5)Utilities (no change)
6)Energy (⬆️1 spot)
7)Financials (⬇️1 spot)
8)Basic Materials (no change)
9)Health Care (no change)
Value Score
1)Industrials (no change)
2)Consumer Discretionary (no change)
3)Financials (no change)
4)Utilities (no change)
5)Energy (no change)
6)Consumer Staples (no change)
7)Basic Materials (no change)
8)Technology (no change)
9)Health Care (no change)
This material is for informational purposes only. Under no circumstances should any information or materials presented be used or construed as an offer to sell, or a solicitation of an offer to buy, any securities, financial instruments, investments, or other services. Any investment made is at your sole discretion. There are many factors that you must consider when making an investment decision, including, but not limited to, product features, risks, whether or not an investment meets your investment objectives, risk tolerance, and other personalized factors. Investing in securities involves risks, and there is always the potential of losing your entire investment.