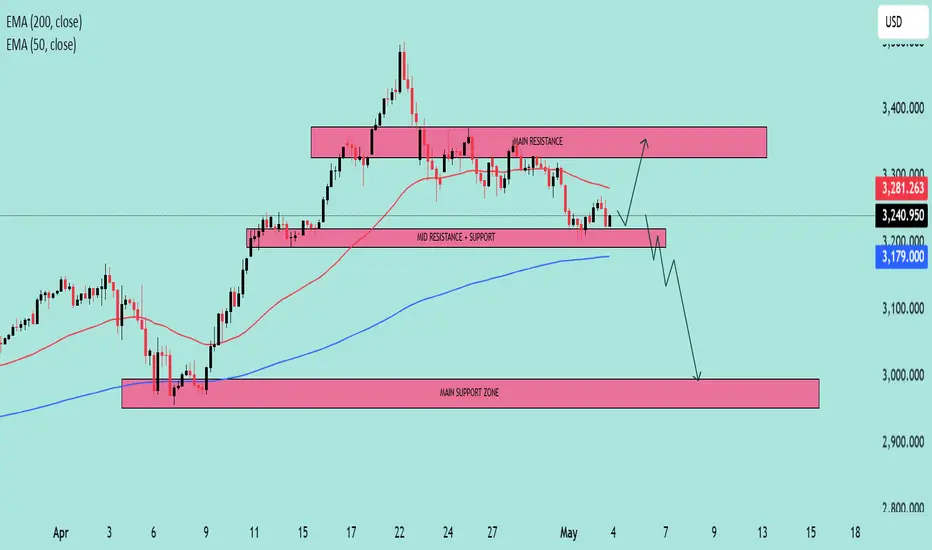
XAU/USD Market Outlook – Key Levels & Scenarios (May 2025)📊 Market Overview
Asset: XAU/USD (Gold vs. USD) – likely
Timeframe: 🕒 4H or Daily
EMAs:
🔴 50 EMA = 3,281 (short-term trend)
🔵 200 EMA = 3,179 (long-term trend)
🧱 Key Zones
🔺 Main Resistance Zone (🚫 Supply Area)
📍 ~3,320–3,400
🔍 Observation: Strong rejection zone with multiple failed attempts. 🚧 Price struggles to break and hold above here.
⚖️ Mid Support & Resistance Zone
📍 ~3,200–3,250
🧭 Current Action: Price is consolidating here. This is a key decision zone. A bounce or breakdown will likely decide the next big move. 🤔
🟦 Main Support Zone
📍 ~2,980–3,030
🛑 Observation: Major demand zone. If price falls here, it might attract buyers 👥 for a potential rebound.
📉 EMA Analysis
🔴 50 EMA is above 🔵 200 EMA → Trend still technically bullish ✅
🟡 BUT: Price is currently below 50 EMA, showing short-term weakness ⚠️
⚡️ 200 EMA is nearby (~3,179): Acting as dynamic support — a critical bounce zone! 🛡️
🔮 Scenarios
🐂 Bullish Path
✅ If price bounces from 3,200 support zone and reclaims 🔴 50 EMA:
🎯 Target: Retest of 3,320–3,400 🔺 zone
📈 Confirmation: Strong candle closing above 3,281 🔴 EMA
🐻 Bearish Path
🚨 If price breaks below 3,200 & 200 EMA:
🕳️ Expect drop towards 2,980–3,030 🟦 zone
📉 Confirmation: Candle closes below 3,179 with weak retest
✅ Conclusion
📍 Key Level to Watch: 3,200
⚖️ Market Sentiment: Neutral → Bearish bias unless price reclaims 50 EMA
🔒 Risk Tip: Avoid longs until price confirms bullish structure again 🔐
Technicals
EUR/AUD Bearish Channel with Key Support Ahead📉 Market Structure Analysis (Bearish Bias)
Current Trend:
The pair is trading within a well-defined descending channel, indicating a bearish trend. Price action is forming lower highs and lower lows, adhering to the channel boundaries.
Moving Averages (EMA):
EMA 50 (Red) at 1.77491 is above the price, acting as dynamic resistance.
EMA 200 (Blue) at 1.73338 is close to current price, likely to act as a support area in the short term.
The bearish crossover between the 50 EMA and current price supports the continuation of downward momentum.
🔍 Key Zones:
Weak Resistance Zone:
Located around 1.7740 – 1.8000, previously a support area, now acting as resistance.
Price rejection from this zone multiple times indicates sellers' strength.
Support Zone:
Located around 1.6950 – 1.7100, where demand may return.
This zone coincides with the lower boundary of the descending channel, making it a likely reaction zone.
📊 Forecast / Expectation:
The chart projects a bear flag / corrective pullback before another leg downward toward the support zone.
If price breaks and sustains below the EMA 200, it will likely accelerate bearish pressure.
The descending channel suggests potential continuation to the downside unless price breaks out of the upper boundary with momentum.
✅ Trade Implications:
Bearish Setup:
Look for short opportunities on intraday pullbacks near the resistance or EMA 50.
Bullish Invalidations:
A breakout above the descending channel and sustained move above 1.7800 would invalidate the bearish outlook.
Conclusion:
This chart presents a technically clean bearish setup. The confluence of a descending channel, EMA rejection, and defined resistance/support zones suggests the EUR/AUD may continue lower, especially if it loses the 1.7300 level decisively.

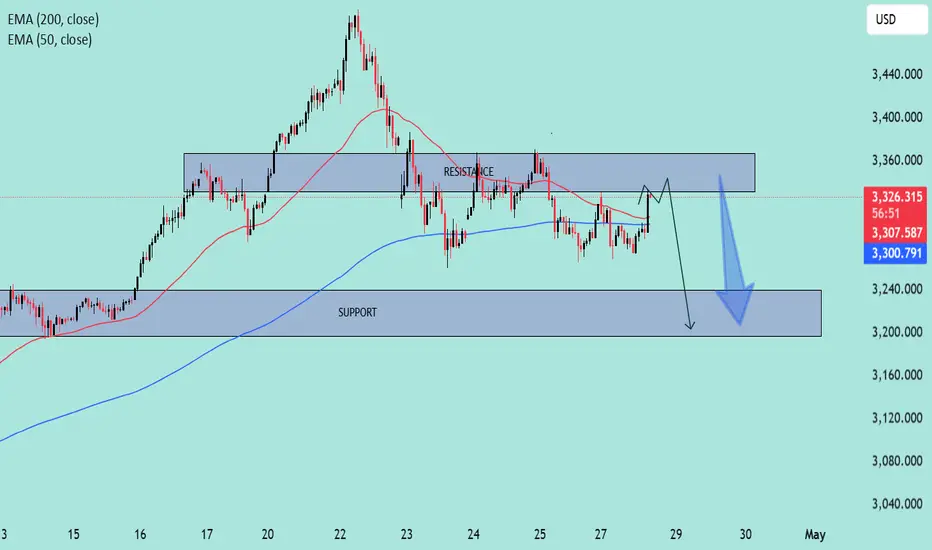
Bearish Rejection at Resistance – Potential Drop Incoming🔍 Chart Analysis Summary
1. Key Zones
Resistance Zone: ~$3,340 – $3,360
Price has been rejected multiple times from this area, showing strong selling pressure.
Support Zone: ~$3,200 – $3,240
Strong historical support level, previously held during a pullback after the last rally.
2. Moving Averages
EMA 50 (Red): Currently at ~$3,340
Price is fluctuating around it, indicating short-term indecision or a possible retest.
EMA 200 (Blue): Currently at ~$3,300
Acting as a mid-term support level. Price previously bounced from this region.
3. Pattern and Price Action
Fakeout Potential:
The chart suggests a possible false breakout above the resistance followed by a sharp drop—highlighted by the arrow. This is a common bull trap setup.
Bearish Outlook Indicated:
The projected path suggests a rejection from resistance and a drop to the support zone (~$3,200). This would create a lower high, a bearish sign.
4. Trading Bias
Bearish Setup if:
Price fails to hold above $3,340 (EMA50).
Price gets rejected from the resistance zone and breaks below $3,300 (EMA200).
Bullish Invalidated if:
Price closes convincingly above the $3,360 resistance with volume, flipping it into support.
📉 Potential Trade Idea
Short Entry: Around $3,350–$3,355
Stop Loss: Above $3,365 (above resistance zone)
Target: $3,220–$3,230 (support zone)
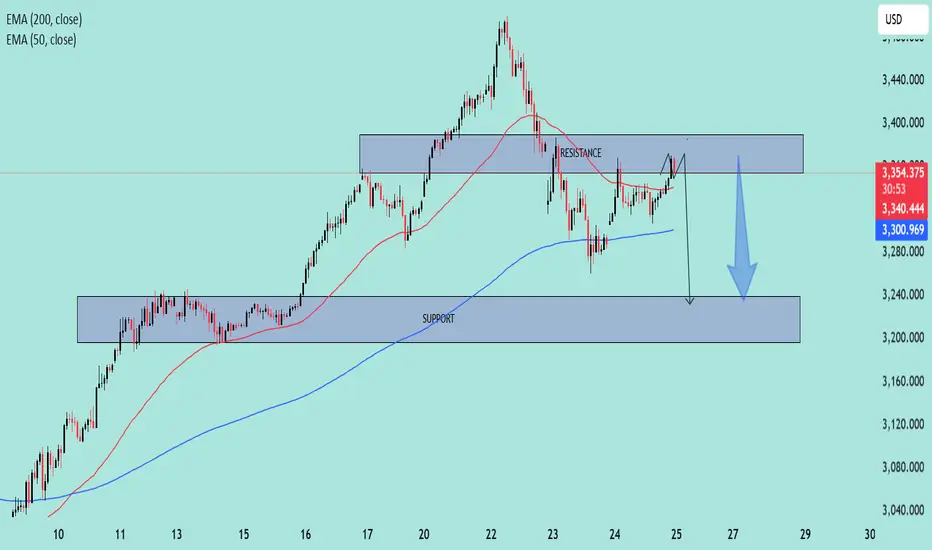
Bearish Reversal Setup: Resistance Rejection Targeting Key Chart Overview:
Asset: Unspecified (likely XAU/USD or an index based on price levels)
Indicators:
EMA 50 (red) — currently around 3,306.84
EMA 200 (blue) — currently around 3,300.54
Key Zones:
Resistance Zone: ~3,320 to 3,360
Support Zone: ~3,190 to 3,240
Technical Analysis:
Trend Context:
The asset previously had a strong bullish run, peaking above 3,400.
After the peak, it shifted into a lower high structure, indicating potential distribution.
Price is currently fluctuating below the resistance zone but above the support zone, suggesting range-bound conditions.
Moving Averages (EMA Analysis):
The 50 EMA is currently below the 200 EMA, signaling short-term bearish pressure.
Price is hovering around these EMAs, suggesting indecision and the possibility of a breakout or breakdown.
Resistance Behavior:
Price is projected to retest the resistance zone (~3,340–3,360) before a major drop.
The resistance zone has already acted as a strong supply area multiple times, reinforcing its significance.
Support Expectation:
After rejection from the resistance zone, price is expected to decline sharply toward the support zone (~3,200).
The drawn arrows suggest an expectation of a rapid sell-off after the final fake-out at resistance.
Structure and Price Action:
The forecasted scenario shows a liquidity grab above resistance (fake breakout) followed by a strong bearish reversal.
This is typical in a "distribution phase" where market makers induce breakout traders before reversing the move.
Summary:
Primary Bias: Bearish
Setup: Short from resistance rejection after liquidity sweep.
Target: Support zone around 3,200.
Invalidation: A clean breakout and retest above the resistance zone (~3,360) would invalidate the bearish idea.
Risk Management: Ensure proper stop loss above resistance to mitigate risk in case of a genuine breakout.
CAD/JPY at Key Decision Zone: Breakout or Rejection?🕵️♂️ Chart Overview:
Instrument: CAD/JPY
Chart Type: Candlestick
Time Frame: Appears to be intraday (possibly 1H or 4H)
EMAs Used:
50 EMA (Red): 102.814
200 EMA (Blue): 102.710
📊 Key Zones Identified:
1. Immediate Zone (103.30 - 103.50)
Marked as: “Resistance + Support”
This is a key decision zone. Price has tested this region multiple times, showing it holds dual roles — a flip zone.
Price is currently testing this zone again. A break and retest above could confirm bullish momentum.
2. Upper Resistance Zone (104.80 - 105.50)
A broader supply area where previous strong selling pressure occurred.
This is the next logical target if price breaks and holds above 103.50.
3. Lower Support (101.29)
Strong horizontal support, clearly defined from previous lows.
If the price fails to break above the current zone, a rejection could lead to a move back down toward this support.
📈 Bullish Scenario:
Break above 103.50, with a successful retest confirming new support.
Momentum could carry price toward the 105.00–105.50 resistance.
Supported by 50 EMA crossing above 200 EMA (early sign of bullish crossover — Golden Cross).
📉 Bearish Scenario:
Rejection from the 103.30–103.50 zone could signal continuation of range-bound or bearish pressure.
Break below 102.00, followed by momentum towards 101.29 key support.
Would invalidate short-term bullish structure.
📌 Additional Technical Notes:
The chart shows consolidation between 102.00 and 103.50 — likely accumulation or re-accumulation phase.
EMAs are tightening, indicating a potential volatility expansion move is near.
Volume is not visible but would be useful to confirm breakout strength.
📍Conclusion:
CAD/JPY is currently at a critical decision zone. The next few candles will be key. Monitor:
Breakout direction
Retest confirmations
Momentum and volume indicators (if available)

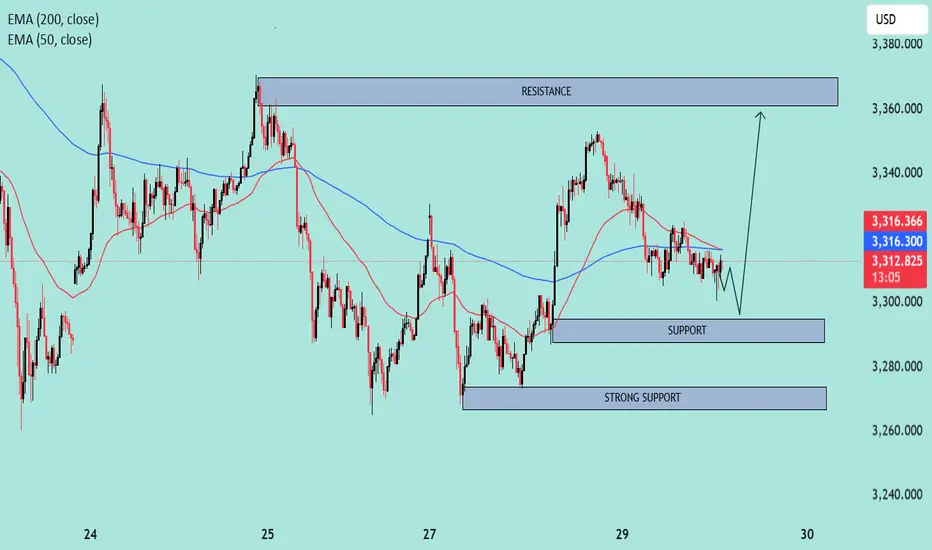
XAUUSD – Bullish Reversal Setup Near Support🟦 Chart Context:
Type: Intraday (likely 15m or 1h timeframe).
Indicators Used:
EMA 50 (Red): 3,316.497
EMA 200 (Blue): 3,316.332
Current Price: 3,312.650
🔍 Technical Analysis:
1. Trend & Moving Averages:
EMA Crossover (Bearish): The 50 EMA is slightly above the 200 EMA, but both are flat and converging, suggesting a neutral to slightly bearish short-term sentiment.
Price below both EMAs indicates bearish pressure in the immediate term.
2. Key Zones:
Resistance Zone: 3,355 – 3,370
Price was previously rejected from this zone, indicating strong supply and likely sell orders.
Support Zone: 3,295 – 3,305
Price has bounced here multiple times, suggesting active buyers.
Strong Support: 3,265 – 3,275
A broader and more historically respected area that could lead to a significant reversal if tested.
3. Price Action:
Currently forming lower highs and lower lows, which is a classic sign of short-term weakness.
A small descending triangle appears to be forming near the support level (bearish bias), but the drawn forecast suggests a potential fakeout breakdown followed by a bullish reversal.
4. Expected Scenario (as per chart projection):
Price might dip briefly into the 3,295–3,305 support, triggering liquidity grab (stop hunts).
A potential bullish rally towards the 3,355–3,370 resistance zone is expected.
This suggests a buy-the-dip strategy near support with tight risk management.
📈 Trade Outlook:
🟢 Bullish Bias:
If the support at 3,295–3,305 holds and price reclaims the 200 EMA convincingly.
Target: 3,355–3,370 resistance zone.
🔴 Bearish Bias:
If price breaks below the strong support (3,265), expect continuation lower.
Downside targets would then extend towards 3,240–3,250.
✅ Conclusion:
Current bias: Neutral to short-term bearish unless the lower support holds.
Key action zone: Watch price reaction around 3,295.
Strategy suggestion: Monitor for a bullish reversal signal at support; avoid chasing trades in the middle of the range.
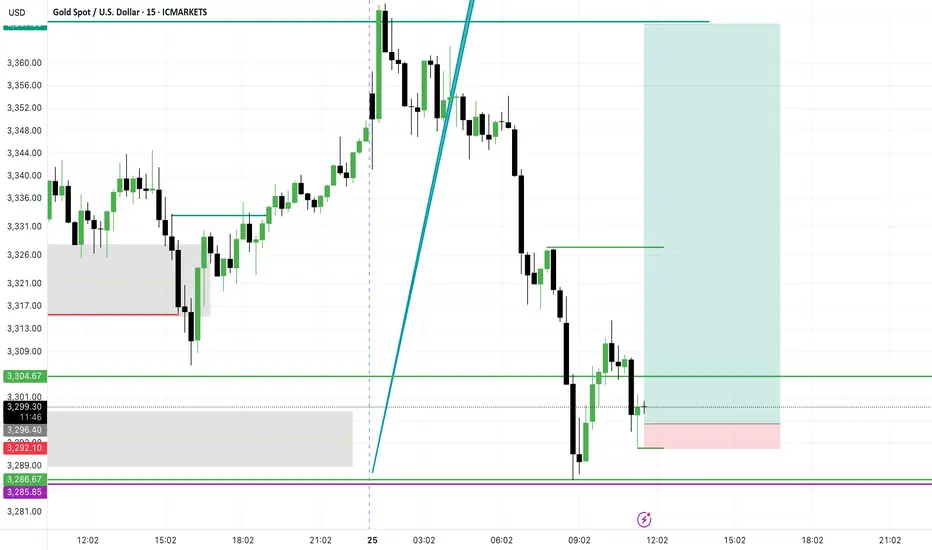
XAUUSD - LONG 1-16RR TRADE IDEIA XAUUSD - LONG 1-16RR TRADE IDEIA - Risky trade. better use small risk if u wanna take it. might be very well profitable.
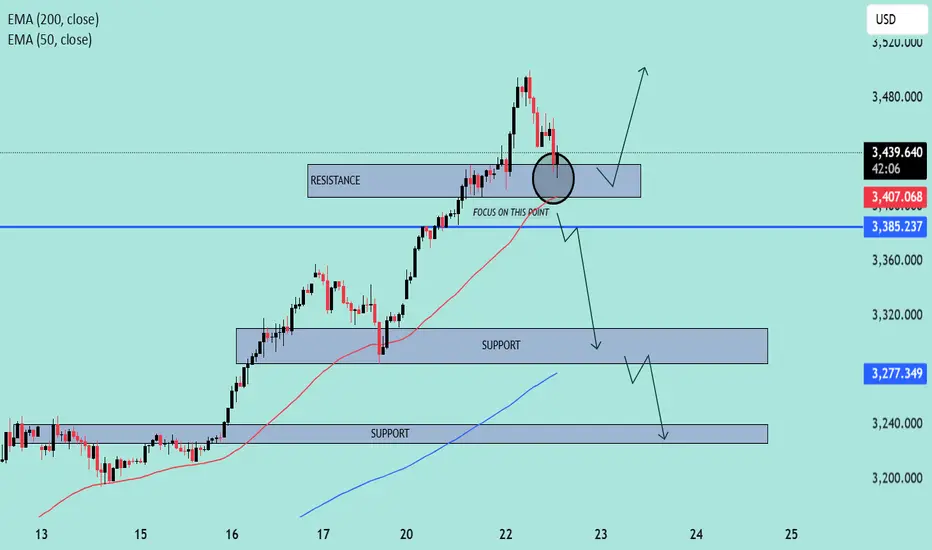
"XAU/USD at Crucial Support Zone"📈 Chart Overview
Instrument: Likely XAU/USD (Gold vs USD)
Date: April 22, 2025
Timeframe: Appears to be a short-term chart (possibly 1H or 4H)
🧠 Key Technical Elements
1. Exponential Moving Averages (EMAs)
50 EMA (Red): Currently at 3,406.818 — acting as short-term dynamic support/resistance.
200 EMA (Blue): Currently at 3,277.286 — indicating long-term trend direction.
The price is well above the 200 EMA, indicating a bullish long-term trend. However, it’s now testing the 50 EMA, suggesting a potential short-term inflection point.
2. Support and Resistance Zones
Immediate Resistance Zone: Around 3,430 – 3,440, which price recently rejected.
Key Support Zone: Around 3,385 – 3,390 (labeled “FOCUS ON THIS POINT”), which aligns closely with the 50 EMA.
Lower Support Zones:
3,310 – 3,320
3,240 – 3,260
🔍 Technical Scenarios Outlined on Chart
✅ Bullish Scenario (Upper Arrow Path)
If the price holds above the 3,385 support zone, especially with support from the 50 EMA:
We may see a bounce back to test and potentially break above the 3,430 resistance.
This would confirm a continuation of the uptrend.
⚠️ Bearish Scenario (Lower Arrow Path)
If the price fails to hold above 3,385:
A breakdown may lead to a drop toward 3,320, with possible continuation toward 3,240.
This would indicate a short-term bearish correction within a longer bullish trend.
🔑 Critical Price Level
Focus on the 3,385 zone — This is a confluence area where:
Horizontal support meets
50 EMA is located
A potential decision point for bulls vs. bears
🧭 Trading Strategy Considerations
For Bulls:
Look for bullish candlestick formations or volume confirmation near the 3,385 level.
Target a retest of the 3,430+ area with stops below 3,375.
For Bears:
Watch for strong bearish breakdown below 3,385.
First target: 3,320, second: 3,240, with stop-loss above 3,400.
📌 Conclusion
The chart illustrates a key inflection point. Price is at a decision zone — hold and bounce = continuation of bullish momentum, break = short-term correction. All eyes on how price reacts at the 50 EMA and support zone near 3,385.
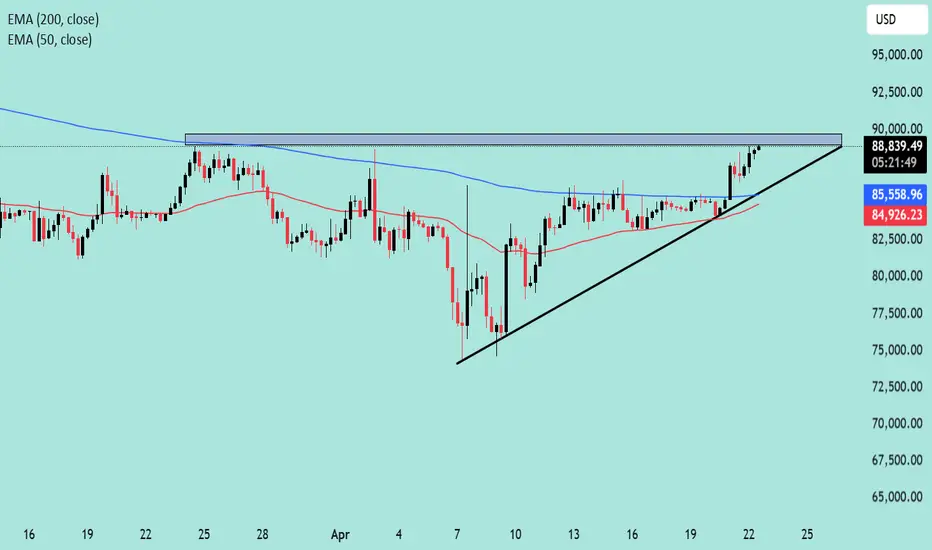
BTC Approaches Breakout Zone in Ascending Triangle – Key Resist,📈 Chart Overview
Instrument: BTC/USD
Timeframe: Likely 4H or Daily
Indicators Used:
EMA 50 (Red) – 84,924.30
EMA 200 (Blue) – 85,558.47
🔍 Key Technical Observations
1. Ascending Triangle Formation
The chart shows a clear ascending triangle, a bullish continuation pattern.
Flat resistance zone: Around $88,700–$89,000.
Higher lows forming a solid upward sloping trendline, suggesting increasing buying pressure.
2. Price Above Key EMAs
Current price: $88,779.43, which is above both the 50 EMA and 200 EMA.
This indicates bullish momentum as price breaks above dynamic resistance levels.
3. Volume Consideration (Missing)
While volume is not visible on the chart, an ideal breakout from an ascending triangle should be accompanied by increasing volume to confirm validity.
🔄 Possible Scenarios
✅ Bullish Breakout
A confirmed breakout above $89,000 with strong volume can lead to a measured move toward:
Target = Triangle height ≈ $13,000 → Potential target: $101,500 – $102,000
Next resistance levels to watch: $92,000, $95,000, and $100,000 psychological zone.
❌ Fakeout or Rejection
If BTC gets rejected at resistance, watch for:
Retest of support trendline (~$86,000).
EMA 50 and 200 as dynamic support around $84,900–$85,500.
Breakdown below the trendline may signal a short-term correction to $80,000–$82,500.
📊 Conclusion
BTC is at a crucial decision point. The ascending triangle suggests bullish potential, but a breakout confirmation is essential. Price is above both major EMAs, signaling strength, but a rejection from resistance could invite short-term bears.
Bearish Reversal in Play! | Key EMA Rejection & Support Targets🔍 Chart Analysis Summary
🕐 Timeframe: Likely a short-term (H1 or H4) chart.
📈 Asset: Most probably XAU/USD (Gold) or a similar asset.
🔴 Trend Breakdown
📍 Previous Trend:
✅ Strong bullish momentum 📈 pushing price into a resistance zone.
📍 Current Price Action:
🚨 Bearish rejection from resistance 🟥
Price got rejected exactly at the resistance zone (gray box) and the EMA 50 line 🔴 — a classic setup for a reversal ⚠️
📉 Key Technical Levels
🟦 Resistance Zone:
🔹 Between 3,385 – 3,400 USD
🧱 This zone rejected price strongly (see red candles)
📌 Also aligned with EMA 50 (3,400.837) — confluence adds strength 💪
🟩 Support Zones:
First Support Zone – ~3,285 📉
💙 In line with the EMA 200 (3,285.687)
🛡️ Might cause a temporary bounce 📈
Second Support Zone – ~3,240
📉 Marked as the deeper support in the bear case 🕳️
💥 If the first support breaks, this becomes the next target 🎯
📊 Indicator Insights
EMA 50 (🔴 Red): 3,400.837 – acting as dynamic resistance 😤
EMA 200 (🔵 Blue): 3,285.687 – acting as dynamic support 🛡️
📉 Price breaking below EMA 50 = first bearish sign
📉 Approaching EMA 200 = watch for either a bounce 🏀 or a breakdown 💥
🎯 Bearish Setup Forecast
📉 Here's what the arrows show (strategy logic):
📉 Breakdown below resistance → strong bearish move
🎯 Target 1: First support (EMA 200 / ~3,285)
🔄 Minor pullback possible (fake bounce 🪃)
💣 Continuation lower toward next support (~3,240)
📌 Critical Zone to Watch 🔍
⚫️ The circle marked “FOCUS ON THIS POINT” is key:
📌 Failed retest = confirmation of resistance
📌 Price rejected this level + closed below = strong bearish signal 🚨
🧠 Professional Insights
Element Observation Emoji
Trend Shift Bullish ➡️ Bearish reversal 🔄📉
Momentum Bearish pressure increasing 💨🟥
Risk Point Resistance near EMA 50 ⚠️🧱
Trade Idea Short toward supports 📉🎯
Confirmation Rejection candle after retest 🕯️🔁
Focus Level EMA confluence near resistance 🎯📌
🛠️ Possible Trade Plan (for educational purposes only)
Short Entry: Below 3,385 (after rejection 🔻)
Stop-Loss: Above 3,405 (above EMA 50 🛑)
Target 1: 3,285 🧲
Target 2: 3,240 📉

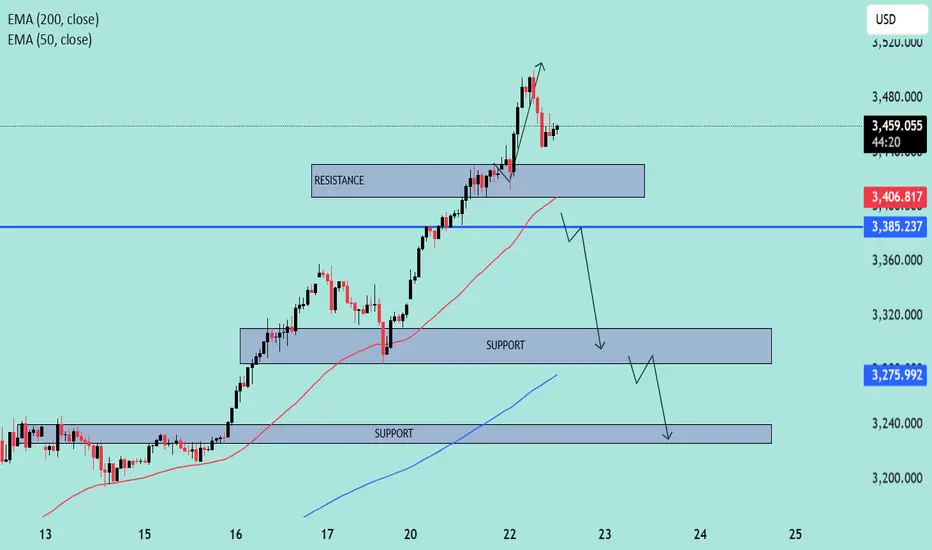
US30 Approaching Key Support Zone – Potential Reversal Ahead?📊 Chart Overview:
Timeframe: Looks like an intraday (maybe 1H or 2H).
Indicators:
EMA 50 (Red): 38,964.7
EMA 200 (Blue): 39,637.0
🔍 Key Levels & Structure:
🔵 Support Zone (Highlighted):
Around 36,800 – 37,200 range.
This is a well-tested support level where price previously bounced.
Current price action is approaching this zone again, which increases the chance of a potential bullish reaction.
🟣 Resistance Level:
Defined around 40,500 area.
Price has rejected multiple times from this zone.
Previously served as a consolidation/decision area.
📍 Focus Point (Previous Support Turned Resistance):
Near 38,700 – 39,000.
This level may act as a reaction point on the way back up.
📉 Current Price Action:
Strong downward momentum heading into the support zone.
Price is under both EMAs, suggesting short-term bearish trend.
However, the drawn arrow suggests a potential reversal bounce from the support.
🧠 Interpretation & Scenario Plan:
🅰️ Bullish Scenario:
Price touches or sweeps the support zone.
Bullish structure or reversal candle forms (e.g., hammer, bullish engulfing).
Break back above EMA 50 & Focus Point could confirm the shift.
Target: Revisit Resistance Zone (above 40,000).
🅱️ Bearish Scenario:
Support fails to hold.
Clean break below 36,800 with volume could lead to accelerated sell-off.
Watch for breakdown retests of support turned resistance.
🔔 Takeaway:
⚠️ Current move is bearish, but price is approaching a key demand zone. Bulls might step in if the zone holds. Confirmation is key before going long. Reclaiming EMAs would strengthen bullish bias.

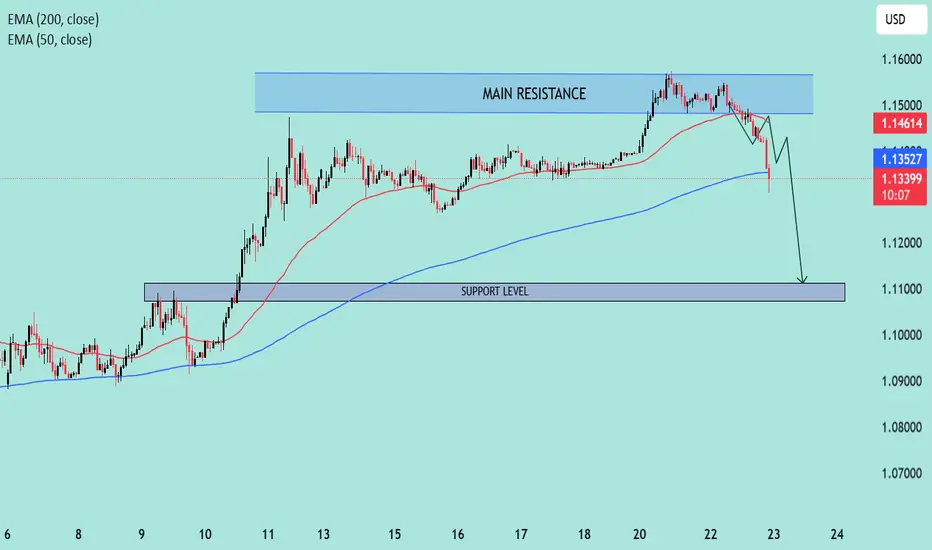
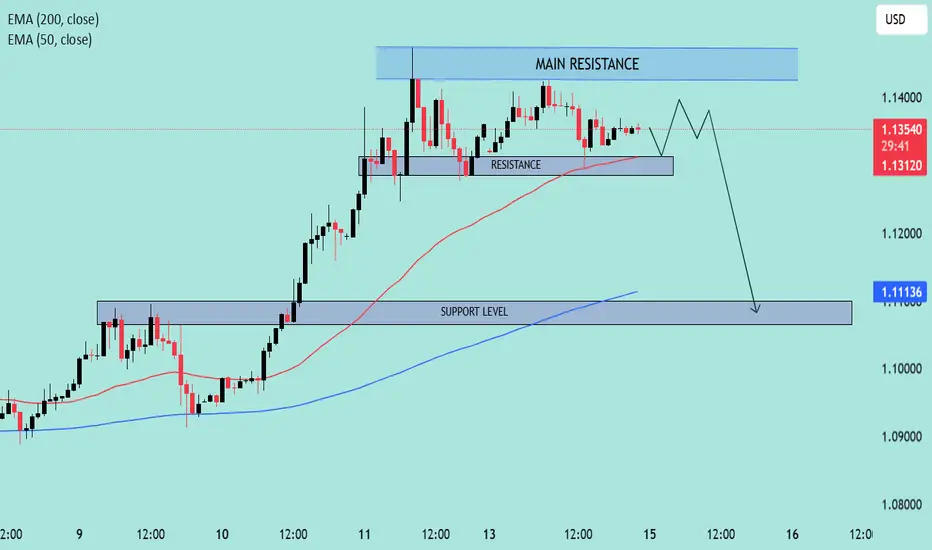
EUR/USD Bearish Setup Unfolding Below Key Resistance📊 Technical Analysis of EUR/USD (4H Chart)
🧭 Chart Overview:
Current Price: ~1.1350
Indicators Used:
EMA 50 (Red): ~1.1311 — acting as dynamic support.
EMA 200 (Blue): ~1.1114 — aligns closely with major support zone.
📌 Key Levels:
🔼 Main Resistance Zone: 1.1375 – 1.1400
Price has tested this zone multiple times, forming a potential double top pattern.
Strong bearish pressure observed each time price enters this area.
🔁 Minor Resistance (Retest Zone): ~1.1325 – 1.1345
Currently acting as a decision zone.
If price fails to hold above this level, it could turn into resistance on the next bearish leg.
🔽 Support Zone: 1.1100 – 1.1130
Converges with EMA 200 — making it a high-probability demand zone.
Potential target for the anticipated drop.
🧠 Price Action & Structure:
Market showed a strong bullish rally previously, breaking through resistance levels.
Now showing signs of exhaustion at the top.
Bearish scenario projected with a lower high forming below the main resistance, followed by a sell-off toward the support zone.
⚙️ Possible Scenarios:
Bearish Scenario (High Probability):
Price rejects the minor resistance → breaks below EMA 50 → continues lower to support.
Target: 1.1110 area.
Bullish Scenario (Low Probability):
Price reclaims and closes above 1.1375 with strong momentum.
Potential breakout and continuation toward 1.1450+.
🧩 Confluences Supporting Bearish Bias:
Lower high formation potential.
EMA 50 starting to flatten.
Failure to maintain momentum above main resistance.
Clean drop path toward 1.1110 if support breaks.
📉 Conclusion:
This setup favors short-term bearish movement, particularly if the price rejects around the 1.1345 level again. A breakdown below the minor resistance zone would likely trigger a sell-off toward the 1.1110 support, in line with the 200 EMA.
XAU/USD Target Achieved – $3,500 Successfully Hit 🔥 XAU/USD Target Smashed – $3,500 HIT! 🎯💰
Gold has officially reached $3,500, perfectly hitting our projected buy target!
This move confirms the strength of the bullish momentum and technical breakout setup.
🔹 Entry: Above $3,430
🔹 Final Target: ✅ $3,500 – Hit
🔹 Result: High-conviction setup delivered with precision
🔹 Trend: Remains bullish, but profit-taking expected at round number resistance
👏 Massive congrats to all who followed the plan — another clean win on XAU/USD!
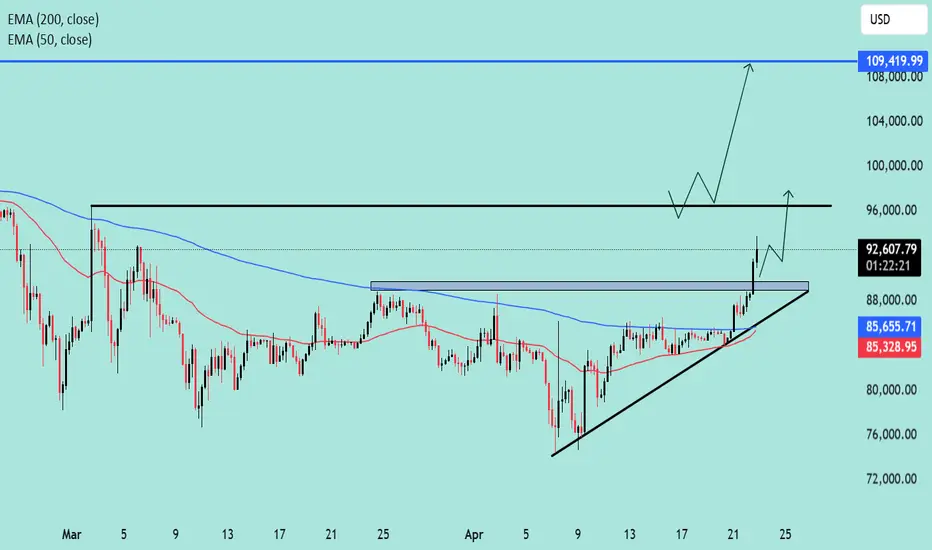
BTC/USD Eyes $109K After Bullish Breakout!!🧠 Chart Type and Indicators:
Chart Type: Candlestick
Indicators Used:
EMA 50 (red line): 85,335.18
EMA 200 (blue line): 85,657.29
🔍 Technical Pattern Analysis:
Pattern Identified: Ascending Triangle
The price has formed higher lows (ascending trendline support) while repeatedly testing a horizontal resistance zone (~$88,000), forming an ascending triangle.
This is typically a bullish continuation pattern when it occurs after an uptrend, though in this context, it's forming after a consolidation, giving more significance to the breakout.
🚀 Breakout Confirmation:
The price has broken above the horizontal resistance and is currently trading at $92,766.51.
Volume is not visible but should be increasing during a valid breakout.
Both EMAs have been decisively breached to the upside, signaling momentum shift in favor of bulls.
🧩 Key Levels:
Support Zone (Post-Breakout Retest): ~$88,000
Previously a resistance zone, now likely to act as support.
Immediate Resistance: ~$96,000
Historical resistance zone shown on the chart with a horizontal black line.
Extended Target (measured move): ~$109,420
Based on the height of the triangle projected from the breakout point.
📈 Price Action Forecast:
Two possible scenarios (depicted with arrows on the chart):
Bullish Continuation:
A retest of the $88,000 zone followed by continuation to $96,000, then $109,420.
Short-Term Pullback:
Price may dip to retest the breakout zone (~$88,000), consolidate, then rally higher.
✅ Bullish Signals Summary:
Breakout from a bullish ascending triangle.
EMAs crossed and price holding above them.
Clear higher highs and higher lows formation.
Momentum suggesting further upside.
🧨 Risks to Watch:
False Breakout Risk: If the price fails to hold above $88,000 and falls back into the triangle range.
Macro Factors: Bitcoin remains sensitive to macroeconomic news and regulations that could disrupt technical setups.
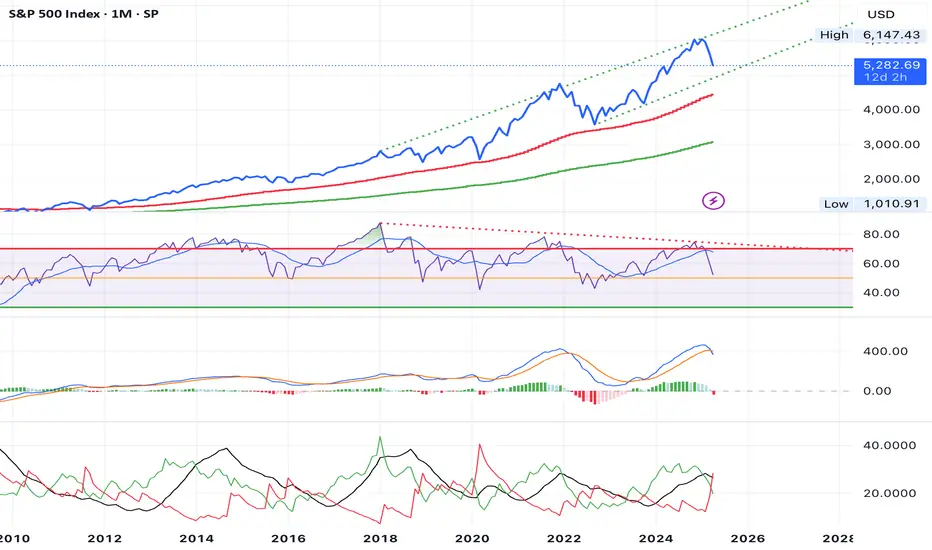
WILL THE S&P 500 COME CRASHING DOWN? TRIPLE RSI DIVERGENCE?!S&P 500 (SPX) Is considered to be one of the primary benchmarks for the U.S economy. Recently it appears to be showing a triple bearish RSI divergence, DMI indicating bearish with ADX above 20, and a bearish MACD on the 1 Month chart. The technical analysis seems to have a highly bearish hypothesis in my opinion. If we give some thought to Ray Dalio's Principles for Dealing with the Changing World Order , some haunting indicators appear to be forming. Could this just be a minor correction? Or is this the beginning of an extended economic downturn?
Disclaimer: Not financial advice.
EUR/USD Bearish Setup Unfolding Below Key Resistance📊 Technical Analysis of EUR/USD (4H Chart)
🧭 Chart Overview:
Current Price: ~1.1350
Indicators Used:
EMA 50 (Red): ~1.1311 — acting as dynamic support.
EMA 200 (Blue): ~1.1114 — aligns closely with major support zone.
📌 Key Levels:
🔼 Main Resistance Zone: 1.1375 – 1.1400
Price has tested this zone multiple times, forming a potential double top pattern.
Strong bearish pressure observed each time price enters this area.
🔁 Minor Resistance (Retest Zone): ~1.1325 – 1.1345
Currently acting as a decision zone.
If price fails to hold above this level, it could turn into resistance on the next bearish leg.
🔽 Support Zone: 1.1100 – 1.1130
Converges with EMA 200 — making it a high-probability demand zone.
Potential target for the anticipated drop.
🧠 Price Action & Structure:
Market showed a strong bullish rally previously, breaking through resistance levels.
Now showing signs of exhaustion at the top.
Bearish scenario projected with a lower high forming below the main resistance, followed by a sell-off toward the support zone.
⚙️ Possible Scenarios:
Bearish Scenario (High Probability):
Price rejects the minor resistance → breaks below EMA 50 → continues lower to support.
Target: 1.1110 area.
Bullish Scenario (Low Probability):
Price reclaims and closes above 1.1375 with strong momentum.
Potential breakout and continuation toward 1.1450+.
🧩 Confluences Supporting Bearish Bias:
Lower high formation potential.
EMA 50 starting to flatten.
Failure to maintain momentum above main resistance.
Clean drop path toward 1.1110 if support breaks.
📉 Conclusion:
This setup favors short-term bearish movement, particularly if the price rejects around the 1.1345 level again. A breakdown below the minor resistance zone would likely trigger a sell-off toward the 1.1110 support, in line with the 200 EMA.
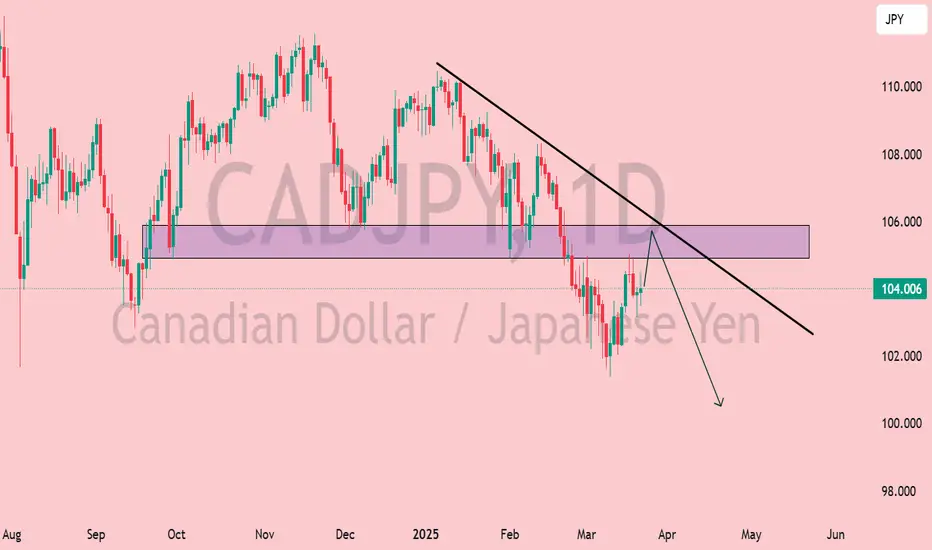
CAD/JPY Bearish Setup Near Resistance – Rejection Incoming?📉 Trend Analysis:
The pair is in a downtrend, confirmed by the descending trendline.
Lower highs and lower lows indicate bearish momentum.
📌 Key Levels:
Resistance Zone (104.5 - 106.0): Marked in purple, this area has previously acted as support and is now a key resistance zone.
Support Area: Around 100.0 - 101.0, a psychological level where price may find demand.
📊 Trade Scenario:
Bearish Rejection Expected: Price is approaching the resistance zone and trendline confluence. If rejection occurs, a downward move towards 100.0 is likely.
Break Above? If price breaks above the resistance zone and trendline, bullish momentum could invalidate the bearish setup.
🔍 Conclusion:
Watching for rejection near 105.0-106.0 to confirm a short opportunity.
If rejection happens, next targets are 102.0 → 100.0.
A bullish breakout above 106.0 could shift momentum upwards.
EOSUSDT Breakout with Strong Volume: Bullish Momentum BuildingEOSUSDT has recently completed a breakout, demonstrating strong bullish momentum with significant volume backing the move. The breakout from the previous resistance level indicates a potential trend reversal, and with the volume surge, it confirms that investors are actively participating in this rally. Market sentiment appears positive, and the pair is well-positioned to capitalize on this momentum.
With the current bullish outlook, EOSUSDT shows promising potential for gains ranging from 90% to 100% or more. The increasing interest from investors further supports the likelihood of continued upward movement. If the buying pressure sustains, we may witness a robust rally that could attract more attention from the trading community.
Technical analysis highlights that the successful breakout combined with consistent volume influx may serve as a solid foundation for future growth. Traders should keep an eye on key support and resistance levels to make the most of potential price surges. As the momentum builds, managing risk effectively and staying updated with market conditions will be crucial.
✅ Show your support by hitting the like button and
✅ Leaving a comment below! (What is You opinion about this Coin)
Your feedback and engagement keep me inspired to share more insightful market analysis with you!

XAU/USD Gold Bullish Momentum – Targeting $3,153+?📊 XAU/USD Daily Analysis – Bullish Continuation in Ascending Channel
🔹 Market Structure & Trend Analysis
Gold (XAU/USD) remains in a well-defined ascending channel, respecting both dynamic support and resistance levels. The trend remains bullish, with higher highs and higher lows forming since late 2024. Currently, price is trading near the upper boundary of the channel, suggesting strong bullish momentum.
🔹 Key Technical Levels
Resistance Zone: $3,153 – $3,200 (potential breakout target)
Current Price: $3,020 (holding above key mid-range support)
Support Levels:
Channel Midline Support: ~$2,980
38.2% Fibonacci Retracement: ~$2,900 (potential corrective zone)
Channel Bottom Support: ~$2,700 (strong demand area)
🔹 Bullish Scenario 🟢
A break and close above $3,153 would confirm a bullish breakout, opening the door for a rally toward $3,200 and beyond.
Momentum remains strong, with price structure favoring continued upside as long as it stays above the midline of the channel.
🔹 Bearish Scenario 🔴
Failure to break above $3,153 could trigger a short-term pullback toward $2,980 - $2,900, where buyers may re-enter.
A confirmed breakdown below the ascending channel would invalidate the bullish setup and expose $2,700 - $2,600 as potential downside targets.
🔹 Conclusion & Trade Considerations
Bias: Bullish as long as price remains inside the ascending channel.
Entry Considerations: Retest of $3,020 - $2,980 as support could offer a high-probability long setup.
Breakout Confirmation: A daily close above $3,153 strengthens the bullish case for continuation.

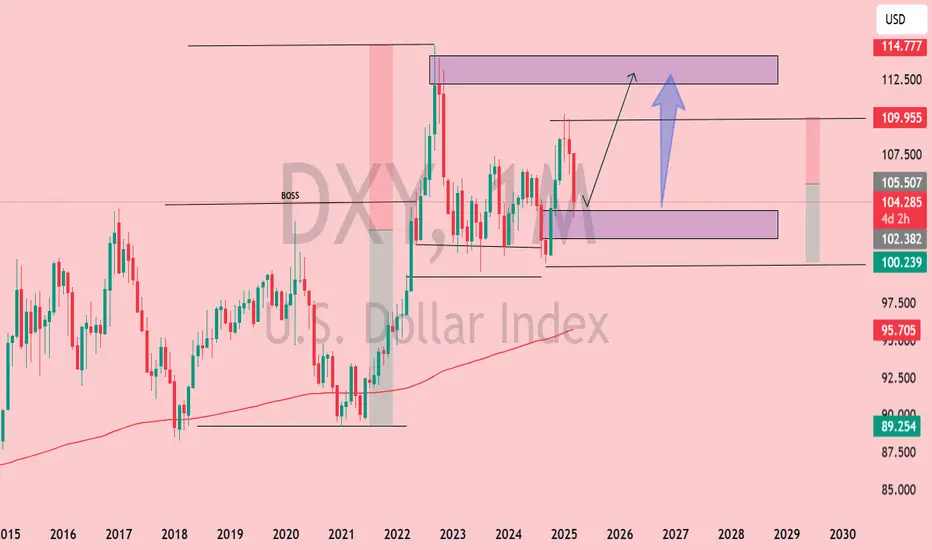
DXY Monthly Analysis: Key Support Holding, Bullish Move Ahead?📊 DXY Monthly Chart Analysis (March 27, 2025)
Key Observations:
Current Price Action:
The U.S. Dollar Index (DXY) is trading near 104.267, with notable resistance ahead.
Price is consolidating within a key demand zone (~102.5–104) after rejecting higher levels.
Technical Levels:
Support Zone: 100.2–104 (Highlighted in purple)
Resistance Zone: 112.5–114.7 (Highlighted in purple)
Major Resistance: 114.77 (Previous high, acting as a supply zone)
200-MA Support: Located below current price, offering a long-term bullish confluence.
Market Structure:
Price remains in a higher time-frame bullish trend but is experiencing a correction.
The "BOSS" level (Break of Structure) suggests a prior bullish breakout.
If the demand zone holds, a bullish continuation towards 112.5–114.7 is possible.
Projected Move:
A bounce from 102–104 could trigger a rally toward the upper resistance zone (~112.5).
A break below 100.2 could indicate a shift in trend and further downside.
Conclusion:
DXY is at a critical decision point. Holding the current support zone (~102–104) could fuel a bullish continuation toward 112–114, while a breakdown below 100.2 would weaken bullish momentum.
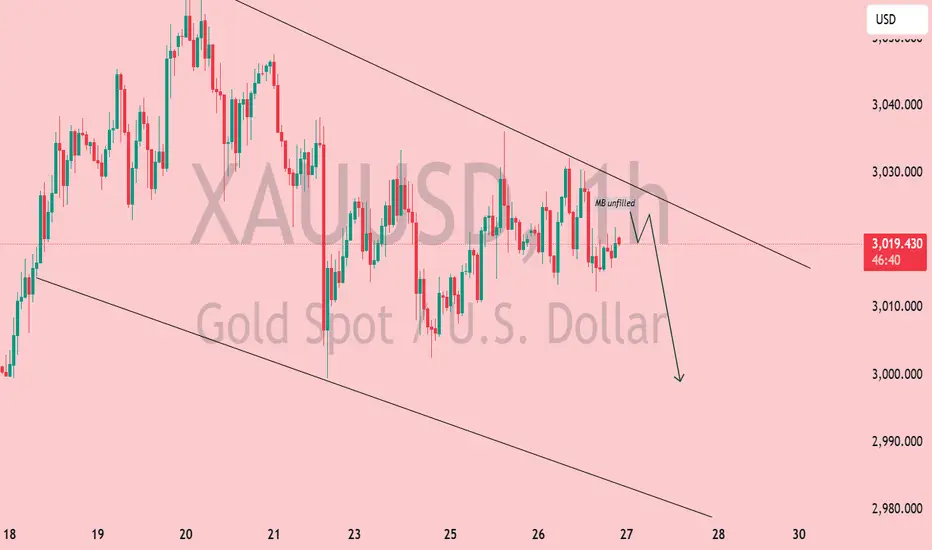
XAU/USD Analysis–Bearish Continuation Within Descending Channel📉 Gold (XAU/USD) H1 Analysis – March 26, 2025
🔻 Descending Channel Formation:
The price remains confined within a downward-sloping channel, signaling continued bearish pressure.
Lower highs and lower lows confirm the short-term downtrend.
📍 Key Levels & Structure:
Current Price: $3,019
Resistance Zone: Around $3,025 - $3,030 (upper boundary of the channel)
Support Zone: $3,000 psychological level and potential lower boundary near $2,985
📌 Market Imbalance (MB) Not Filled:
A minor liquidity gap remains unfilled above, indicating a possible short-term retest before continuation.
📉 Bearish Expectation:
If price fails to break above the resistance trendline, we could see a drop toward $3,000 or even lower.
Watch for rejection signals at the upper boundary for short opportunities.
🔎 Trade Considerations:
Bearish Bias: Short entries from resistance with targets at $3,010 - $3,000.
Invalidation: A breakout above $3,030 could signal bullish strength.
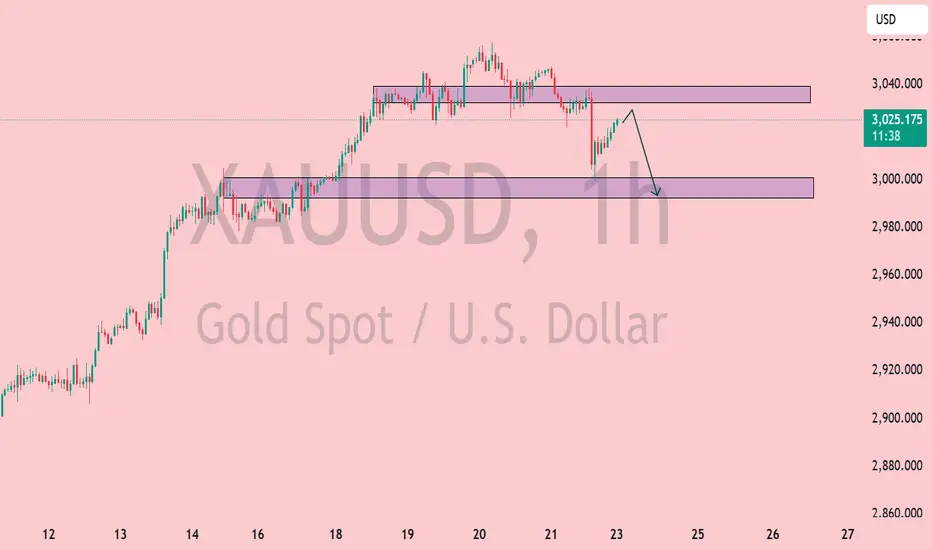
XAU/USD Analysis: Bearish Pullback Towards $3,000 SupportXAU/USD (Gold Spot vs. U.S. Dollar) Technical Analysis - 1H Chart
1. Price Action & Trend Analysis
The market has been in a strong uptrend, characterized by higher highs and higher lows.
Recently, the price faced resistance near the $3,040 level, leading to a rejection.
A pullback is currently in progress, suggesting a possible retracement to a demand zone.
2. Key Levels
Resistance Zone (Supply Zone): Around $3,040 - $3,045 where price has been rejected multiple times.
Support Zone (Demand Zone): Around $3,000 - $3,005, a previous accumulation area.
Current Price: $3,023.695
3. Market Structure & Expected Move
The price tested the resistance zone, failed to break above, and is now reacting downward.
A bearish projection (as shown in the chart) suggests a potential move toward the $3,000 - $3,005 support zone.
If the price reaches this level and finds buying pressure, we could see a reversal or continuation of the uptrend.
4. Indicators & Confluence Factors
Support-Resistance Flip: The previous support at $3,000 could act as a strong support again.
Bearish Momentum: Short-term price action suggests sellers are gaining control after rejection at resistance.
Liquidity Zones: The highlighted purple zones represent institutional order blocks where significant buy/sell orders exist.
5. Trading Plan & Strategy
Bearish Scenario: If price breaks below $3,000, we could see further downside pressure.
Bullish Scenario: A bounce from $3,000 could provide buying opportunities for another attempt at breaking $3,040.
6. Conclusion
The market is currently retracing from resistance, and a short-term bearish move is expected toward $3,000.
Traders should watch for price reaction at $3,000 to determine if it holds as support or breaks for further downside.
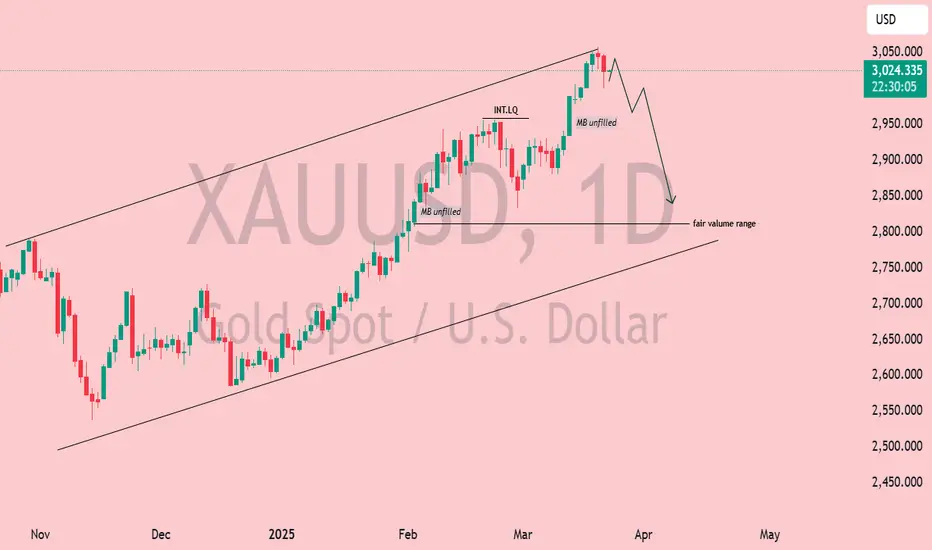
Gold (XAU/USD) – Possible Reversal from Resistance XAU/USD (Gold Spot vs. U.S. Dollar) on the 1-day timeframe and shows an ascending channel with key price levels and technical annotations.
Key Observations:
Trend Direction:
The price has been in a strong uptrend since late 2024.
It is currently near the upper boundary of the ascending channel.
Liquidity & Market Structure:
INT.LQ (Internal Liquidity): This suggests an area where liquidity is expected to be taken before a potential move.
MB Unfilled (Market Balances Unfilled): These indicate inefficiencies in price movement that the market may revisit.
Projected Price Action:
The chart shows a potential short-term pullback from the upper boundary.
Expected retracement towards the "fair value range" around $2,800–$2,850.
If this scenario plays out, it would align with price rebalancing and a healthier uptrend continuation.
Key Levels:
Resistance: Around $3,050, which aligns with the upper trendline.
Support Zones: Around $2,950 and deeper at $2,800.
Potential Trading Strategy:
Bearish Case: If rejection occurs at $3,050, short opportunities could exist targeting $2,900–$2,850.
Bullish Case: If price retraces and finds strong support in the fair value range, it could resume its uptrend.