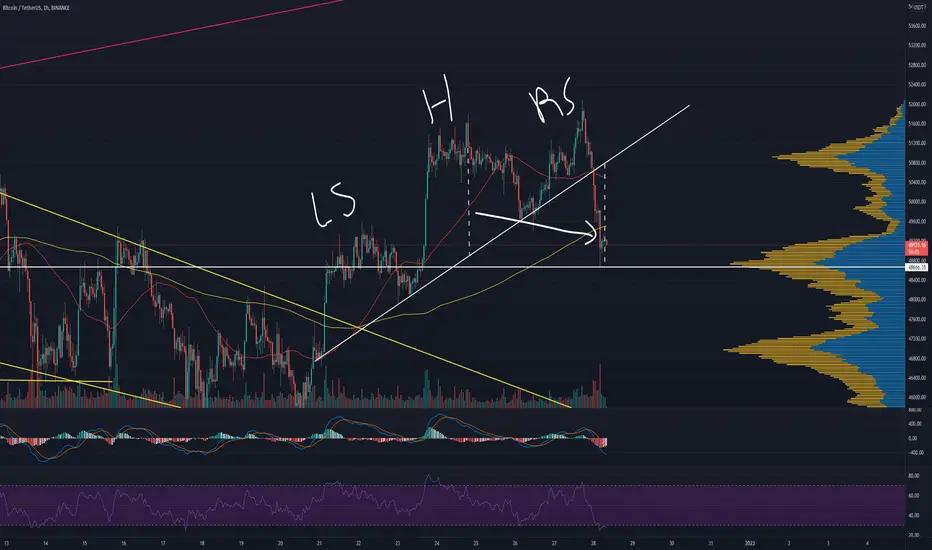
BTC (HNS Play Out)My speculation was right, sadly RS was form on BTC, hence we have a technical break down target. Earlier my ideas for ascending triangle was invalid. We are oversold on the RSI. However there's strong support on the 48666.35 base on the vpvr. We need to hold this level, otherwise more downside will come for BTC.
BTC 1H
Technicaltarget
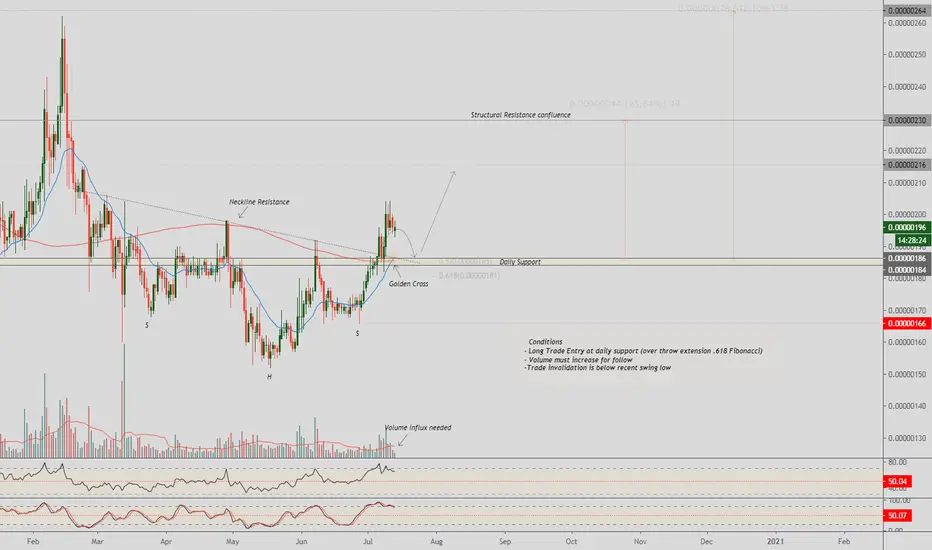
TRXBTC Inv. Head & Shoulders|Daily Support|Golden Cross|.618 FIbEvening Traders,
Today’s Analysis – TRXBTC – breaking out of an inverted head and shoulders where price consolidation above key levels will change the trend.
Points to consider
- Neckline breached (Pattern Validation)
- Daily support breached (Golden Cross confluence)
- Structural resistance confluence (Technical target)
- Oscillators cooling off
- Volume follow through (Continuation)
- Valid long on retest (Risk defined)
TRXBTC breached its neckline and established a technical higher high; validation of the pattern, bias is now bullish.
The daily support level is in confluence with the 200 MA, an official golden cross has also been established, further solidifying the importance of the level.
The technical target is in confluence with structural resistance, price action around the area will help with trade management.
Oscillators are both cooling off from overextended levels. Retest of daily support will magnet oscillators towards their respective equilibrium (50 levels) before a probable impulse. This allows for a more RISK defined entry.
Volume needs follow through for momentum to sustain, this will be key upon a retest of daily support.
Overall, in my opinion, a long trade is valid at daily support (retest), the .618 Fibonacci being an over extension. This retest must be backed by volume for follow through, failure will lead to trade invalidation - candle closes below daily.
What are your thoughts?
Thank you for following my work!
And remember,
“Every trader has strengths and weakness. Some are good holders of winners, but may hold their losers a little too long. Others may cut their winners a little short, but are quick to take their losses. As long as you stick to your own style, you get the good and bad in your own approach.” - Michael Marcus
ETHBTC Inv. Head and shoulders| Bull Flag| Structural ResistanceEvening Traders
Eid Mubarak to those who celebrate it!
Today’s Analysis – ETHBTC – breaking its neck line now forming a potential bull flag with the technical target associated at structural resistance.
Points to consider,
- Inverse H&S /Bull Flag pattern
- Structural resistance confluence
- Neckline support
- RSI above 50
- Stochastics momentum store up
- Bear volume declining
ETHBTC’s technical target is in confluence with the structural resistance. This level defines the range for ETHBTC as structural support is the established neck line.
The current 200 EMA has flipped support, must hold for the bull flag to play out.
The RSI is above 50, not officially oversold, there is strength in the current market. The stochastics is trading in the upper regions, can stay here for an extended period of time.
Bear volume nodes are below average, bulls need to see an influx out of the probable bull flag. The macro volume nodes are in synch with the head and shoulders pattern.
Overall, in my opinion, ETHBTC is likely to test structural resistance. A long trade can be validated on a retest of the neckline (conservative entry) or a break of the bull flag (aggressive entry) as both technical targets align with structural resistance.
What are your thoughts?
Please leave a like and comment,
And remember,
“It’s not whether you’re right or wrong that’s important, but how much money you make when you’re right and how much you lose when you‘re wrong.” -George Soros
