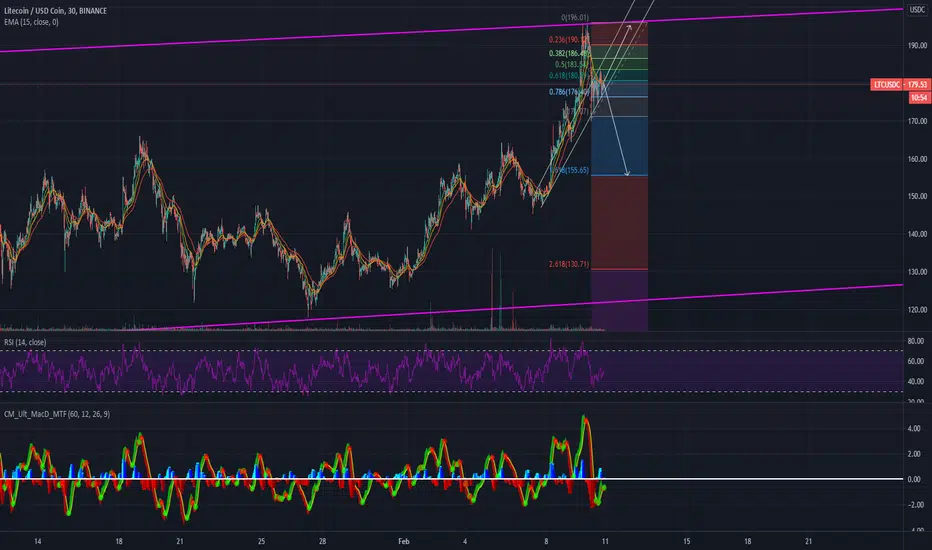
LiteCoin getting ready for a new ceiling test...This is on a 1month data range.
Following yesterday's test of the ceiling, we can observe a new base has been sate (the grey line) as well as a short term ceiling (the upper grey line) causing a channel pattern. The trend seems to be pointing out another test of the ceiling, and if the trend has enough momentum it will be able to cross its and maintain its new positions with a new all-time high of 200$. This move, if successful will be enough to bring LiteCoin to the 200$ mark by tomorrow.
In case the trend fails and is not able to break over the ceiling the price could plummet to 155$ and in the worst-case scenario (based on the overall longer-term trend depicted in the chart as the upper and lower purple lines) the price could drop to a price level of 125$-120$
Interesting stuff!!!
(THIS IS NOT A FINANCIAL ADVISE NOR TRADE ADVISE, I AM NOT A FINANCIAL ADVISOR NOR HOLD ANY TITLES AND LICENSES THAT WOULD SAY OTHERWISE; THAT WOULD CERTIFY MY EXPERTISE. I AM JUST A GUY LOOKING AT PRICE CHARTS, I AM NOT GUARANTEEING THE PRICE WILL FOLLOW MY PREDICTION OR ANYTHING, DO NOT TRADE BASED ON MY POST. YOU NEED TO DO DUE DILIGENCE WHEN INVESTING. THIS IS NOT A BUY, SELL OR HOLD RECOMMENDATION.)
As always: "Past performances do not guarantee future returns"
Technicaltrader
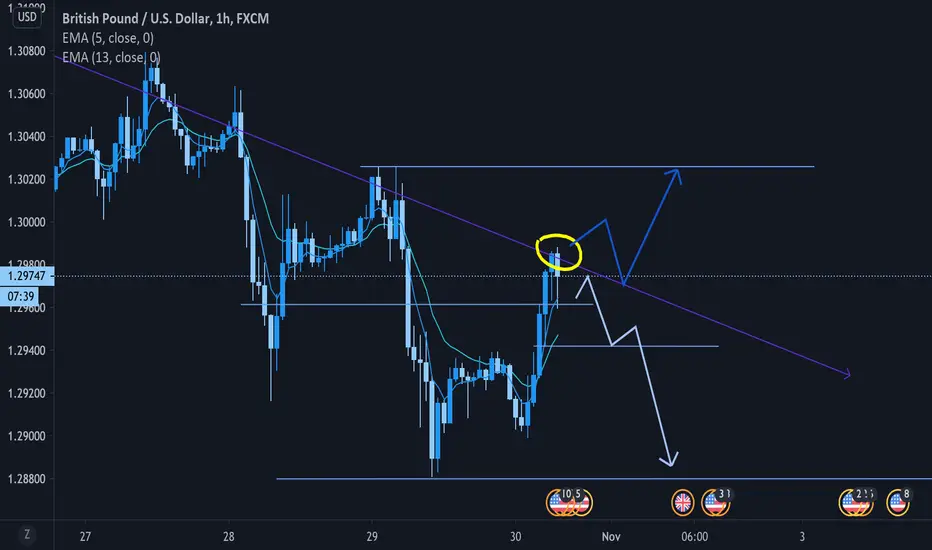
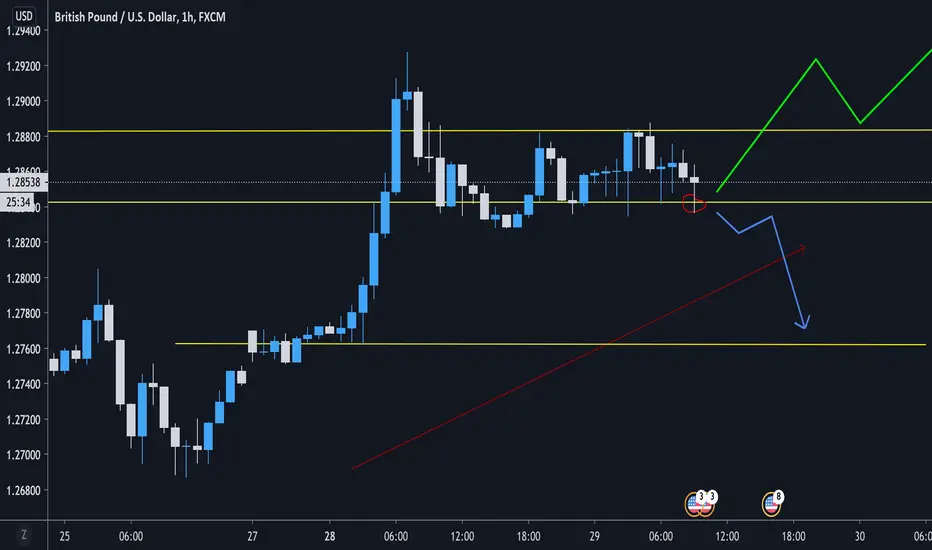
GBPUSD NY SESSIONHey peeps, im back with another ideaaaa. If you havent already, go ahead and follow me on trading view for some of that precision goodness within your trading. We strive for greatness around here. Lets get on with the idea shall we.
So we can see the london session pushed price way up and price recently hit the trendline resistance i have marked. Currently, i am waiting for price action at this trendline because if we end up breaking it, we will most definately have a surge upwards. However, NY session is known to reverese and we essentially created a high of the day in the London session. This would be a reason for me to be inclined to sell.
For a short position, ( I already scalped a short earlier this morning) i need to see a rejection at the trend line so i know to continue downwards and ride the pair to the low of the day essentially, taking out levels as we go.
If we want to long, we need price to break this trend line AND retest it because if it doesn't retest, price can easily fall back into the channel.
As we wait for price action, remember to trade safe, trade precise, and trade to WIN. Expect to WIN. See you guys in the next idea, thanks for stopping by! :)
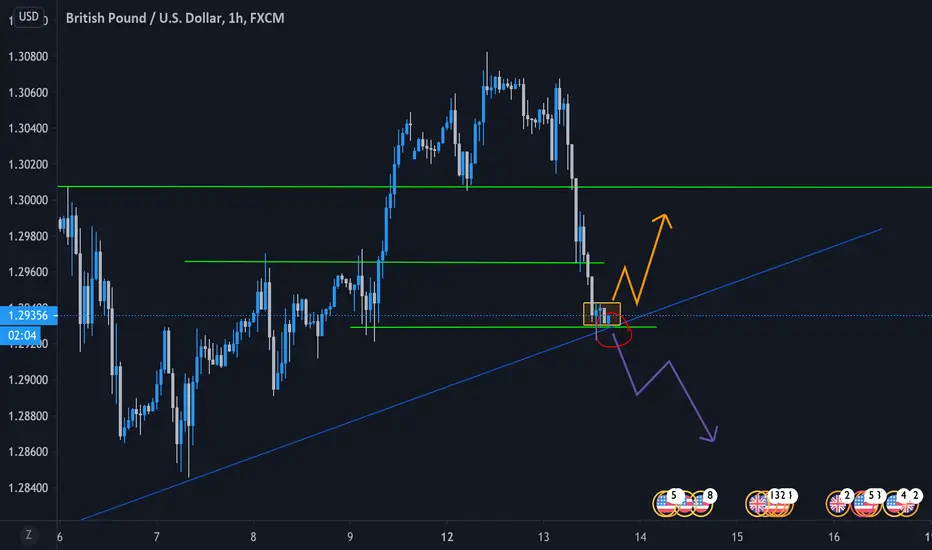
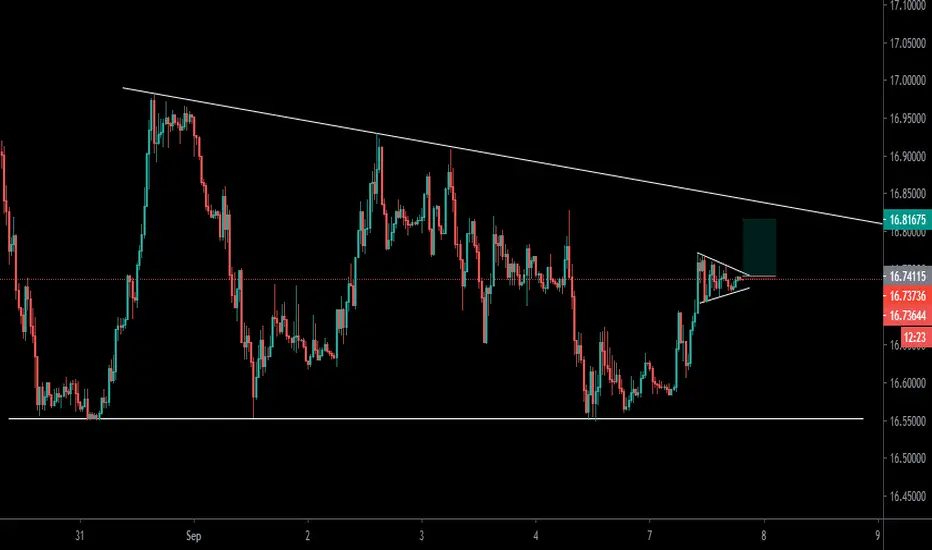
GBPUSD OUTLOOK (PRE TOKYO SESSION) Yoooo whats up my 20 viewers LOL, so as of right now im looking for potential setups for later on tonight. As we saw earlier, GBP saw a HUGE drop this morning, and i was not expecting it to do that at all so i missed out on some potential gains, but thats ok because here we are now. We are at the BOTTOM of an uptrend that GBP has established for the last week or so, and its fairly apparent.
What we are waiting for here is for price to either bounce off of the support (TREND LINE) and we can be safe continuing up, or we could see a break of the trend finally. IF this level is broken, we are going to see a massive drop i feel since price is actually pretty high on the DAILY chart.
As always, practice good risk management, but yea, if we bounce and go back up, use the orange path for guidance and if we end up breaking, please WAIT FOR CONFIRMATION before shorting, using the purple path as a guide for price direction
Trade safe, and remember, we are patient and accurate, we dont need to enter 100 setups, just 1 and take advantage of that ONE setup.
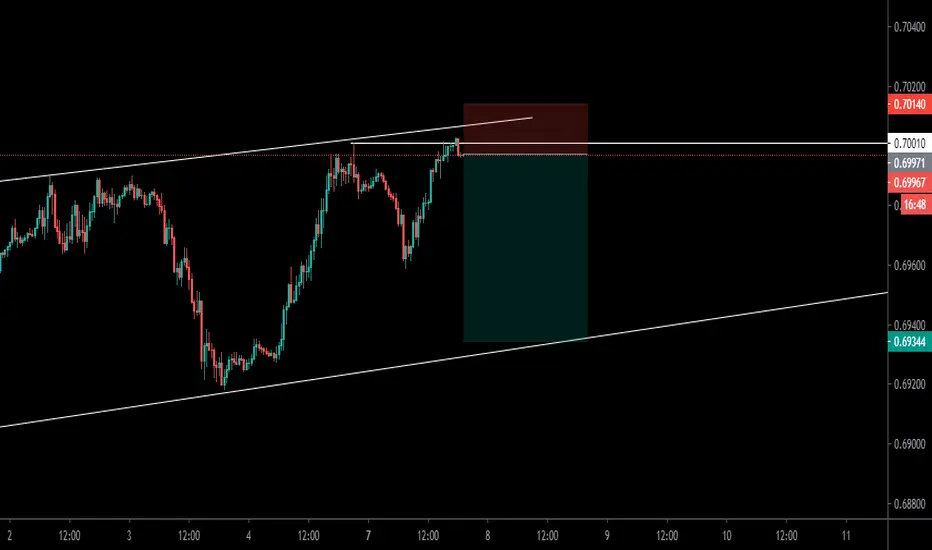
GBP USD PRE NY SESSION ANALYSIS (LONG?)Today is one of those days gbp is going to test your patience. I say that because in the beginning of the NY session we see a lot of rapid moves and reversals from the 2 levels i have marked on my chart. Lets dive in a bit:
So first off, we are going to establish the commanding trend right now and believe it or not, that trend is upwards transitioning to sideways. This is because we broke the downtrend with strong upwards movement. This being said allows us to be more favored towards longs ONLY IF we see supporting price action to our set ups.
LONGS: So if i want to enter a long, i need to see a bounce at the bottom level with strong upward momentum... it can be difficult to judge this rapid movement provided by the pair so im probably going to wait for a more structured move and let the pair loose a little bit of volatility to minimize risk.
If we bounce on bottom, we can potentially rise back to the resistance and hope to see a break of said resistance and ONLY then will entering a long be less risky.
SHORTS: As for entering shorts, if we see that price is pushing much harder to the downside we can prepare to enter a short, eventually hoping to break the support, retest it, OR have a strong bearish candle close below the support followed by another strong bearish candle.
Im essentially waiting for price to become more structured to take a position, although we can scalp the chart either direction in this price channel, it is far more risky to do that since this pair likes to make sharp moves especially at this time of the session.
Trade safe Snipers, Like the IDEA if it makes some sense or if you appreciate my analysis; i really appreciate the support guys :)

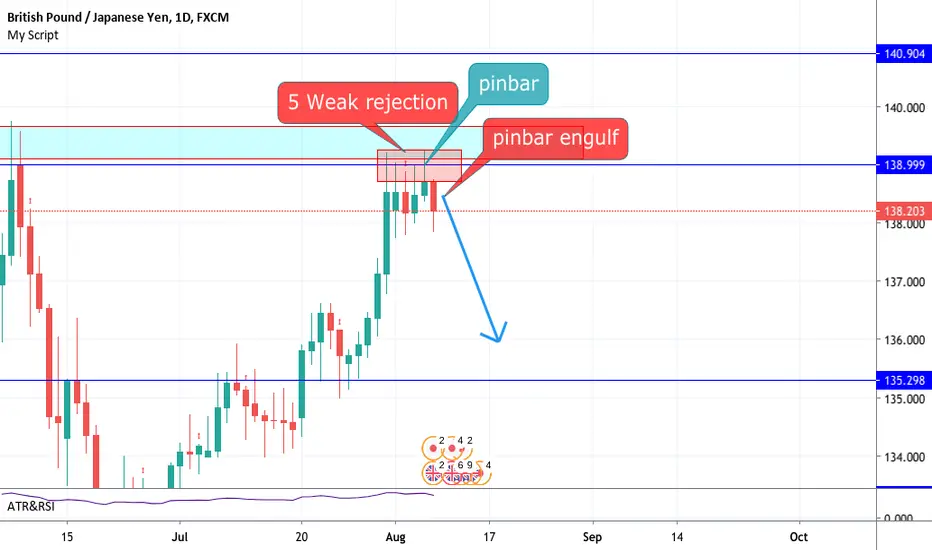
GBPJPY considering that the price is at a strong resistance with so much confirmation the price will be short
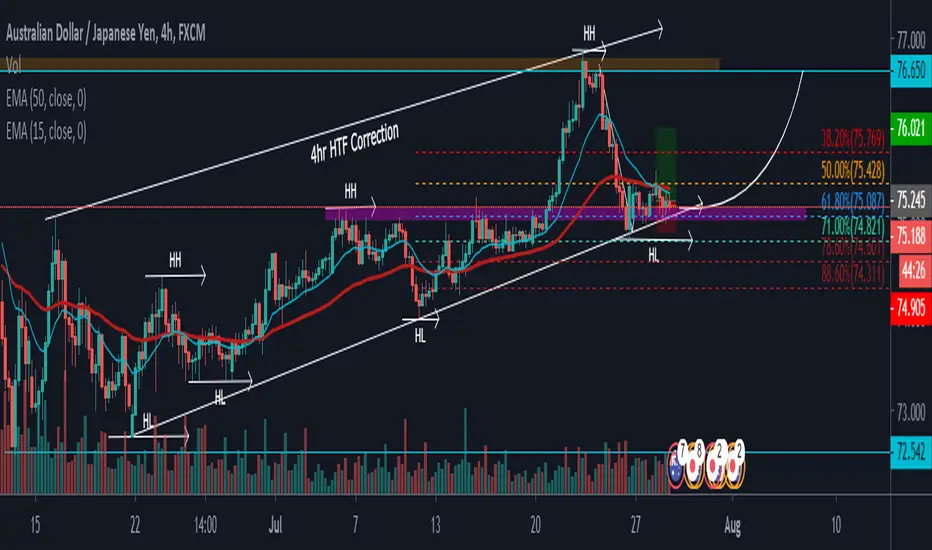
AUD/JPY - Potential BUY Price is still in an uptrend
Price Touched the lower trendline
At 15mins chart price created double bottom with long wick rejection
2nd candle taking out first candle
Price crossing 15mins EMA and finding support at previous resistance level
Price at support level which was previous resistance level
NIFTY 50 forecastHere the chart is forming a rising wedge pattern which is a bearish pattern that starts wide at the bottom and contracts when price moves up.

SPY MAJOR RESISTANCE LINE SPY is unstoppable, for whatever reason it may be. However, a major resistance level has been reached, and one might try their luck at shorting spy here.
No directional trades, options only. Be careful and measure your risk reward.
Like and subscribe for more trades.
Wish you all best of luck in your trading!

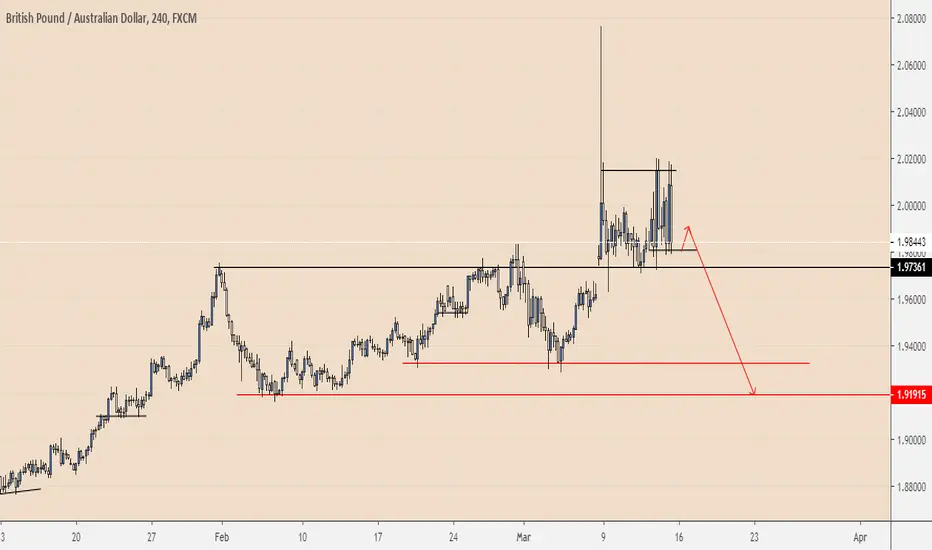
BEAR Momentum | GBPAUDWeekly - We notice a major exhaustion which mean the market is ready for the downside
Daily - Major Support ans Resistance is set with the market testing the Major Resistance and also made its High after the huge exhaustion with a bearish candle
4HR - The market created a major Resistance which is a Double Top, but on 1Hr we see it test that resistance 3 times. This rejection is a confirmation that the market cant break the resistance after the major exhaustion.
How to ente r - We look for a retrace and enter with Price Action using candle stick analysis or retracements
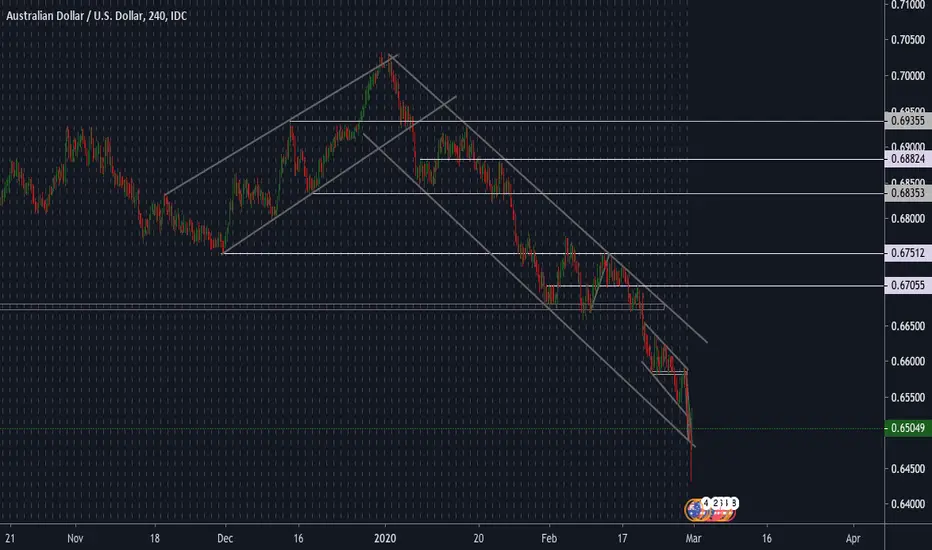
AUD/USD trade setup. I have identified a clear downtrend within a channel. Price has been in a 2 month long bearish descent from a 0.70253 high down to a 0.65090 price point.
My current view is that price will rise at market open, to complete a new high within the bearish channel. This pair is long overdue for a rice correction.
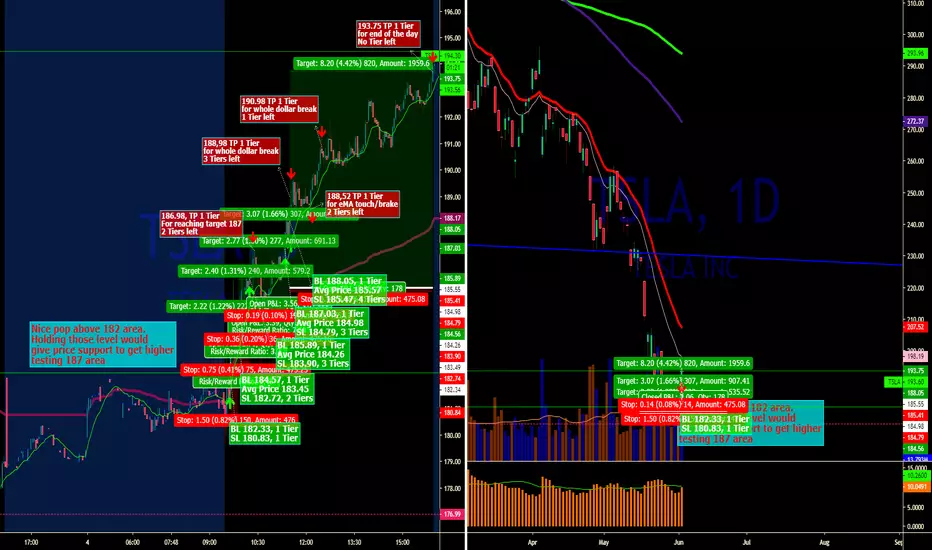
When a technical approach could be worth the try! Hi guys, It is clear that I only trade stocks that are covered by certain parameters and one of those is the presence of a Catalyst supporting the move. But for studying purposes I am back-testing stocks that are at important technical levels to interest quite some institutional traders. TSLA in pm made a nice pop testing the 182 area and that could mean that buyers finally stepped in. TSLA is the most sold stock of last weeks thus a consolidation on new levels such as 182 would be a great bullish signal. In addition the stock broke beautifully the PM highs thus a small entry to test the pm high would have worth the try. The move to 187 has been solid and offered breakouts opportunities to scale in and build up our position up to first take 187. Consolidated at 187 Price kept rising offering other scale in opportunities up to 190 next level of consolidation. Even if grinding slowly higher the stock got to a fantastic 193sh!
Simply amazing. A note deserves the volume profile! Simply perfect. At each pullback red volumes have never crossed up the previous main leading green ones and when that happened price respected supports and resistance.
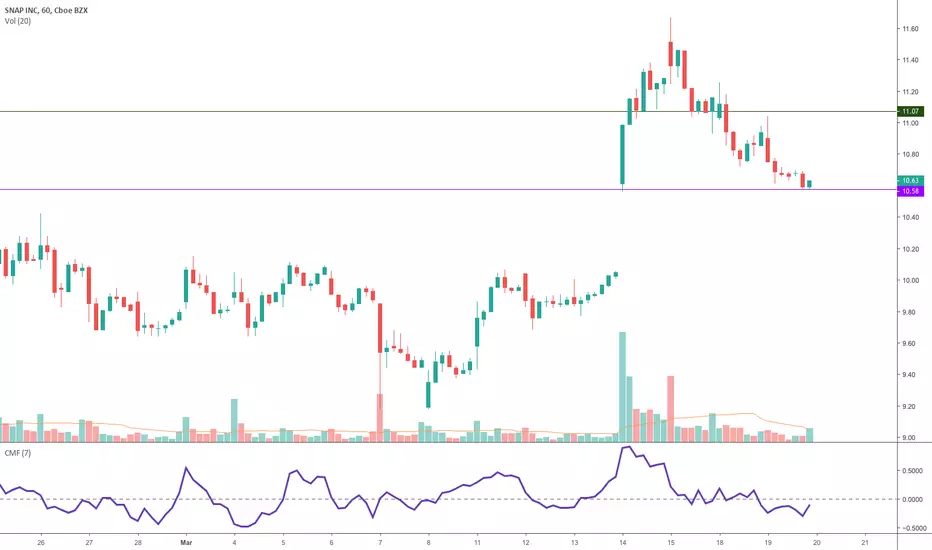
Waiting for a reversal on SNAP 1HNYSE:SNAP
Hammer on the 1H chart. SNAP is currently at the Gap's support level.
Let's see if we get a reversal
GBPAUD stucked ?Technically GBPAUD is ready for a big drop around 300+ pips. Can be depend on the fundamentals. Enter to the trade with a tight stop loss.
EURNZD Buy Set up My jungle strategy is set in place, I would wait for the break for confirmation of the continuation of the buy.

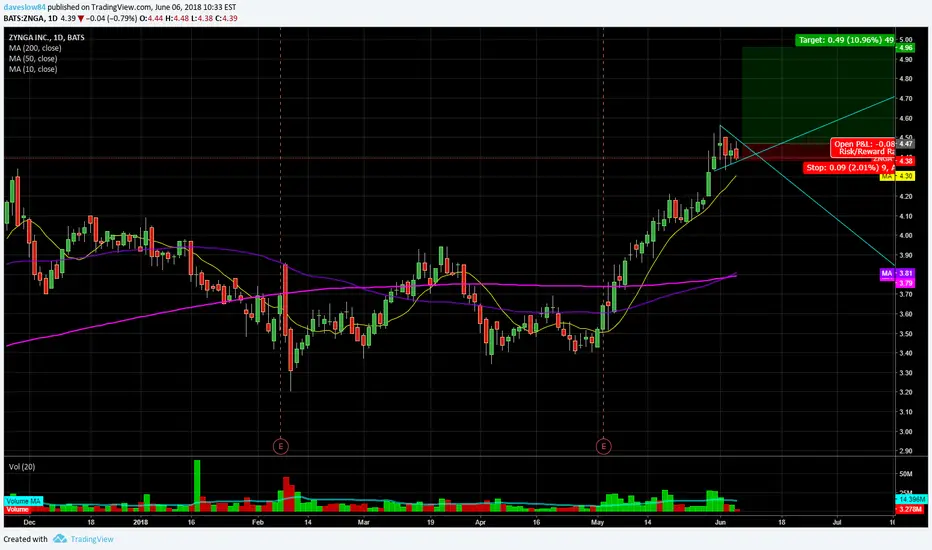
ZNGA blue sky's the limit?Great run and now consolidating at highs it hasn't visited in a loooong time. Moving averages have just crossed over into a bullish trend but still need some separation before truly showing a bullish longer term trend. The short term however is undoubtedly bullish. It has now formed a nice bull pole pattern... the question is, will Zynga go "BAZYNGA" or reject? I am bullishly biased in this case due to the trend and pattern but am not a fan of all time or long time highs...

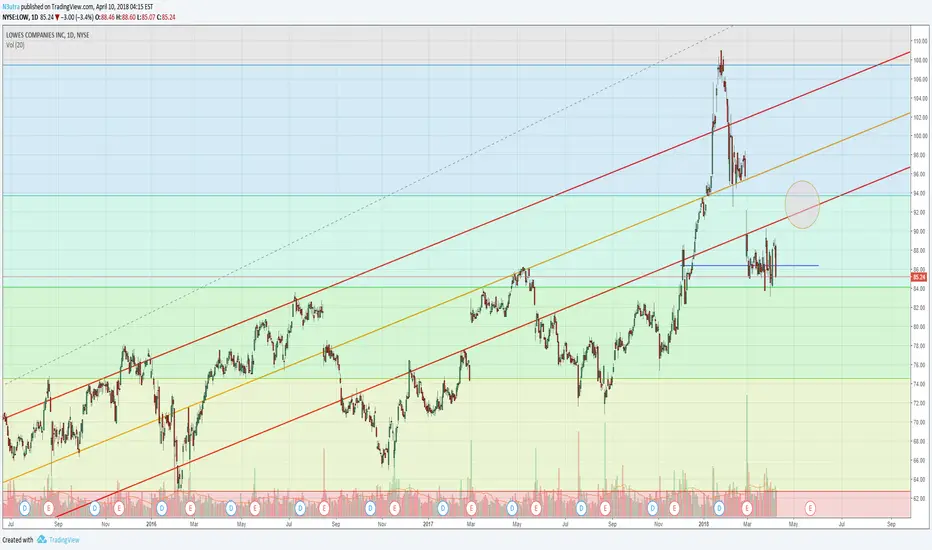
Tech Trade LOW on Positive Sentiment & Momentum ($90 PT)Lowes got way, way ahead of itself during the lofty valuation period of January this year. Now that it's fallen under the lowest part of the long, historical trend, it's an easy pickup as it can move up and back over its trend lines. $86.38 is a technical, average line that helps to identify point of accumulation, but only for the short sighted understanding of LOW as a stock. Above $90 is a clear sell line, but if you want to ride momentum and the sector up on whatever reason, $92 and in between is not unreasonable. Do NOT take this stock long hoping for the days of $105+. While Lowes does have some good initiatives with being Smart Home friendly and educational, we are currently not in a period where people are rushing out for home supplies because of proactive home projects, preventative maintenance (hurricanes) or rebuilding.
Make some quick cash off LOW and bow out after. Let it stabilize and find its legs again against its trends lines and then decide if the narrative makes sense moving forward long term. The spikes are there, momentum will make them greater.
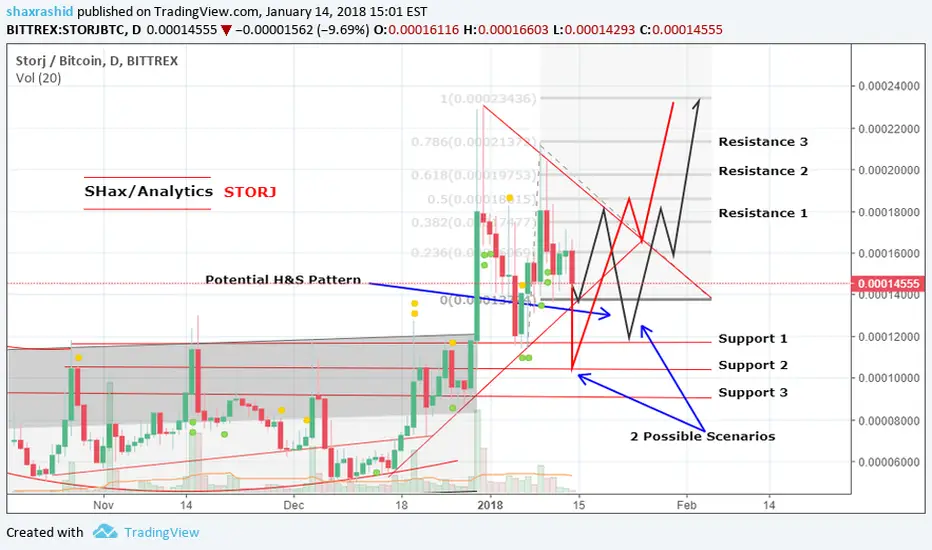
STORJ ForecastSTORJ has done well compared to most of the coins against major sell of weekend. But still it has room for some more
downfall. It has strong support on the down side which can keep the price in a certain range and stop it from free fall. It is making a possible Head and shoulder formation as well as an alternative pattern along side. This can be a quick swing trade as well so buying on any of the support levels can be profitable based on the current scenario. Bullish long term but remain cautious of buying above market price.
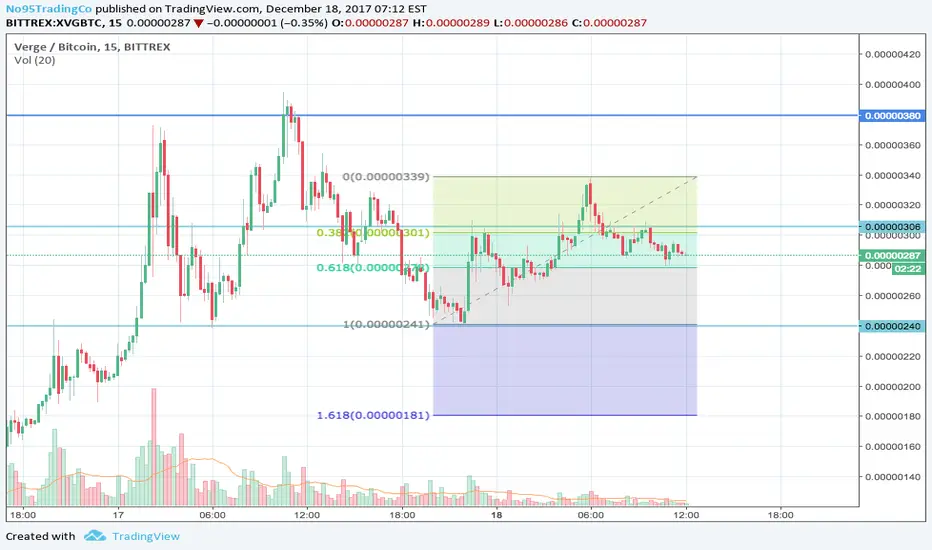
LONG ON $XVG VERGELooks Like Verge has found some support at the 280 or the 61.8 Fib retracement.
A move past the previous high at 337 should confirm the uptrend.
But hey it's crypto, anything can happen.
If the news of wrath comes out this week this should fire up confidence in this scare coin.
Stay Safe, Watch this space. Let me know your thoughts on XVG below.
***
“Frankly, I don’t see markets; I see risks, rewards, and money.” – Larry Hite