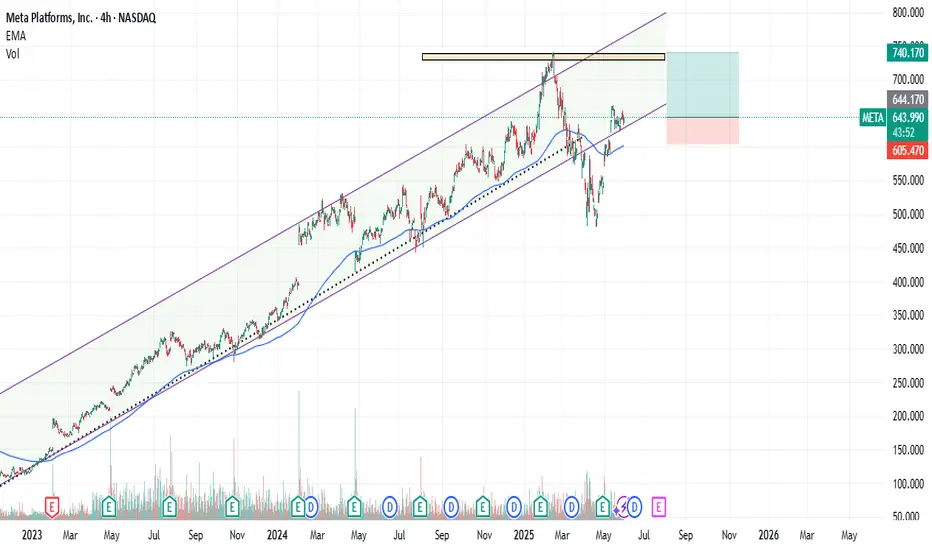
META : Old Peak can be TestedMeta platform has lost altitude from the channel it has formed since 2023, but has gained momentum and re-entered the channel. The possibility of testing the old peak contains a good RR rate.Of course, with a stop-loss close to the 200-period moving average.( Risk/Reward Ratio : 2.48)
Stop-Loss: 605.47
Target : 740.10
Techstocks
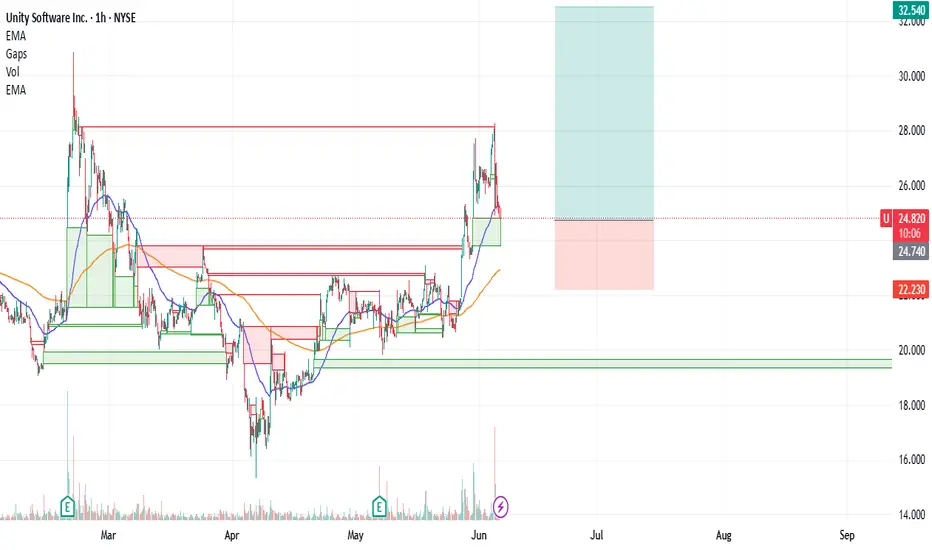
U : Long There were both good and bad developments for Unity.
While the joint project opportunity with BMW Group is very positive news,
Departure of the current CEO was negative news.
Technically, it is above the 50 and 200 period moving averages, and the 50 period ema is also above the 200 period ema.
A risk/reward ratio of 3.00 can be evaluated, with the Stop-Loss being close to the 200-period ema and the target price being targeted at the large gap closing value.(Small position size)
Entry : 24.76 - 24.81
Risk/Reward Ratio : 3.00
Stop-Loss : 22.23
Take Profit Level: 32.54
META Earnings Trade Setup — July 30 (AMC)
## 🧠 META Earnings Trade Setup — July 30 (AMC)
📈 **META (Meta Platforms Inc.)**
💥 **Confidence**: 85% Bullish
💡 **Play Type**: Pre-earnings call option
📊 **Fundamentals + Flow + Setup = High Conviction Swing**
---
### 📊 FUNDAMENTALS SNAPSHOT
✅ **Revenue Growth**: +16.1% YoY
✅ **Profit Margin**: 39.1%
✅ **Gross Margin**: 81.8%
📈 **8/8 EPS Beats** — Avg Surprise: +13%
🧠 **Digital Ad Rebound + AI Integration = Growth Engine**
🟢 **Score: 9/10**
📌 Bottom line: Elite execution + consistent guidance beats
---
### 🔥 OPTIONS FLOW CHECK
💰 **Call Walls**: \$720 / \$730
📈 **Call/Put Skew**: Bullish tilt
🔎 **IV Rank**: 0.65 — High enough for a move, not extreme
📈 **Market Expectation**: \~6% move
🟢 **Score: 8/10**
📌 Institutional flow leans long — smart money eyes upside
---
### 📉 TECHNICAL SETUP
📍 **Price**: \~\$700
📉 RSI: 34.34 → OVERSOLD
📉 20D MA: \$713.27 (near-term bounce target)
📌 Support: \$692.50 | Resistance: \$720
🟡 **Score: 7/10**
📌 Post-consolidation rebound setup into earnings
---
### 🌎 MACRO CONTEXT
💡 Growth + AI names in focus
📢 Communication Sector → Risk-On Rotation
📌 META riding digital ad/AI secular trends
🟢 **Score: 8/10**
📌 Macro tailwinds match company strengths
---
## 🎯 TRADE IDEA
**META 08/01 \$730 CALL**
💵 Entry: \$10.00
🎯 Target: \$30.00 (300% ROI)
🛑 Stop: \$5.00 (50% loss cap)
⏰ Entry: Pre-close on July 30 (AMC earnings)
📏 Size: 1 Contract (Risk \$1,000 max)
### ⚖️ Risk/Reward
* Max Risk: \$1,000
* Target Profit: \$3,000
* IV Crush Protection: **Exit within 2 hours post-earnings**
---
## 📌 WHY IT WORKS
✅ Meta beats 8 straight quarters
✅ Fundamentals elite
✅ Bullish options stack
✅ Oversold tech setup
⚠️ Risk? Always — but *structured speculation wins* 📐
---
📣 Tag someone who trades earnings like a sniper 🎯
\#META #EarningsPlay #OptionsTrading #IVCrush #CallOptions #TechStocks #AIStocks #TradingView #DigitalAds #SwingTrade #StructuredRisk
Li Auto (LI) – Gaining Speed as China’s EV PowerhouseCompany Snapshot:
Li Auto NASDAQ:LI is scaling rapidly in the Chinese EV market, combining expanding distribution, premium product strategy, and smart technology integration to capture high-value demand.
Key Catalysts:
Aggressive Expansion 🏙️
Now in 140+ cities, with strategic moves into lower-tier regions, Li Auto is boosting brand visibility and tapping into untapped demographics.
Premium Product Pipeline 🚙
New models like the MEGA MPV and upgraded L-Series SUVs are driving strong demand, lifting margins above 22%—a signal of its move upmarket.
Smart Tech Differentiation 🤖
Proprietary AI cockpits, voice command systems, and ADAS platforms elevate the customer experience, creating a clear competitive edge.
Execution at Scale 📈
With YTD deliveries surpassing 180,000, Li Auto is proving it can deliver both volume and quality—earning analyst upgrades and institutional backing.
Investment Outlook:
Bullish Entry Zone: Above $26.00–$27.00
Upside Target: $46.00–$47.00, fueled by premium positioning, tech innovation, and delivery momentum.
🔋 Li Auto is not just riding the EV wave—it’s leading it in China’s premium smart vehicle segment.
#LiAuto #EV #ChinaAutos #SmartCars #ADAS #AI #ElectricVehicles #TechStocks #PremiumEV #Mobility #InstitutionalInterest #GrowthStocks #LI

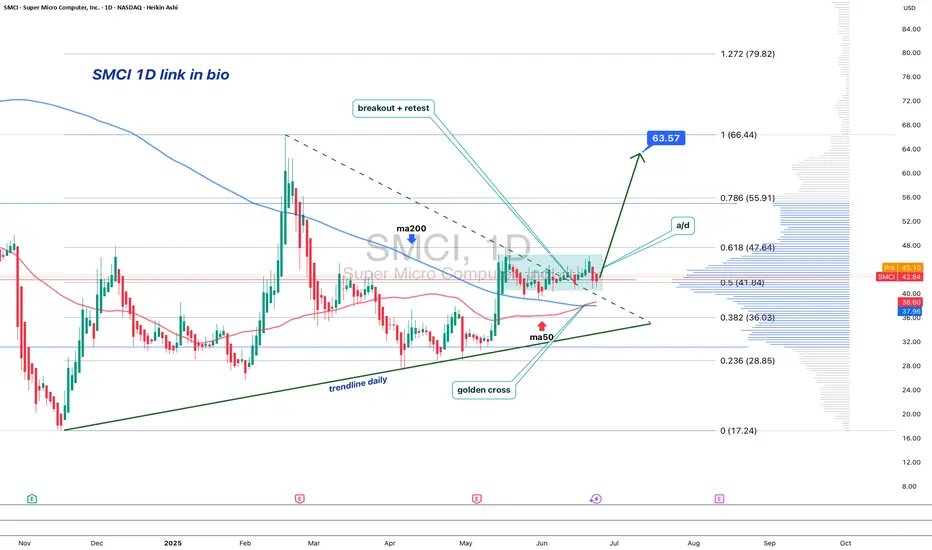
SMCI: When a chart says it’s time to reconnect with the AI hypeOn the daily chart, Super Micro Computer Inc. (SMCI) is showing a clean bullish setup. Price broke out of a descending trendline (green dashed), confirmed it with a retest, and is now consolidating above the breakout zone. The golden cross — where the MA50 crossed above the MA200 — confirms a long-term trend reversal.
Volume profile indicates strong accumulation near $41–43. The 0.5 Fibonacci level at $41.84 acted as support. Above the current range, there’s low volume resistance up to $63.57 (0.786), followed by $66.44 and a final extension target at $79.82 (1.272).
Fundamentals: SMCI is a leading server hardware manufacturer. Demand for their systems has soared with the explosion of AI infrastructure. The company maintains solid financials, with rising quarterly revenue and growing presence in the cloud sector. Institutional investors have been actively increasing their positions since late 2023 — a sign of strong long-term conviction.
Tactical plan:
— Entry: market $42–43
— Target 1: $55.91
— Target 2: $63.57
When technicals scream textbook breakout and fundamentals bring AI momentum to the table — it might just be one of the best late entries in the AI wave this summer.
Shopify (SHOP) – Powering the Next Wave of Global E-CommerceCompany Snapshot:
Shopify NASDAQ:SHOP continues to dominate as a leading commerce infrastructure provider, backed by record merchant adoption, a recurring revenue engine, and cutting-edge AI integration that enhances merchant capabilities.
Key Catalysts:
AI-Powered Ecosystem 🤖
From automated content creation to smart marketing tools, Shopify’s AI advancements are boosting merchant efficiency and making the platform indispensable for sellers.
Global Expansion 🌍
Shopify is scaling aggressively in Europe, Latin America, and Asia-Pacific, with localized services improving merchant onboarding and consumer reach.
Fulfillment Firepower via Deliverr 🚚
The Deliverr acquisition supercharges Shopify’s logistics network, enabling fast, reliable delivery that improves merchant retention and directly competes with Amazon.
Sticky, Scalable Revenue 💸
Its subscription-based model ensures high predictability, while growth in merchants and services lifts average revenue per user (ARPU).
Investment Outlook:
Bullish Entry Zone: Above $105.00–$107.00
Upside Target: $170.00–$175.00, powered by AI leverage, global scale, and logistics innovation.
🚀 Shopify is emerging not just as a storefront builder, but as a global commerce operating system.
#Shopify #Ecommerce #AI #DigitalRetail #GlobalExpansion #Deliverr #Fulfillment #TechStocks #SHOP #AmazonRival #ARPU #SaaS #GrowthStock #MerchantEconomy

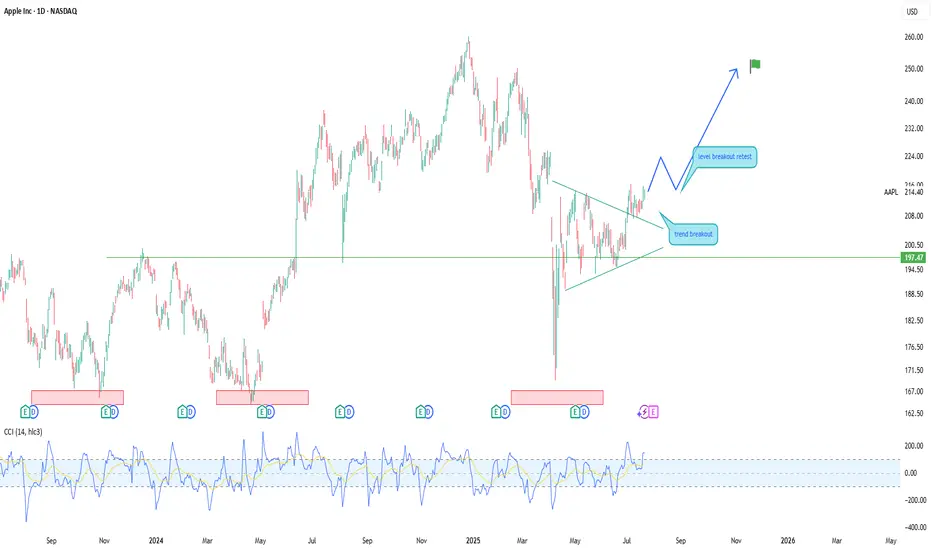
Apple (AAPL) — Expected 20% GrowthThe fundamental outlook for Apple stock remains positive: the upcoming fall presentation and anticipated AI-related announcements are driving bullish sentiment.
Technical picture:
The price has broken through a key trendline, signaling a shift in momentum toward growth.
Near-term target: a move toward the 225.0 level.
Next step: a possible pullback to 214.0 for a retest of the support level.
Long-term scenario: after the correction, I expect a rise toward 250.0, which could bring approximately 20% growth within 1–2 months.
This growth potential may coincide with Apple’s upcoming earnings report and further AI news.
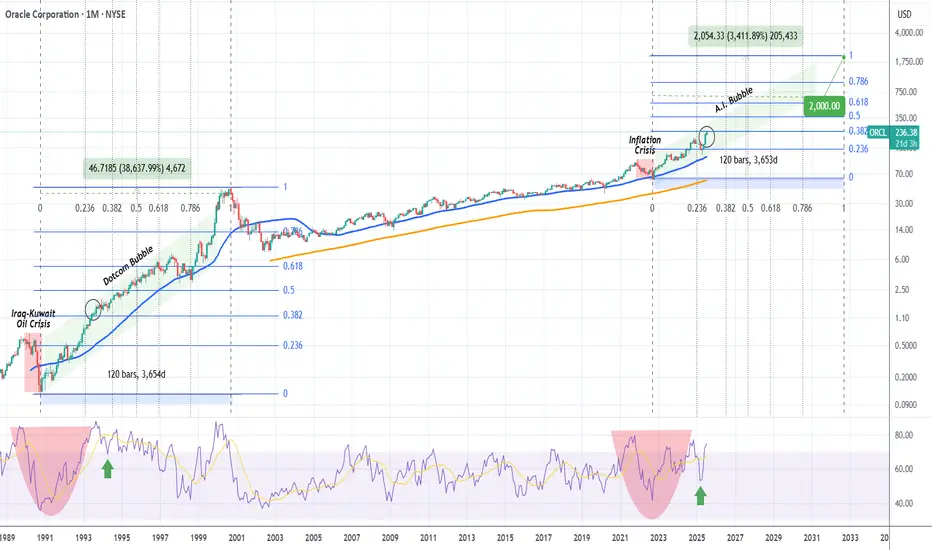
ORACLE Can you foresee it at $2000??Oracle (ORCL) is having perhaps the most dominant recovery from Trump's Tariff lows out of the high cap stocks, trading comfortable on new All Time Highs.
This is no surprise to us, as like we've mentioned countless times on our channel, we are currently at the start of the A.I. Bubble and heavy tech giants are expected to see massive gains until 2032, where we've calculated the end of this Bull Cycle and the start of a strong Bear.
As mentioned, this situation is extremely similar to the Dotcom Bubble of the 1990s. Of course Oracle is nearly impossible to repeat the +38637% gains of that Golden Decade after the 1990 Oil Crisis but in Fibonacci price and time terms, it can technically complete a +3411% rise and hit $2000 in the next 7 years.
If you have a long-term investor mindset like us, this is a must stock to buy and hold.
-------------------------------------------------------------------------------
** Please LIKE 👍, FOLLOW ✅, SHARE 🙌 and COMMENT ✍ if you enjoy this idea! Also share your ideas and charts in the comments section below! This is best way to keep it relevant, support us, keep the content here free and allow the idea to reach as many people as possible. **
-------------------------------------------------------------------------------
💸💸💸💸💸💸
👇 👇 👇 👇 👇 👇
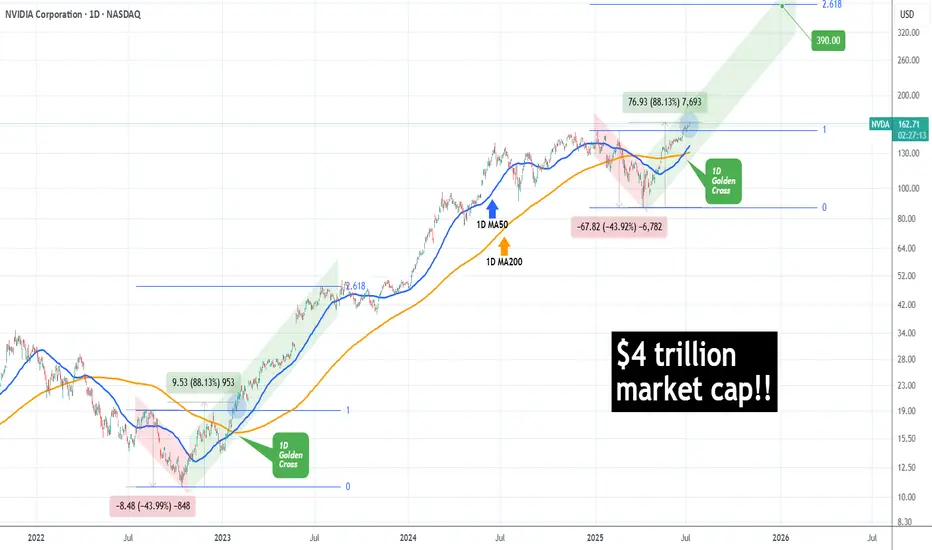
NVIDIA made history! First company with $4 trillion market cap!NVIDIA Corporation (NVDA) became today the first company in history to surpass a $4 trillion market value, as A.I. bulls extended the recent rally and pushed the price past the approximate $163.93 level needed to reach this market capitalization threshold.
The long-term trend on the 1D time-frame couldn't look more bullish. Coming off a 1D Golden Cross less than 2 weeks ago, the price has turned the 1D MA50 (blue trend-line) into Support and sits at +88.13% from the April 07 2025 Low.
This is the exact set-up that the market had when it was coming off the 2022 Inflation Crisis bottom (October 13 2022). As you can see, both fractals started with a -44% decline, bottomed and when they recovered by +88.13%, there were just past a 1D Golden Cross. In fact that Golden Cross (January 24 2023) was the last one before the current.
NVIDIA entered a Channel Up (green) on its recovery and for as long as the 1D MA50 was supporting, it peaked on the 2.618 Fibonacci extension before it pulled back below it.
If history repeats this pattern, we are looking at a potential peak around $390, which may indeed seem incredibly high at the moment, but as we pointed out on previous analyses, the market is in the early stages of the A.I. Bubble, similar to the Internet Bubble of the 1990s.
-------------------------------------------------------------------------------
** Please LIKE 👍, FOLLOW ✅, SHARE 🙌 and COMMENT ✍ if you enjoy this idea! Also share your ideas and charts in the comments section below! This is best way to keep it relevant, support us, keep the content here free and allow the idea to reach as many people as possible. **
-------------------------------------------------------------------------------
💸💸💸💸💸💸
👇 👇 👇 👇 👇 👇
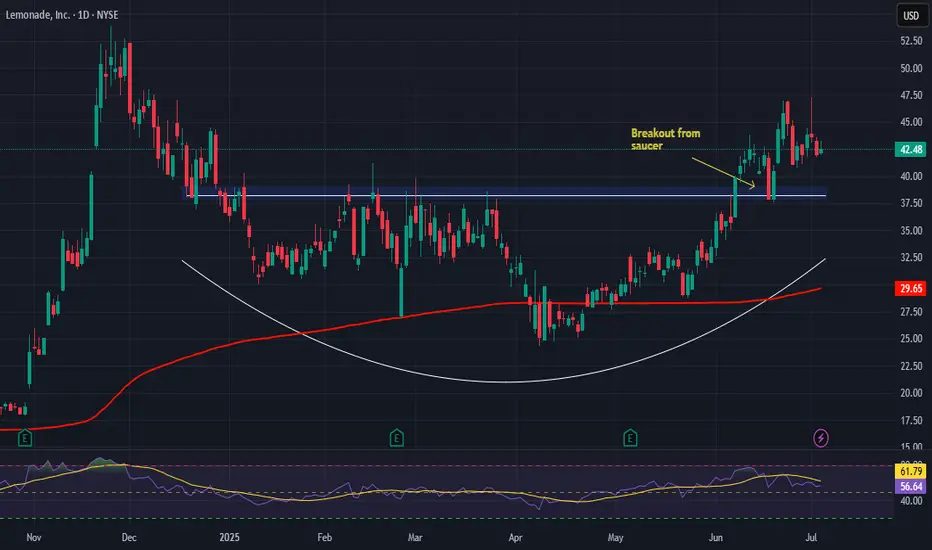
Lemonade, Inc. (LMND) – AI-Driven Disruption in InsuranceCompany Snapshot:
Lemonade NYSE:LMND is a tech-forward insurer reinventing traditional insurance through AI, data science, and a mobile-first experience across renters, homeowners, auto, pet, and life products.
Key Catalysts:
AI + OpenAI Integration 🚀
Collaborations with OpenAI are powering Lemonade’s RealTime API and AI voice agents, improving claims automation and customer support.
Enhances scalability and reduces overhead, key to long-term margin expansion.
Operational Resilience 🔥
Despite a $22M wildfire loss in California, Lemonade met Q1 guidance—thanks to robust reinsurance and effective risk management, underscoring operational maturity.
Auto Insurance Momentum 🚗
Car insurance was the top growth driver in Q1 2025, tapping into a multi-billion-dollar market where Lemonade still holds early-stage penetration.
AI-powered underwriting gives it an edge over legacy incumbents.
Investment Outlook:
Bullish Entry Zone: Above $38.00–$39.00
Upside Target: $65.00–$70.00, supported by AI innovation, product diversification, and scalable infrastructure.
🧠 Lemonade is not just selling insurance—it’s rewriting the rulebook on how it’s delivered, priced, and experienced.
#Lemonade #LMND #Insurtech #AIInsurance #OpenAI #DigitalTransformation #AutoInsurance #TechStocks #GrowthStocks #ClaimsAutomation #Reinsurance #Fintech #CustomerExperience
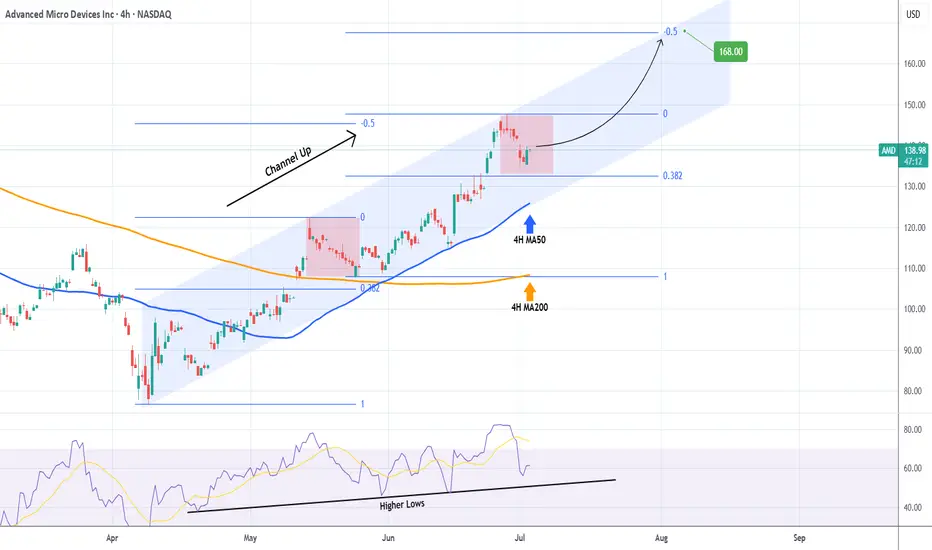
AMD Stable Channel Up targets $168.Advanced Micro Devices (AMD) has been trading within a Channel Up since the April 08 market bottom. With the 4H MA50 (blue trend-line) as its Support since April 30, the pattern has shown incredible consistency, with the past two pull-backs almost touching the 0.382 Fibonacci retracement level.
As a result, given also the fact that the 4H RSI is supported by the Higher Lows trend-line, we view the current bounce as a solid buy opportunity for the short-term. We are targeting $168, which is the -0.5 Fibonacci extension, the level that the previous Higher High reached.
-------------------------------------------------------------------------------
** Please LIKE 👍, FOLLOW ✅, SHARE 🙌 and COMMENT ✍ if you enjoy this idea! Also share your ideas and charts in the comments section below! This is best way to keep it relevant, support us, keep the content here free and allow the idea to reach as many people as possible. **
-------------------------------------------------------------------------------
💸💸💸💸💸💸
👇 👇 👇 👇 👇 👇
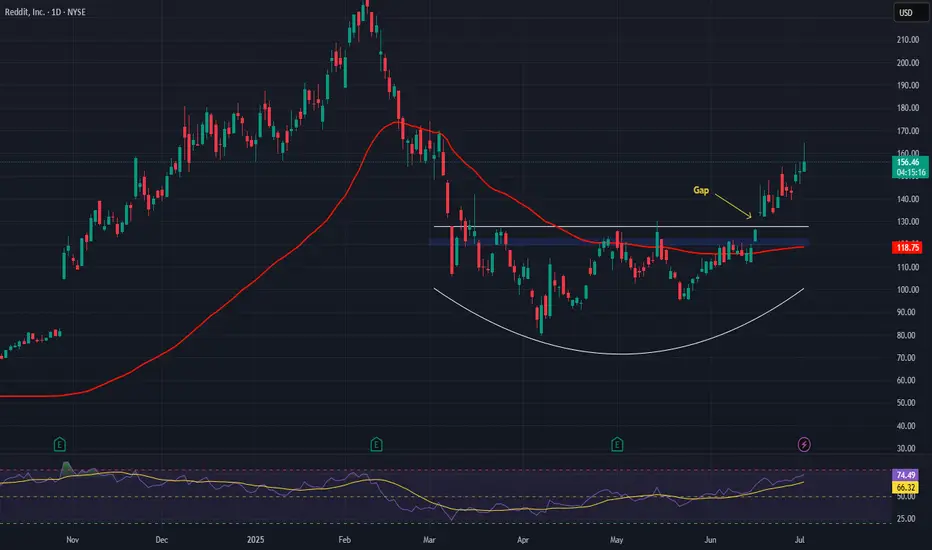
Reddit, Inc. (RDDT) – Global Growth & Monetization TailwindsCompany Snapshot:
Reddit NYSE:RDDT is a community-centric social media platform, uniquely positioned through user-generated content and authentic engagement. With over 100,000 active communities, Reddit is a magnet for targeted brand advertising and premium ad formats.
Key Catalysts:
AI-Driven International Expansion 🌐
Launched AI-powered post translation in 35+ countries, including Brazil, Germany, and Italy.
This unlocks new audiences and ad monetization in high-growth global markets.
High Margin Business Model 💸
Reported a 90.5% gross margin—highlighting Reddit’s asset-light infrastructure and operational efficiency.
Sets the stage for significant operating leverage as revenue scales.
Ad Revenue Acceleration 📊
Brands increasingly view Reddit as a premium ad environment, given its contextual targeting and deep user engagement.
Expanding tools for advertisers (e.g., Dynamic Product Ads) may enhance monetization per user.
Investment Outlook:
Bullish Entry Zone: Above $120.00–$122.00
Upside Target: $190.00–$195.00, supported by global reach, margin strength, and ad revenue tailwinds.
🧠 Reddit isn’t just a social platform—it’s a monetizable network of influence, fueled by community trust and scalable technology.
#Reddit #RDDT #SocialMediaStocks #AIExpansion #GrossMargin #AdTech #CommunityEngagement #TechStocks #Bullish #DigitalAds #UserGeneratedContent #GlobalGrowth #FreeCashFlow #GrowthStocks
GRAB — Breakout Confirmation and Strong Upside PotentialGrab Holdings (GRAB) is currently forming a promising technical setup supported by a breakout from long-term consolidation. After printing a strong low and breaking out of a multi-year range, the price action confirms a bullish reversal with clear structure.
Technical Analysis
– Trendline breakout and bullish market structure shift
– Price is consolidating above the breakout level, forming a continuation zone
– Valid entries: market execution above $4.50 or limit orders near $4.00 support
– First profit target: $6.60 (around 40% growth)
– Second target: $10.15 (over 100% from entry)
The setup suggests increasing bullish momentum. A clean consolidation above previous resistance strengthens the case for a breakout continuation toward $6.60 and potentially $10.15.
Fundamental Backdrop
Grab is a Southeast Asian tech leader operating across ride-hailing, food delivery, and digital payments. The company continues to reduce losses, improve margins, and expand its fintech arm. With rising digital adoption in the region and a shift toward profitability, GRAB is gaining investor attention. Its most recent earnings report showed improving revenue trends and narrowing net losses — a strong signal of long-term sustainability.
Conclusion
Grab Holdings presents a well-aligned opportunity from both a technical and fundamental perspective. With a clear structure, breakout confirmation, and fundamental turnaround, this setup fits both swing and midterm investment strategies. Risk management is still key — stops should be placed below consolidation lows or key structure levels.

Amd - This is just the beginning!Amd - NASDAQ:AMD - perfectly plays out:
(click chart above to see the in depth analysis👆🏻)
Despite the harsh drop of about -65% which we have been witnessing starting back in 2024, Amd remains bullish. Just three months ago, Amd retested a textbook confluence of support. We saw bullish confirmation, the bottom is in and Amd will rally significantly from here.
Levels to watch: $200, $300
Keep your long term vision!
Philip (BasicTrading)

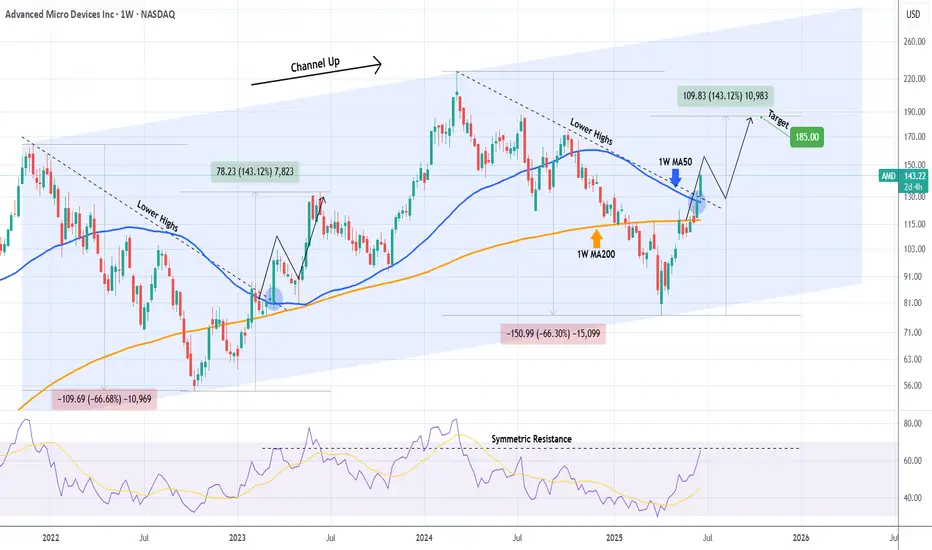
AMD Major Lower Highs/ 1W MA50 break-out.It was only 9 days ago (June 16, see chart below) when we called for a potential bullish break-out on Advanced Micro Devices (AMD) above the 1W MA50 (blue trend-line):
The break-out did happen, this 1W candle is already considerably above its 1W MA50 and based also on the level the 1W RSI is at right now, it may resemble more the March 13 2023 1W candle instead of the January 30 2023 as previously thought.
The reason is the major break-out of the All Time High (ATH) Lower Highs trend-line that came along with the 1W MA50. As you can see, it was on the March 13 2023 1W candle that AMD broke above that trend-line with the 1W RSI being on the same level (66.00) as today.
This candle formed a short-term Top, with the price initiating a 1.5 month pull-back that re-tested the 1W MA50 as Support and then moved on to complete the +143.12% Bullish Leg from the Channel Up bottom.
As a result, we can't rule out the first wave of short-term profit taking by next week. But a potential 1W MA50 test, will be another long-term buy entry in our view. Our $185.00 Target remains intact.
-------------------------------------------------------------------------------
** Please LIKE 👍, FOLLOW ✅, SHARE 🙌 and COMMENT ✍ if you enjoy this idea! Also share your ideas and charts in the comments section below! This is best way to keep it relevant, support us, keep the content here free and allow the idea to reach as many people as possible. **
-------------------------------------------------------------------------------
💸💸💸💸💸💸
👇 👇 👇 👇 👇 👇
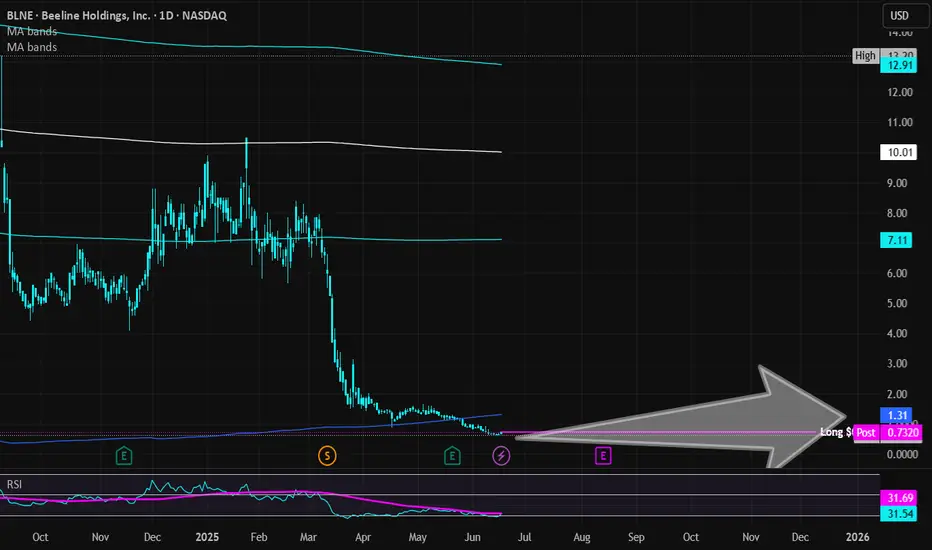
Beeline Holdings | BLNE | Long at $0.72**This is a VERY risky penny stock. Please do not invest if you are risk averse.**
Beeline Holdings NASDAQ:BLNE
Book value = $5.00-$6.00
Revenue past 12 months: $5.21 million (grew by 27.4% over the past year)
Debt-to-equity: 0.21x (low)
Insiders purchased almost $500k in shares in the past 6 months and volume increasing
6 million float, 1.96% short interest, 0.85 days to cover
This is purely a gamble play based on value and insider purchases. Thus, at $0.72, NASDAQ:BLNE is in a personal buy zone.
Targets:
$1.00
$1.25
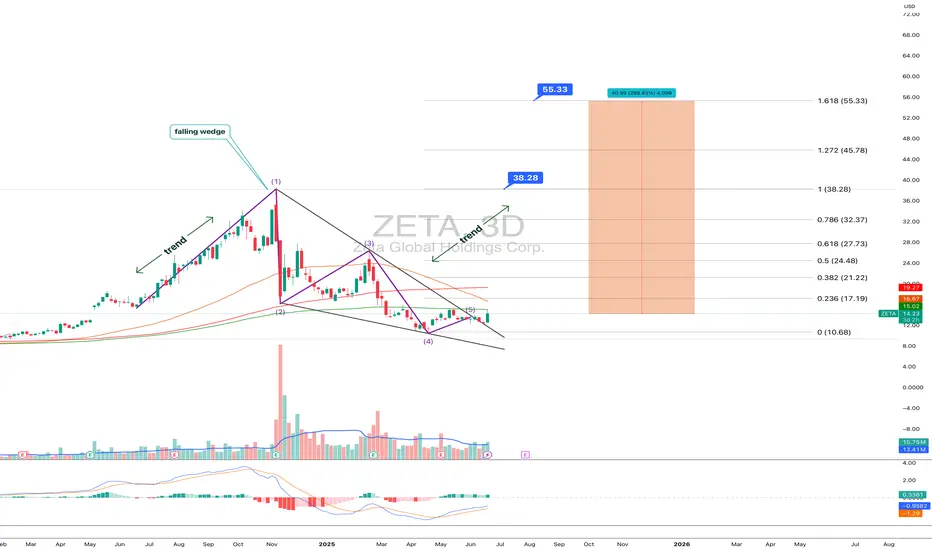
ZETA: when a wedge isn’t just a wedge — it’s a launchpadTechnically, this setup is textbook clean. Price completed the fifth wave within a falling wedge and instantly reacted with a bullish breakout. The expected breakdown didn’t happen — instead, buyers stepped in, confirmed by rising volume. All EMAs are compressed at the bottom of the structure, signaling a clear shift in momentum. The volume profile shows strong accumulation around $14, while the area above current levels is a vacuum — ideal conditions for acceleration.
The key resistance zone is $16.70–17.20 — former base highs and the 0.236 Fibonacci retracement. If price breaks this area with volume, the next stop is likely $24.48 (0.5 Fibo). Classical wedge targets land at $38.28 and $55.33 (1.272 and 1.618 extensions). If a trending leg begins, it could move fast — because there’s simply no supply overhead.
Fundamentals:
ZETA isn’t a profitable company yet, but it shows consistent revenue growth and aggressive expansion. Capitalization is rising, debt is manageable, and institutional interest has increased over recent quarters. In an environment where tech and AI are regaining momentum, ZETA could be a speculative second-tier breakout candidate.
Tactical plan:
— Entry: market or after a retest of $14.00–14.30
— First target: $17.20
— Main target: $24.48
— Continuation: $38.28+
— Stop: below $13.00 (bottom wedge boundary)
When the market prints a wedge like this and the crowd ignores it — that’s often the best trap setup. Only this time, it’s not for retail buyers. It’s for the shorts. Because when a falling wedge breaks to the upside with volume — it’s time to buckle up.
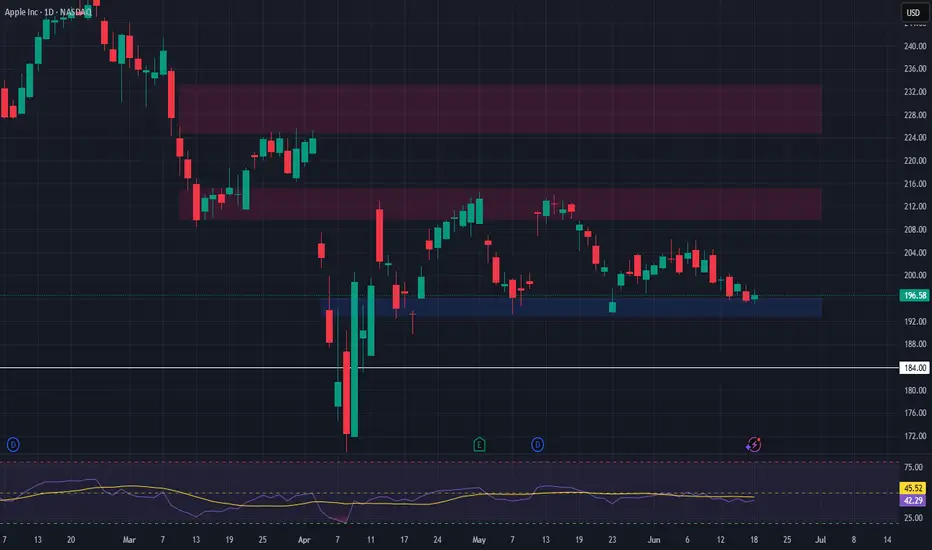
Apple Near Key Support — Long Setup DevelopingIntroduction:
Apple NASDAQ:AAPL is approaching a critical support zone that has consistently held over the past two months. As price retraces toward this level, it presents a potential long opportunity for traders looking to position ahead of the next bullish leg.
Technical Setup:
Support Zone: $193 – $196
This area has acted as a strong demand zone, providing multiple bounce points since April.
Price is now pulling back into this region, offering a potential entry for a long trade.
Trade Idea:
Entry: $193 – $196 (on confirmation of support holding)
Take Profit Targets:
First Target: $210 – $215
Second Target: $225 – $233
Stop Loss: Just below $184 (to protect against a breakdown from support)
#AAPL #Apple #Stocks #TechnicalAnalysis #SupportZone #LongSetup #TradingStrategy #NASDAQ #TechStocks #RiskReward
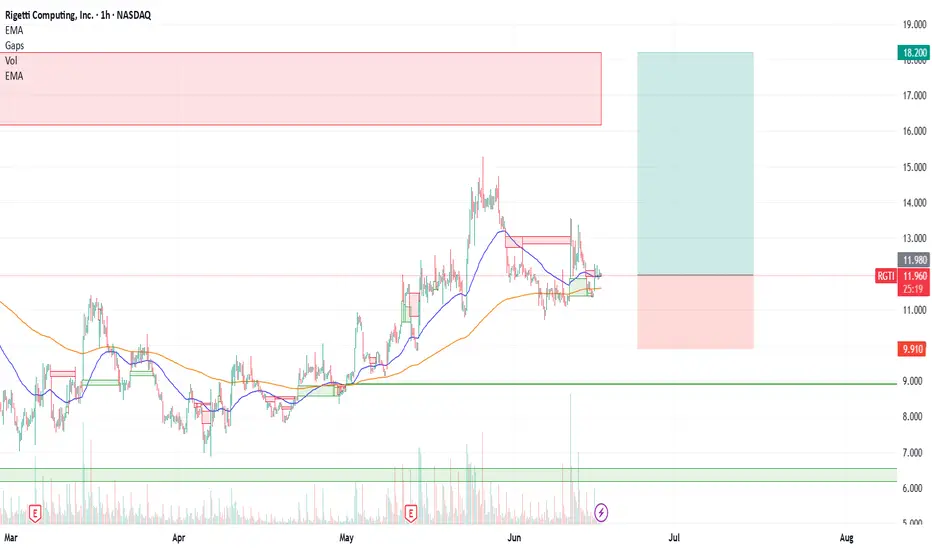
RGTI : First Long Position AreaNASDAQ listed Rigetti Computing Inc. stock is currently trading above the 50 and 200 period moving averages.
Once it gained momentum, it later lost it but its outlook is not weak at the moment.
Right now, if the Iran-Israel war uncertainty is overcome and if there is no bad news affecting the index, the gap may close.
Risk/Reward ratio of 3.00 is a very valuable ratio to try with small position amounts.
Risk/Reward Ratio : 3.00
Stop-Loss : 9.91
Take-Profit : 18.2
Regards.
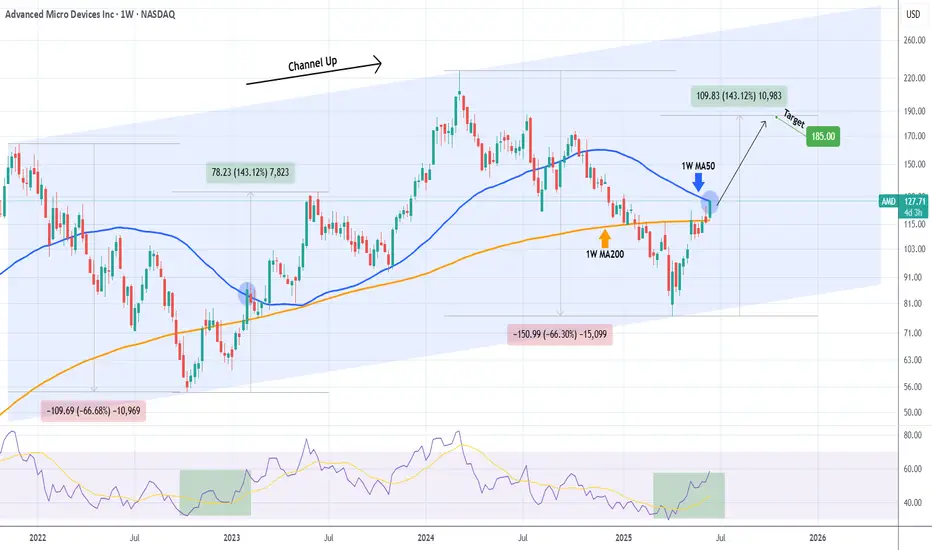
AMD First touch of 1W MA50 after 8 months!Advanced Micro Devices (AMD) hit today its 1W MA50 (blue trend-line) for the first time in almost 8 months (since October 28 2024). This is a crucial test as the las time this level broke as a Resistance following a Channel Up bottom rebound was on the week of January 30 2023.
When that happened, the Bullish Leg extended the upside to complete a +143.12% rise, before the next 1W MA50 pull-back.
As a result, if we close the week above the 1W MA50, we expect to see $185 before the end of the year.
-------------------------------------------------------------------------------
** Please LIKE 👍, FOLLOW ✅, SHARE 🙌 and COMMENT ✍ if you enjoy this idea! Also share your ideas and charts in the comments section below! This is best way to keep it relevant, support us, keep the content here free and allow the idea to reach as many people as possible. **
-------------------------------------------------------------------------------
💸💸💸💸💸💸
👇 👇 👇 👇 👇 👇
Amd - This starts the next +200% rally!Amd - NASDAQ:AMD - is preparing a major rally:
(click chart above to see the in depth analysis👆🏻)
It has - once again - not been unexpected at all that we now see a major reversal rally on Amd. After the harsh drop of about -65%, Amd retested a significant confluence of support and already created bullish confirmation. It is quite likely that this now starts the next bullrun.
Levels to watch: $100, $300
Keep your long term vision!
Philip (BasicTrading)

Microsoft - This might be the ultimate breakout!Microsoft - NASDAQ:MSFT - will break the all time high:
(click chart above to see the in depth analysis👆🏻)
If you wonder why Microsoft has been rallying +15% this month, market structure will give you an answer. In fact, the recent bullish break and retest was totally expected, and if we take into account the recent quite strong bullish behaviour, an all time high breakout will follow soon.
Levels to watch: $450
Keep your long term vision!
Philip (BasicTrading)

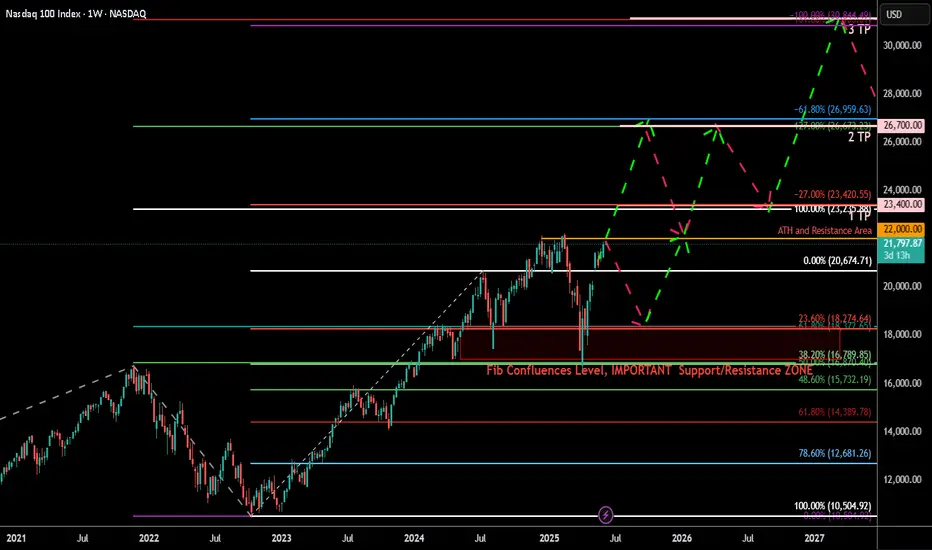
Nasdaq-100 (NDX) Weekly Chart 2025 Chart Context
This weekly timeframe analysis of the Nasdaq-100 Index (NDX) forms a key pillar in our 2025 macro analysis series. Following the breakout structure seen in TOTAL, TOTAL2, BTC.D, and US10Y, this chart utilizes 2 Fibonacci tools (1 trend-based extensions and 1 retracement) to project potential corrective and expansion scenarios.
Fibonacci Tools Used:
Fibonacci Retracement : Applies to the recent smaller swing to determine micro retracement zones and cluster supports.
0=20674 and 100=10504
Trend-Based Fibonacci Extension: Drawn using a three-leg structure (point A= 3993 to B=16724 to C10504) to forecast upside targets beyond ATH.
All take-profit (TP) levels: TP1 (~23,400), TP2 (~26,700), and TP3 (~30,344.49)—are located at confluence zones where Fibonacci levels from different tools align, reinforcing their validity and strength.
There is a 4TP above all the Visible TPs
Key price references:
0% retracement: ~20,674.71
Next Resistance ~23,400 (confluence of extensions and psychological resistance)
Projected TPs:
1TP=~23,400,
2TP=~26,700,
3TP=~30,344.49,
4TP=44000
Support/Resistance:
Red zone: ~16,700–18,300 (historical S/R and correction target and Fib Confluences)
Resistance zone: ~23,000–23,400 ,
22000(ATH area)
Key Technical Observations:
Fibonacci Retracement from ~20674 to ~15732 marks the initial corrective range.
Trend-Based Extensions forecast:
TP1 (~23,400): First breakout resistance
TP2 (~26,700): Medium-term expansion zone
TP3 (~30,344): Long-term target if macro tailwinds persist
Scenario Pathways:
Bullish Continuation: Breaks above ATH to reach TP2/TP3
Healthy Correction: Pullback to ~20,600 or deeper ~18,300 before resumption
Deep Correction: Revisits ~16,700 zone if macro environment deteriorates
Fundamental Context:
Tech Stocks & Economic Sentiment: NDX is often the first to move during liquidity expansions. Its performance signals risk-on behavior across global equity markets.
Rate Cuts in 2025: With anticipated Fed rate cuts, tech stocks are primed for inflows. Forward earnings valuations rise, justifying extended upside in high-beta tech.
AI Boom & Earnings Growth: Nasdaq is heavily weighted toward AI, cloud, and semiconductors—sectors expected to lead earnings surprises.
NDX Influence on Gold and Crypto
When NDX rallies:
Crypto: Risk appetite improves. Capital rotation flows into altcoins and layer-1 assets.
Bitcoin: Often sees parallel inflows, especially during strong tech rallies (e.g., 2020).
TOTAL & TOTAL3: Begin breakout patterns if NDX continues to surge.
Gold: May stall or correct as investors favor risk assets. However, gold still holds due to macro hedging and real yield pressures.
When NDX corrects:
Crypto: Volatility spikes. Altcoins bleed faster.
Bitcoin: Short-term dip but may decouple if viewed as digital gold.
Gold: Benefits from flight-to-safety behavior.
US10Y: Often reacts inversely to NDX moves—used for confirmation.
Search Highlights (2024–2025):
Institutions view NDX correction as signal to rotate into commodities (incl. gold).
Cross-market correlations show NDX peaks often precede crypto mini-rallies.
De-risking from NDX often triggers gold strength, especially in geopolitical or inflationary backdrops.
Bias & Strategy Implication
Primary Bias: Bullish
Expecting upside continuation to 26,700–30,000 zone
Multiple correction opportunities are present even during rally
Strategic Actions:
Monitor for correction to yellow/red zones for accumulation
Use NDX behavior as leading macro signal for crypto rotations
Watch resistance at 23,400 closely; breakout confirms trend extension
Time Horizon
Short-Term (1–2 months): Watch for breakout or correction to ~20,600–18,300
Mid-Term (3–6 months): Probable test of ~26,700
Long-Term (6–12 months): Potential expansion to ~30,344.49