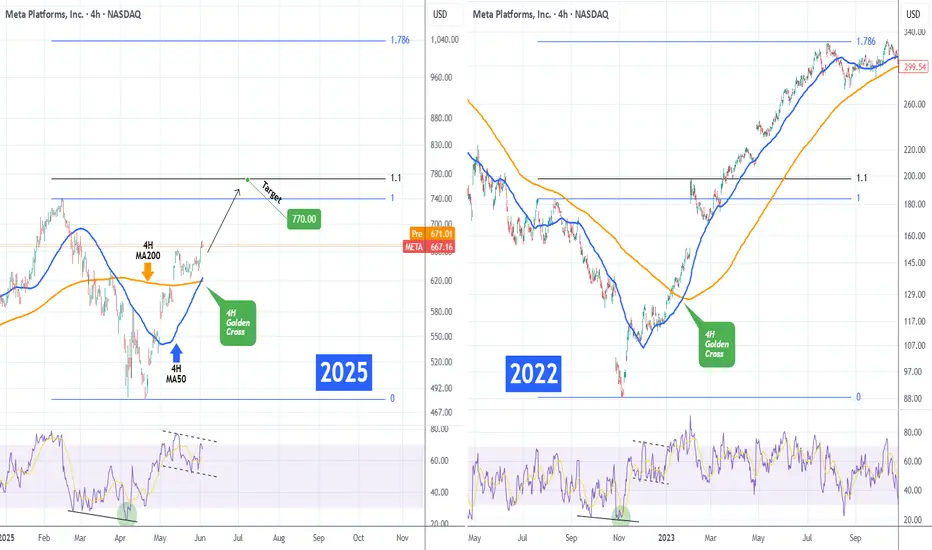
META Formed 1st 4H Golden Cross since Jan 2023!Meta Platforms (META) just completed yesterday its first 4H Golden in almost 2.5 years (since January 24 2023), flashing the strongest bullish signal it could at the moment!
Practically that Golden Cross was formed directly after the November 2022 bottom of the Inflation Crisis. The 4H RSI patterns between the two time periods are identical, so it is highly likely to see the market repeat that price action.
That suggests that the immediate Target on what seems to be an Inverse Head and Shoulders pattern is the 1.1 Fibonacci extension at $770.00, as META did on February 03 2023.
On the long-term and assuming a favorable macro environment (Trade Deals, Rate Cuts) it could reach the 1.786 Fibonacci extension a little over $1000, before the next major market correction.
-------------------------------------------------------------------------------
** Please LIKE 👍, FOLLOW ✅, SHARE 🙌 and COMMENT ✍ if you enjoy this idea! Also share your ideas and charts in the comments section below! This is best way to keep it relevant, support us, keep the content here free and allow the idea to reach as many people as possible. **
-------------------------------------------------------------------------------
💸💸💸💸💸💸
👇 👇 👇 👇 👇 👇
Techstocks
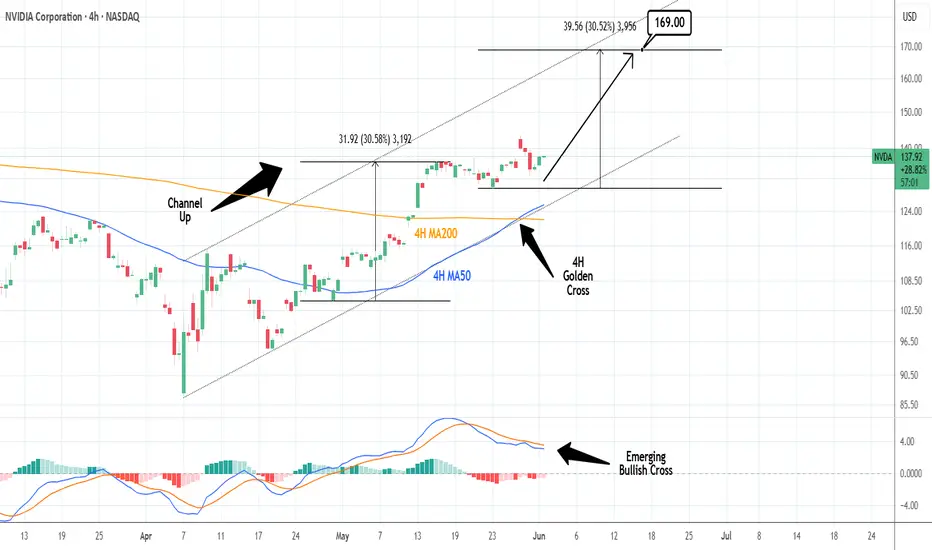
NVIDIA: 4H Golden Cross starting new Channel Up Leg.NVIDIA is bullish on its 1D technical outlook (RSI = 65.736, MACD = 5.860, ADX = 49.646) as it has established and maintained a Channel Up since its April bottom. The completion of a 4H Golden Cross has validated the start of the pattern's new bullish wave. The previous one topped at +30.58%. With the price already rebounding, we are bullish, aiming for a new HH (TP = 169.00).
See how our prior idea has worked out:
## If you like our free content follow our profile to get more daily ideas. ##
## Comments and likes are greatly appreciated. ##
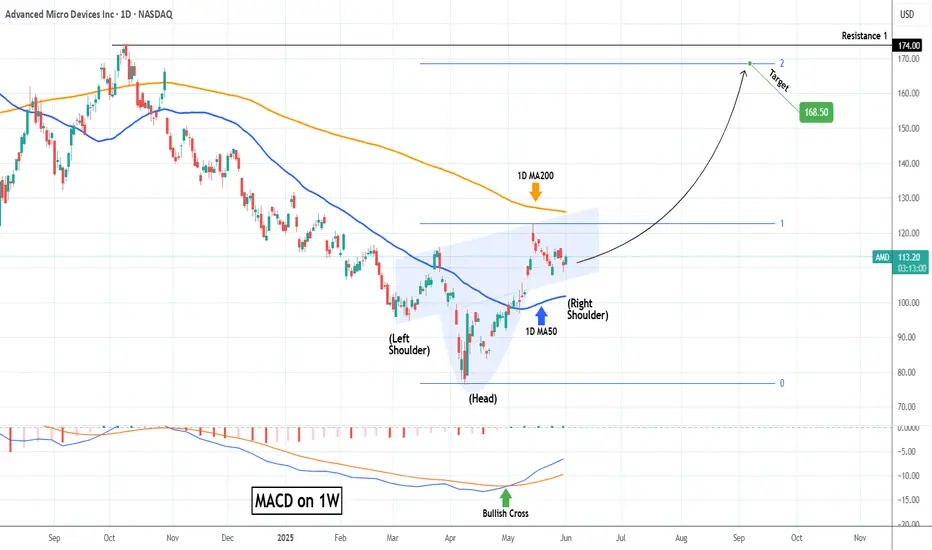
AMD Inverse Head and Shoulders waiting for massive break-out.Advanced Micro Devices (AMD) has entered a wide consolidation range within the 1D MA50 (blue trend-line) and 1D MA200 (orange trend-line) following the May 14 High. From a wider scale, this is technically seen as the Right Shoulder of an Inverse Head and Shoulders (IH&S) pattern.
This is generally a bullish reversal pattern and it is no coincidence that the Head was formed exactly on the market bottom (April 08). With the first long-term buy signal already given by the 1W MACD Bullish Cross, as long as the 1D MA50 holds, a break above the 1D MA200 would confirm the next rally phase.
Technically when the Right Shoulder break-outs take place, they target the pattern's 2.0 Fibonacci extension. That's now exactly at $168.50 and this is our medium-term Target.
-------------------------------------------------------------------------------
** Please LIKE 👍, FOLLOW ✅, SHARE 🙌 and COMMENT ✍ if you enjoy this idea! Also share your ideas and charts in the comments section below! This is best way to keep it relevant, support us, keep the content here free and allow the idea to reach as many people as possible. **
-------------------------------------------------------------------------------
💸💸💸💸💸💸
👇 👇 👇 👇 👇 👇
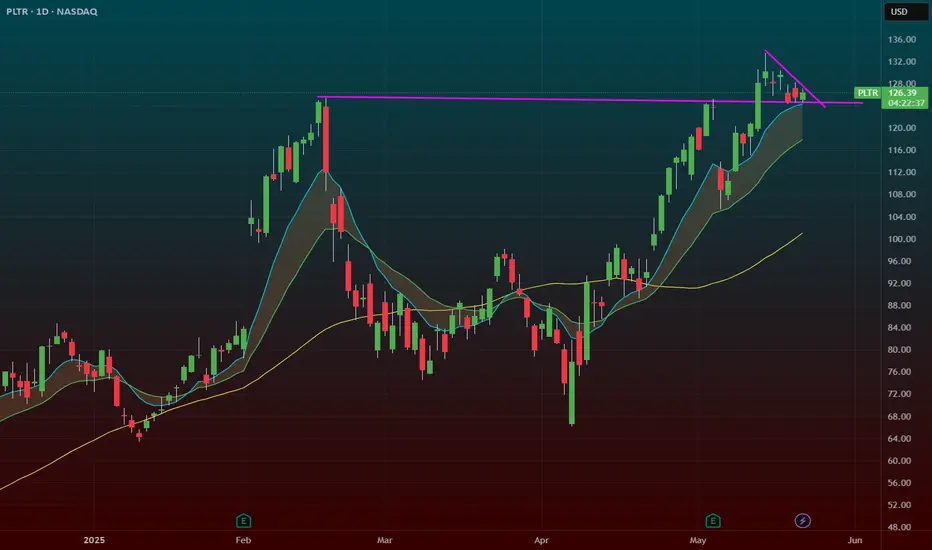
PLTR Flag Breakout Near ATHSmall catalyst today. It sold off on it at the open and quickly took out its opening range. Ive added a position here in the 126s with a stop at the low of the day.
We have a nice flag pattern. With a ton of support at the 20sma.
We have dipped now multiple times into the 9/20 zone (shaded area) and its been absorbing each time.
This is a bullish sign its had multiple times where it looked like it could sell off only to get bought up.

NVIDIA Massive Cup and Handle targets $200.NVIDIA Corporation (NVDA) is pulling back aggressively following yet another positive Earnings report, where they beat the estimates again but the market is reacting with selling. That has been a 'norm' in the past 12 months but even from a technical standpoint, the price reached the 143.60 Resistance level (made of the February 18 High), so profit taking is technically normal market behavior here.
On the longer term however, this Resistance test potentially forms the top f a very powerful pattern, the Cup and Handle (C&H). At the moment, the market has the support of both the 1D MA200 (orange trend-line) and 1D MA50 (blue trend-line) and the Handle, which has just started, has some room to safely consolidate for a while before the pattern break-out upwards.
Technically, C&H patterns reach their 2.0 Fibonacci extensions after the break-out, so our medium-term Target is set at $200.
Notice also the Bearish Divergence on the 1D RSI, which is similar to that of late October 2024. A break below the 1D MA50 risks the bullish structure on this pattern.
-------------------------------------------------------------------------------
** Please LIKE 👍, FOLLOW ✅, SHARE 🙌 and COMMENT ✍ if you enjoy this idea! Also share your ideas and charts in the comments section below! This is best way to keep it relevant, support us, keep the content here free and allow the idea to reach as many people as possible. **
-------------------------------------------------------------------------------
💸💸💸💸💸💸
👇 👇 👇 👇 👇 👇

NVDA: Ascending triangle break, bull flag on S/R retestHey traders! I'm back and once again, I've spent almost the whole evening (lol) trying to figure out the odd, strange price action we've seen from NASDAQ:NVDA over the past few weeks, and especially today!
As we all know (I assume), Nvidia failed to disappoint on earnings once again, and we saw a HUGE gap up overnight, as far as up to the $143 mark. However, we soon began to see a dip. That's fair, as traders will likely sell and take profit.
However, the dip became a larger dip, and Nvidia finished the day basically at 3.2%. But it seems that the pullback may been pretty healthy.
Because as you can see from the chart, Nvidia has been forming an ascending triangle ever since the 14th May. That was after the sweet run it had prior to that. It has tested the £136-137 area as a major resistance line ever since until finally, a strong earnings report sent Nvidia above the line.
After the gap up, throughout the day, the stock went into a controlled, composed downward channel which what we like to call, a bull flag. This is taking into consideration market hours, not extended hours. This bull flag is bullish in its own way, but it is also a sign of a retest of the $136-137 resistance zone. This is officially a support zone now.
A successful retest from this support zone will cause a bounce, especially from the support trendline, and likely send the stock towards $140+, possibly extending its reach to $150 if broader market strength (Nasdaq) continues.
On the contrary, a dip below the support line and a crash below the red support trendline, would likely send the stock lower to $133 as next support.
As long as Nvidia maintains $136-137, the bulls are in control.
Note: Not financial advice. Please do your DD.

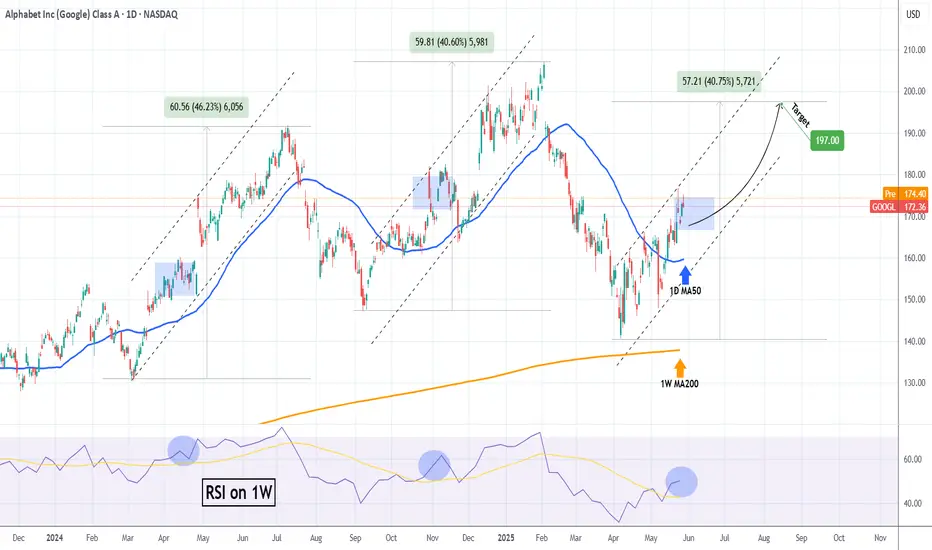
GOOGLE Repeating 2024 pattern and eyes $197.00Alphabet Inc. (GOOG) has established a Channel Up pattern since the (near) 1W MA200 (orange trend-line) rebound. With the 1D MA50 (blue trend-line) now acting as a Support, this pattern resembles the Channel Up formations that emerged in 2024.
Both in terms of 1W RSI and pure price action alike, we are in a similar consolidation level as November and April 2024. Both patterns peaked after similar rallies (+40.60% and +46.23% respectively), so the minimum Target we are expecting on the medium-term is $197.00.
-------------------------------------------------------------------------------
** Please LIKE 👍, FOLLOW ✅, SHARE 🙌 and COMMENT ✍ if you enjoy this idea! Also share your ideas and charts in the comments section below! This is best way to keep it relevant, support us, keep the content here free and allow the idea to reach as many people as possible. **
-------------------------------------------------------------------------------
💸💸💸💸💸💸
👇 👇 👇 👇 👇 👇
AMAZON eyes $255 on the 3rd such buy signal in 18 months!AMAZON Inc. (AMZN) has been trading within a 18-month Bullish Megaphone pattern whose latest bottom was on the April 07 2025 Low. Since then, the pattern has started its new Bullish Leg, which has been confirmed by the break-out above its 1D MA50 (blue trend-line) and the 1W RSI's above its MA.
The previous two Bullish Legs hit at least their 3.5 Fibonacci extension levels and the 2nd Bullish was +30% more than the 1st. If the stock achieves a +60% gain from its April bottom again, it will be almost exactly on its 3.5 Fib ext.
As a result, we believe that a $255 Target (on the 3.5 Fib), is more than realistic to be achieved by September.
-------------------------------------------------------------------------------
** Please LIKE 👍, FOLLOW ✅, SHARE 🙌 and COMMENT ✍ if you enjoy this idea! Also share your ideas and charts in the comments section below! This is best way to keep it relevant, support us, keep the content here free and allow the idea to reach as many people as possible. **
-------------------------------------------------------------------------------
💸💸💸💸💸💸
👇 👇 👇 👇 👇 👇

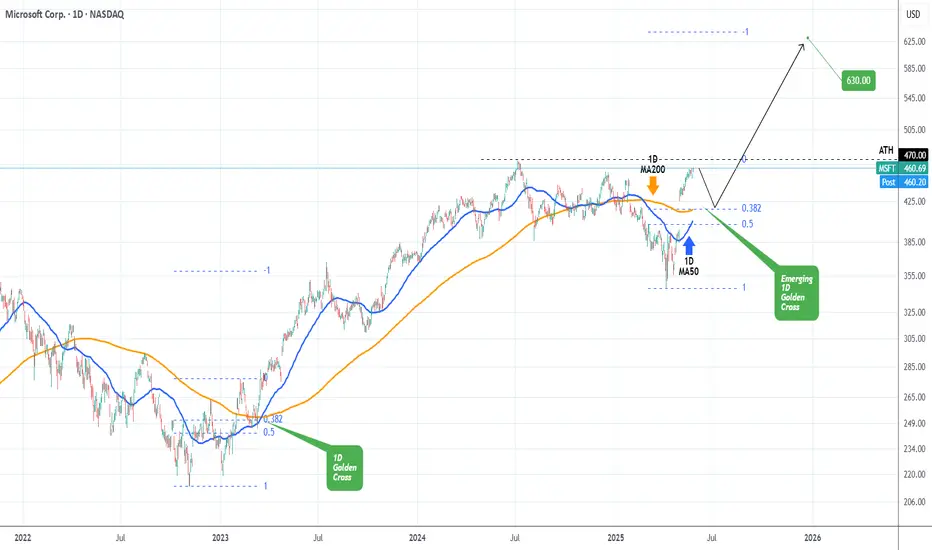
MICROSOFT Correction ahead of 1st 1D Golden Cross in 2 years?Microsoft (MSFT) is just below the $470 All Time High (ATH) and last technical Resistance, following the remarkable rally on the April 07 2025 bottom.
By the first week of June, it should technically form a 1D Golden Cross, which will be its first in more than 2 years (since March 17 2025). That Golden Cross was formed just after the price pulled-back on the 0.382 - 0.5 Fibonacci retracement Zone, finding support on its 1D MA50 (blue trend-line) and rebounding.
As a result, it is quite possible to see a short-term correction to at least $420 before the 1D Golden Cross restores the bullish sentiment. That previous structure eventually hit the -1.0 Fibonacci extension, before the next 1D MA50 test. We therefore expect to see $630 in 2025 before a 1D MA50 correction again.
-------------------------------------------------------------------------------
** Please LIKE 👍, FOLLOW ✅, SHARE 🙌 and COMMENT ✍ if you enjoy this idea! Also share your ideas and charts in the comments section below! This is best way to keep it relevant, support us, keep the content here free and allow the idea to reach as many people as possible. **
-------------------------------------------------------------------------------
💸💸💸💸💸💸
👇 👇 👇 👇 👇 👇
Equity Research Flash – Hexaware Technologies Ltd.CMP: ₹722.35 | Bullish Momentum Post Trend Reversal
HEXT shows a bullish breakout from a falling trendline, with RSI near 60 and strong volume uptick. The price reclaimed the 0.5 Fibonacci level, eyeing next targets at ₹749.85 (0.618) and ₹793.35 (0.786). Fundamentally strong with robust revenue growth, improving ROCE (26.4%), and low debt. A move above ₹750 could trigger further upside. Accumulate on dips with SL at ₹688.
Recommendation: Positive | Buy on Dips Near ₹700
For Education Purpose only

APPLE Down -4% premarket on Trump's 25% Tariff. Buy opportunity?Apple Inc. (AAPL) is down -4% on pre-market trading following a warning by U.S. President Donald Trump that the company would have to pay a 25% tariff if phones sold in the U.S. were not made within its borders.
Along with a proposed 50% Tariff on goods from the European Union starting on June 01, these news have inflicted fear again in the markets following 6 weeks of a relief rebound on trade deal talks.
So are these announcements a dip buy opportunity for Apple or round 2 of correction?
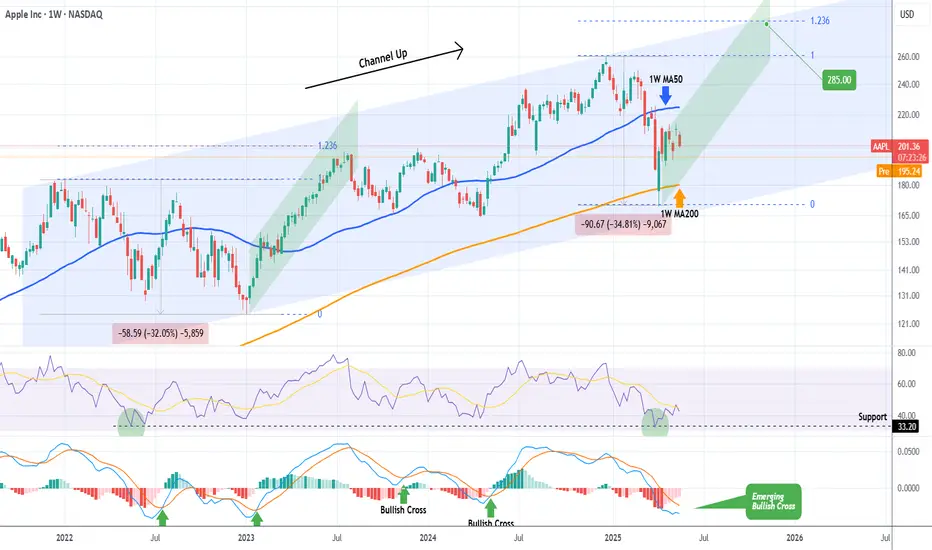
Based on the stock's long-term pattern, which is a Channel Up, the recent rebound on the 1W MA200 (orange trend-line) is technically the start of its 2nd Bullish Leg. With the Bearish Legs having similar declines (-35% and -32% respectively), we can expect the Bullish Legs to have a proportional rise as well.
On top of that, the 1W RSI rebounded on its multi-year Support, while the 1W MACD is about to form a Bullish Cross.
As a result, since the 2023 Bullish Leg that was complete on July 17 2023 almost touched the 1.236 Fibonacci extension, we expect the price to disregard the news and continue rising up to the new 1.236 Fib and target $285.00.
-------------------------------------------------------------------------------
** Please LIKE 👍, FOLLOW ✅, SHARE 🙌 and COMMENT ✍ if you enjoy this idea! Also share your ideas and charts in the comments section below! This is best way to keep it relevant, support us, keep the content here free and allow the idea to reach as many people as possible. **
-------------------------------------------------------------------------------
💸💸💸💸💸💸
👇 👇 👇 👇 👇 👇
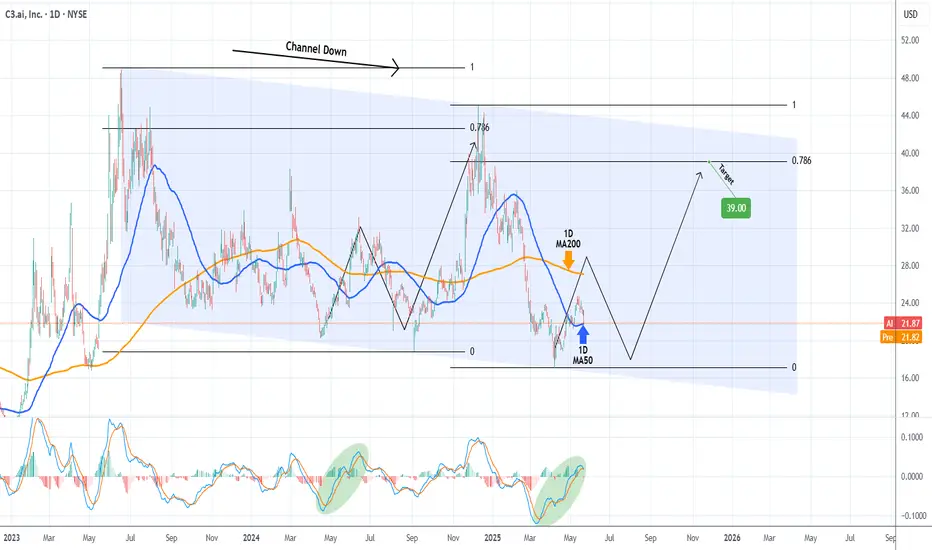
C3.AI has bottomed and is targeting $39.00C3.ai (AI) has been trading within a Channel Down pattern since the June 16 2023 High and right now is testing its 1D MA50 (blue trend-line) as Support, following a bottom (Lower Lows) rebound on April 08 2025.
This is technically the start of its new Bullish Leg, even though based on May - August 2024, it may be delayed. On the long-term though, our Target will be the 0.786 Fibonacci retracement level at $39.00.
-------------------------------------------------------------------------------
** Please LIKE 👍, FOLLOW ✅, SHARE 🙌 and COMMENT ✍ if you enjoy this idea! Also share your ideas and charts in the comments section below! This is best way to keep it relevant, support us, keep the content here free and allow the idea to reach as many people as possible. **
-------------------------------------------------------------------------------
💸💸💸💸💸💸
👇 👇 👇 👇 👇 👇
PLTR – Flag Breakout Above All-Time HighsPalantir is printing a bullish flag pattern right above its all-time highs — this is a textbook continuation setup that often leads to explosive upside.
🔹 After a strong breakout to ATHs, NASDAQ:PLTR has been consolidating in a tight range — a healthy pause.
🔹 Flags that form above prior resistance often act as launchpads when volume comes in.
🔹 Break over the flag highs could open the door to a new leg higher.
Setup Notes:
Watching for a breakout over the flag with volume confirmation.
Tight stop under the flag base keeps risk defined.
Price action remains bullish as long as it holds above previous ATHs.
🧠 This is one of my favorite setups — strong stock, strong base, strong trend.
this is the first pull after this initial thrust. The pullback has been boring and orderly too which i think is bullish for the stock
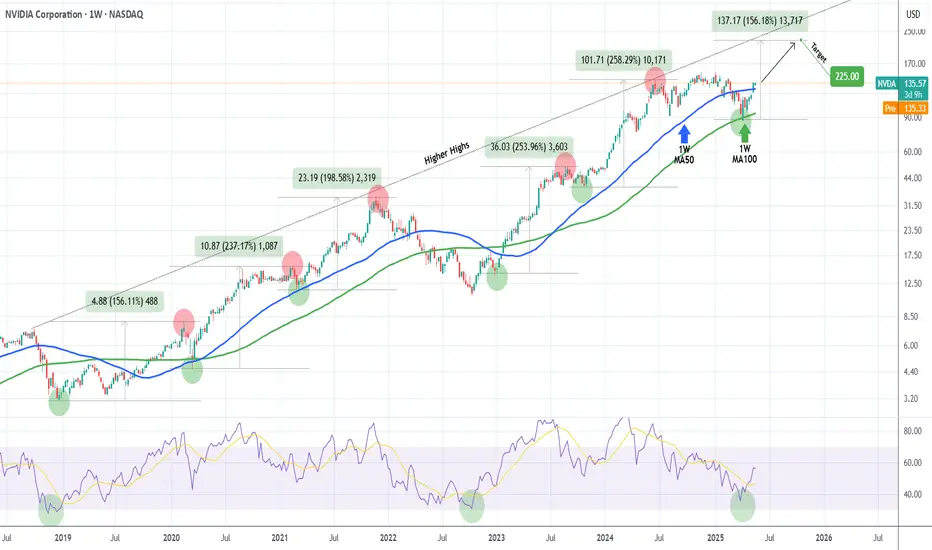
NVIDIA The 1W MA100 rebound is targeting $225 at least.NVIDIA Corporation (NVDA) broke last week above its 1W MA50 (blue trend-line) for the first time in 2.5 months and all this is generated by April's bottom rebound on the 1W MA100 (green trend-line).
The 1W MA100 has been intact since January 23 2023, so this rebound technically initiates a new Bullish Leg. Since the December 2018 bottom (previous U.S. - China Trade War), the minimum rise on such a Bullish Leg has been +156.11%. As a result, NVIDIA can now target $225 at least before the end of 2025.
-------------------------------------------------------------------------------
** Please LIKE 👍, FOLLOW ✅, SHARE 🙌 and COMMENT ✍ if you enjoy this idea! Also share your ideas and charts in the comments section below! This is best way to keep it relevant, support us, keep the content here free and allow the idea to reach as many people as possible. **
-------------------------------------------------------------------------------
💸💸💸💸💸💸
👇 👇 👇 👇 👇 👇
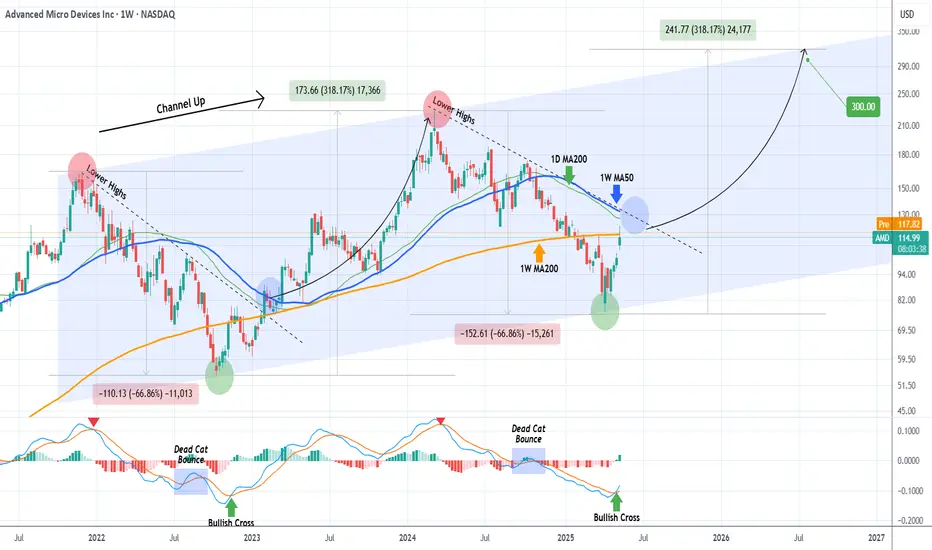
AMD Break-out above this level means new ATH at $300.Advanced Micro Devices (AMD) is on a recovery attempt following the April 07 2025 bottom, which is technically a Higher Low on the 3.5-year Channel Up. This week it broke above the first Resistance level of this attempt, the 1W MA200 (orange trend-line), which is key as it had 2 rejections since February 18 2025.
However the biggest Resistance test is right above it and consists of a strong Cluster of the 1D MA200 (green trend-line), the 1W MA50 (blue trend-line) and the Lower Highs trend-line from the All Time High (ATH).
The previous Bullish Leg of the Channel Up (started on October 10 2022), consolidated for 1 month once it broke above this Resistance Cluster (blue circle) and then marched towards the pattern's Higher High, which was naturally a Higher High.
The similarities between the Legs are striking, the Bearish Legs (both declined by -66.86%) were confirmed by 1W MACD Bearish Cross and the Bullish Legs by a Bullish Cross, which the 1W MACD just completed last week.
This is a major confirmation and technically the earliest for a long-term Buy. Assuming again that the symmetry will continue to hold on this emerging Bullish Leg, we can expect it rise by +318.17% as well. Based on that, our long-term Target on AMD is $300.
-------------------------------------------------------------------------------
** Please LIKE 👍, FOLLOW ✅, SHARE 🙌 and COMMENT ✍ if you enjoy this idea! Also share your ideas and charts in the comments section below! This is best way to keep it relevant, support us, keep the content here free and allow the idea to reach as many people as possible. **
-------------------------------------------------------------------------------
💸💸💸💸💸💸
👇 👇 👇 👇 👇 👇
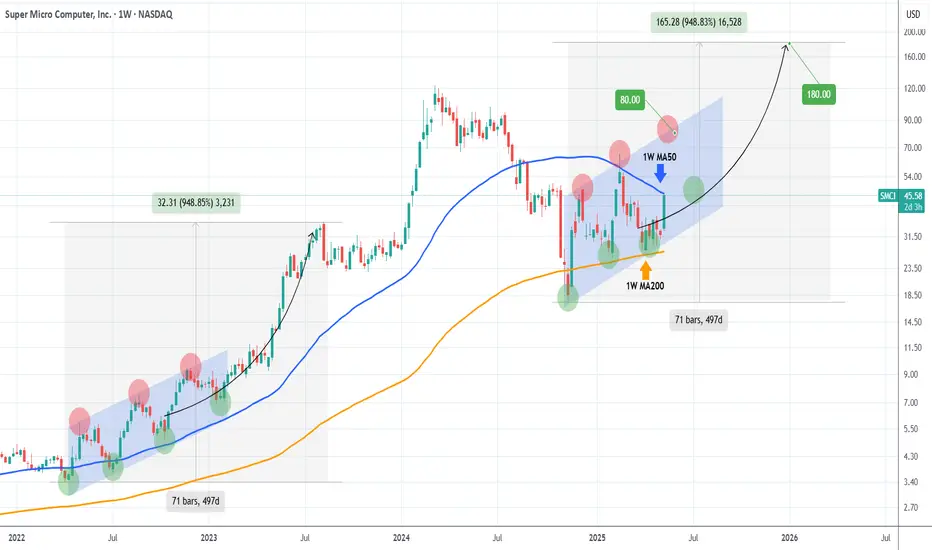
SMCI hit its 1W MA50, eyes a massive break-out.Super Micro Computer Inc (SMCI) has surged more than +15% today after the company announced a multi-year, $20 billion partnership with Saudi data center firm DataVolt.
Technically that brought it on its 1W MA50 (blue trend-line), the first contact with it since the week of February 18 2025, which was the previous Top. The current rally as well as the one that led to the Feb 18 Top, is fueled by the 1W MA200 (orange trend-line) which held as Support on both occasions.
The driving pattern behind those Bullish Legs is a Channel Up (blue) and this is not the first time SMCI comes across such formation. It was in fact a similar Channel Up that took the stock from the 2022 bottom of the Inflation Crisis and guided it to its new Bull Cycle. That rose by +950% before it pulled back on its first consolidation.
As a result, we have a short-term Target at $80.00 and after a pull-back, long-term Target at $180.00 (+950% from the bottom).
-------------------------------------------------------------------------------
** Please LIKE 👍, FOLLOW ✅, SHARE 🙌 and COMMENT ✍ if you enjoy this idea! Also share your ideas and charts in the comments section below! This is best way to keep it relevant, support us, keep the content here free and allow the idea to reach as many people as possible. **
-------------------------------------------------------------------------------
💸💸💸💸💸💸
👇 👇 👇 👇 👇 👇
RIVIAN Huge 1-year Triangle about to break. Trade the break-out.Rivian Automotive (RIVN) is trading within a 1-year Triangle pattern since the April 15 2024 Low. Right now the price is on the 1W MA100 (green trend-line), almost hitting the top (Lower Highs trend-line) of the pattern.
This is the second time ever that the 1W MA100 is tested, the previous on was on the last Lower High in late December 2024, giving slightly more probabilities for a bullish break-out above it.
If this is materialized, buy the break-out and target the 2.0 Fibonacci extension on the long-term at $26.50.
If it fails to break and instead is rejected back towards the Triangle's bottom, wait for a confirmed break of the Higher Lows trend-line and sell towards the -1.0 Fibonacci extension at $6.50.
-------------------------------------------------------------------------------
** Please LIKE 👍, FOLLOW ✅, SHARE 🙌 and COMMENT ✍ if you enjoy this idea! Also share your ideas and charts in the comments section below! This is best way to keep it relevant, support us, keep the content here free and allow the idea to reach as many people as possible. **
-------------------------------------------------------------------------------
💸💸💸💸💸💸
👇 👇 👇 👇 👇 👇

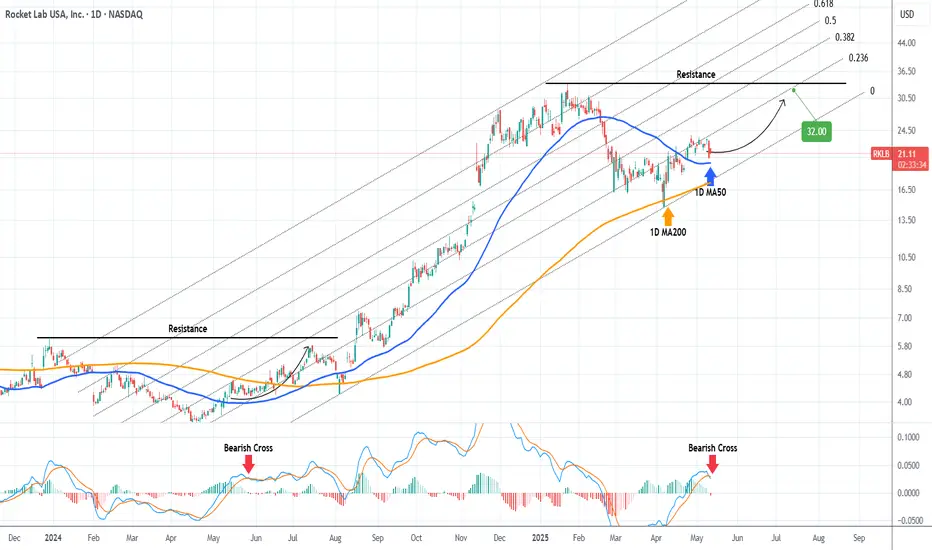
ROCKET LAB establishing its long-term Support to $32.00It's been too long (September 30 2024, see chart below) since we last took a trade on one of our stock gems, Rocket Lab (RKLB), which smashed through our $14.50 Target:
The price is now trading sideways for the past 2 weeks, establishing the 1D MA50 (blue trend-line) as the new Support. Having made the Trade War bottom on its 1D MA200 (orange trend-line), it got its much needed overbought technical harmonization and created new long-term demand.
The pattern is similar to the 1D MACD Bearish Cross in late May 2024, which also made the price trade sideways before eventually almost testing the previous Resistance. As a result, we expect to see $32.00 in July before the stock breaks to a new All Time High.
-------------------------------------------------------------------------------
** Please LIKE 👍, FOLLOW ✅, SHARE 🙌 and COMMENT ✍ if you enjoy this idea! Also share your ideas and charts in the comments section below! This is best way to keep it relevant, support us, keep the content here free and allow the idea to reach as many people as possible. **
-------------------------------------------------------------------------------
💸💸💸💸💸💸
👇 👇 👇 👇 👇 👇
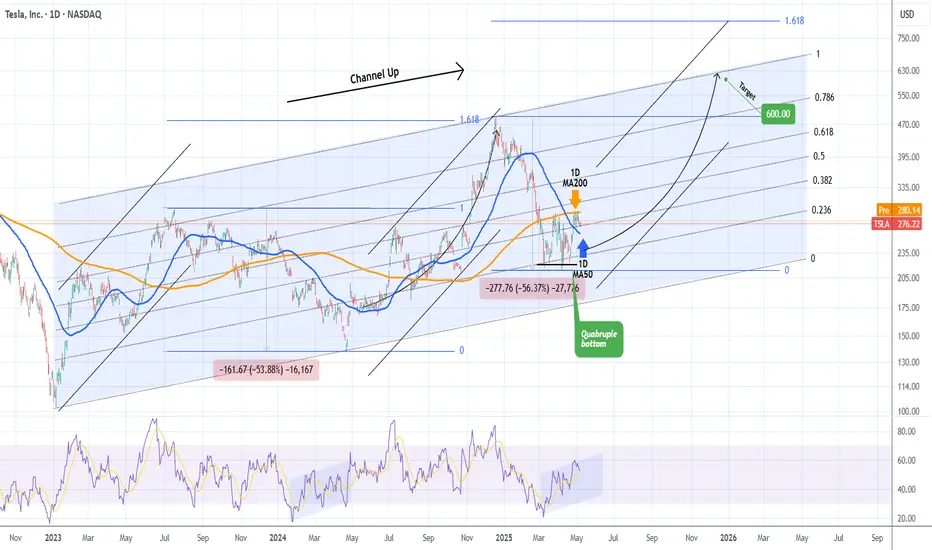
TESLA Is a $600 price tag a pipe dream?Tesla (TSLA) is seeing a steady recovery from the April 21 2025 Low, which has been a Quadruple Bottom, and has found itself consolidating the last 10 days within the 1D MA200 (orange trend-line) and the 1D MA50 (blue trend-line).
The 2.5 year pattern is a Channel Up and this Quadruple Bottom took place exactly on its 0.236 Fibonacci level, with a 1D RSI sequence that resembles the Bullish Divergence of its previous bottom on April 22 2024. The similarities don't stop there as the Bearish Legs that led to those bottoms have almost been identical (-53.88% and -56.37% respectively).
As a result we can technically assume that the current Bullish Leg that will be confirmed with a break above the 1D MA200, will be symmetrical to the previous one, which made a Higher High on the 1.618 Fibonacci extension from the bottom. That is now at $823 but falls outside of the 2.5-year Channel Up, so our long-term Target for the end of the year is $600, which is right at the top of the pattern.
-------------------------------------------------------------------------------
** Please LIKE 👍, FOLLOW ✅, SHARE 🙌 and COMMENT ✍ if you enjoy this idea! Also share your ideas and charts in the comments section below! This is best way to keep it relevant, support us, keep the content here free and allow the idea to reach as many people as possible. **
-------------------------------------------------------------------------------
💸💸💸💸💸💸
👇 👇 👇 👇 👇 👇
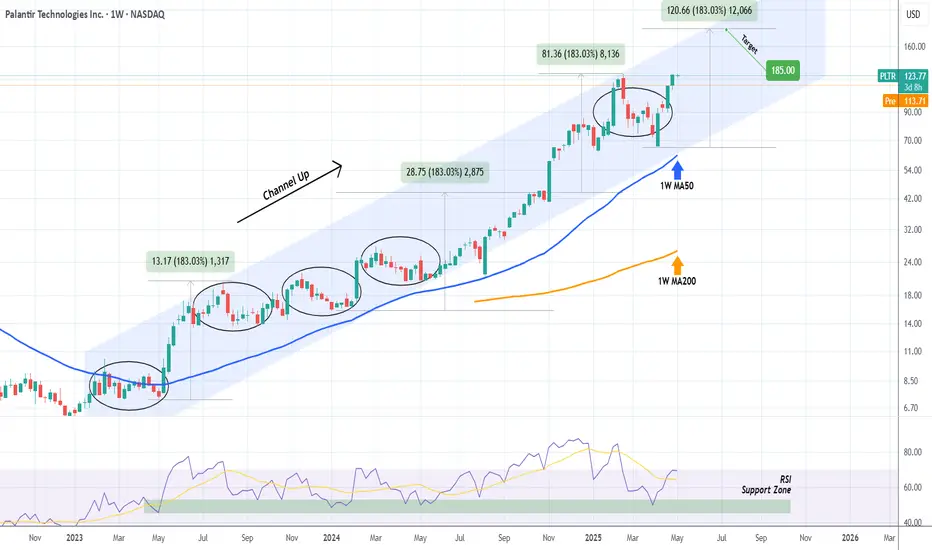
PALANTIR Channel Up intact. Eyeing $185 on this rally.Palantir (PLTR) has been trading within a 2.5-year Channel Up and is currently on its most recent Bullish Leg following the approach f the 1W MA50 (blue trend-line).
Having also rebounded on its long-term RSI Support Zone, the buying pressure is the strongest we've seen inside this pattern, having recovered all loses in just 4 weeks.
Given that the most usual rally was +183.03%, we expect this Leg to reach at least $185.
-------------------------------------------------------------------------------
** Please LIKE 👍, FOLLOW ✅, SHARE 🙌 and COMMENT ✍ if you enjoy this idea! Also share your ideas and charts in the comments section below! This is best way to keep it relevant, support us, keep the content here free and allow the idea to reach as many people as possible. **
-------------------------------------------------------------------------------
💸💸💸💸💸💸
👇 👇 👇 👇 👇 👇
NVIDIA Massive bullish break-out after 4 months of selling.NVIDIA Corporation (NVDA) made a critical bullish break-out yesterday (in the aftermath of Meta's and Microsoft AI capex numbers) as it didn't just break above the 1D MA50 (blue trend-line) that has been intact as a Resistance since February 27 but also above the top of the Channel Down that has been the dominant pattern throughout this correction since the January 07 All Time High (ATH).
The 1D RSI is on an Inverse Head and Shoulders (IH&S) pattern, which is always bullish and if NVDA closes a 1D candle above the 1D MA50 next, then our short-term Target will be 143.50, which is just below Resistance 1 and the 2.0 Fibonacci extension.
-------------------------------------------------------------------------------
** Please LIKE 👍, FOLLOW ✅, SHARE 🙌 and COMMENT ✍ if you enjoy this idea! Also share your ideas and charts in the comments section below! This is best way to keep it relevant, support us, keep the content here free and allow the idea to reach as many people as possible. **
-------------------------------------------------------------------------------
💸💸💸💸💸💸
👇 👇 👇 👇 👇 👇

SMCI Is it still a buy following the Q3 revenue and profit cut?Super Micro Computer Inc (SMCI) cut its third-quarter revenue and profit expectations due to delays in customer spending, amplifying worries of a pullback in AI-linked investments and pushing its shares down -16% pre-market.
It has been 6 months since we issued a major buy signal on SMCI (November 07 2024, see chart below):
Even tough our $122.50 long-term Target still stands, we have to move it later on the time-line until the economic outlook shows the positive signs of 2024 again.
Until then, we have a more medium-term Target of $80.00, which is on the 0.786 Fibonacci retracement level, the same level the price hit in March 2019, following the first U.S. - China Trade War in 2018.
As you can see, the recovery patterns in terms of 1W RSI between the two fractals are almost identical.
Right now the stock is basically consolidating within the 1W MA50 (blue trend-line) and 1W MA200 (orange trend-line), waiting for the next round of expansion news for the market, to break above the Triangle.
-------------------------------------------------------------------------------
** Please LIKE 👍, FOLLOW ✅, SHARE 🙌 and COMMENT ✍ if you enjoy this idea! Also share your ideas and charts in the comments section below! This is best way to keep it relevant, support us, keep the content here free and allow the idea to reach as many people as possible. **
-------------------------------------------------------------------------------
💸💸💸💸💸💸
👇 👇 👇 👇 👇 👇

QQQ - Your guess is as good as mineMarkets are all over the place. I know ground breaking info. I don't think there is any clear answer to what is next.
Even if Trump does reduce tariffs on China, they are still going to be some of the highest in recent history. However, it looks like Trump has flinched and China has the upper hand. That is just likely going to make Trump more erratic since his policies are emotional/ego driven and not strategic.
Overall, there are likely some short-term gains to be have as the market likes to always push up when not in an panic sell. For now, the worst of the news is over and the low from the other week is likely going to be the bottom for the near future. I expect stock to continue this up and down until the tariffs work there way through the system and we see the true effect on the economy.
We punched above the 20 day SMA yesterday and will likely test it for support today and tomorrow. If it holds, I wouldn't be surprised to see prices test the 200 day. Hard to know what crazy stuff Trump will do over the weekend, so we will have to see. Good luck and enjoy the ride.
