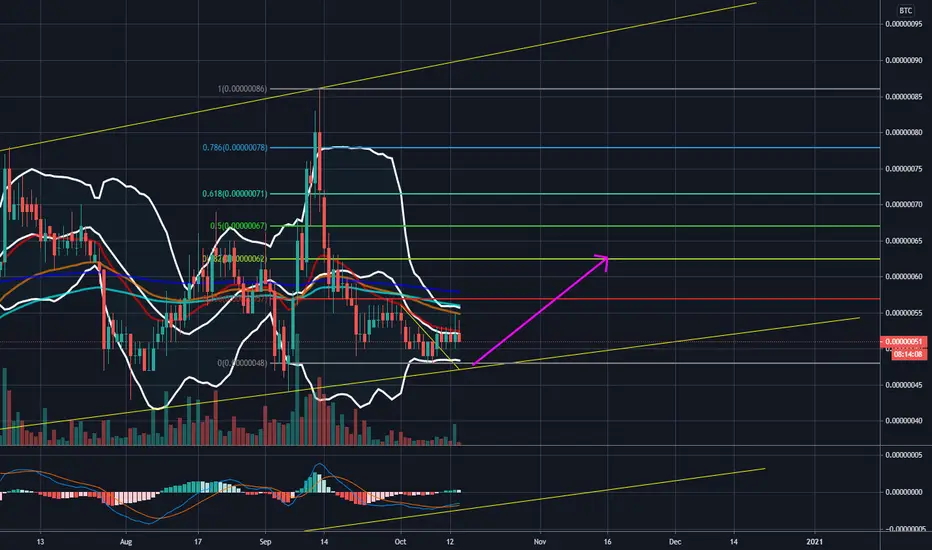
BLZ - The Blue Bull Heading to the Green Fields?BLZ is the coin of Bluzelle, a decentralized database that allows dapp (decentralized application) developers the ability to store data directly on the blockchain. They have a wallet and PoS features like pretty much everyone in the crypto world.
On the chart we are seeing a consolidation triangle that has formed since a steep mid September drop.
This triangle appears quite bullish, with a steep incline of higher lows.
Current price looks to be right at the bottom of the triangle.
MACD is in a good position for growth with the potential of a bear cross short term forming, which would bring us to test the bottom of the triangle.
RSI is in a freefall but about to hit the bounce point recently.
Volume has been dropping on sells and rising on buys, implying bullish bias.
OVERALL
Either play it risky by buyin in now with a tightish SL, under the triangle, OR wait for a retest and breakout of the upper resistance level.
Potential for big gains on a breakout. Dotted line in TP for risk taker, dashed is for the breakout buyers.
--
"The man who never alters his opinions is like standing water, and breeds reptiles of the mind." -William Blake
--
I'm a guy that you don't know posting his ideas on the internet for the sake of improving as a human being. If you take this as financial advice, that's on you.
If you like my analysis, then leave a like and feel free to follow for more free content. Feedback, criticism and crude humor are welcome :)
Tehnicalanalysis

Heading up from here for IOSTClear break out of the descending triangle, with major supports holding beautifully. The next target is 57-62.
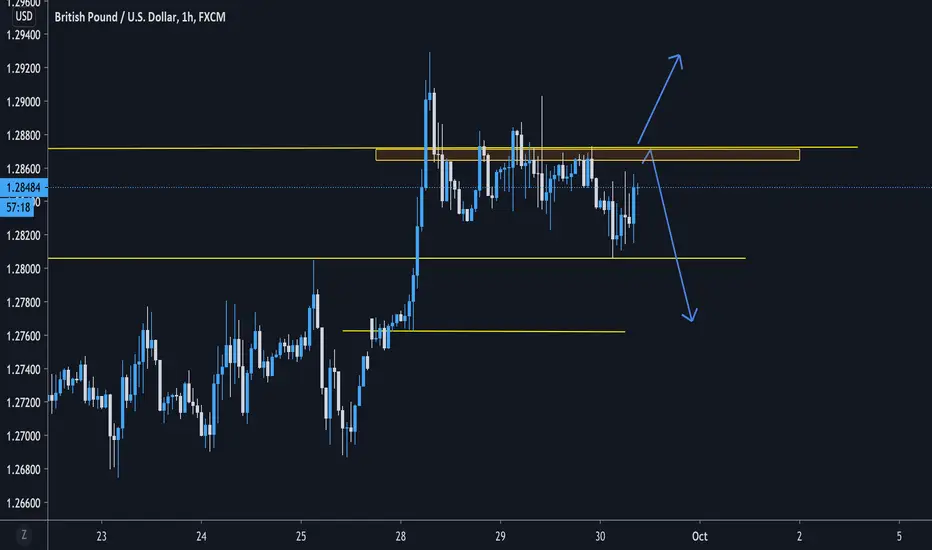
GBPUSD NY SESSION PLANS (NEUTRAL)For some reason, the beginning of the week has been quite hard to trade, however, since we are snipers that doesnt concern us as we will just wait for the price to enter the exact setup and then we can execute. Now lets get on with the analysis:
As we can see, price is relatively sideways for the early week, however i feel today we will see a bit more structured trades and its our job to take advantage of those, but only IF we can see the setups clearly and act accordingly. So, im going to start with the more likely before the last;
: The path which bounces from the resistance level of course, for this to be valid of course we need a rejection at the resistance, just be patient before entering because price can shoot up and cut you out easily if your too early. This path is based on the fact that price has been rejected by this level multiple times already, which tells me we have built liquidity up top...
: If price can somehow gain the strength to finally break the top resistance and retest successfully, we can confidently enter a long position and hold to the upper wick last made and go from there. Price was trending upwards before it entered this channel, so thats why i would look for a long...
LAST THOUGHTS: If price continues to play in this channel, im going to start scalping smaller moves on a slightly bigger lot size since there are no structured moves at the moment. If your going to practice this, use proper risk management and set fairly small targets; the idea is to rack the small movements up while we wait for price to gain a little more structure so we can take the bigger moves.
Trade safe Snipers, Precision FX posting to you daily :D
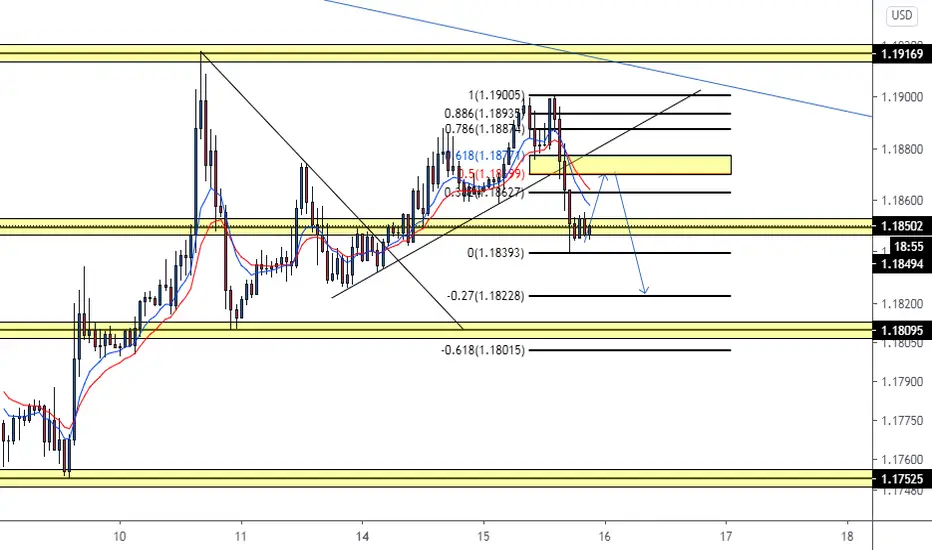
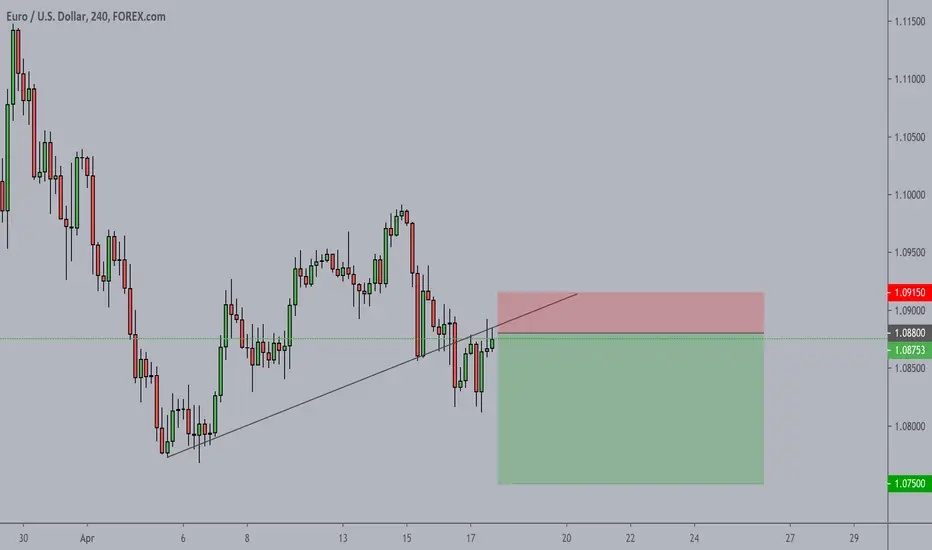
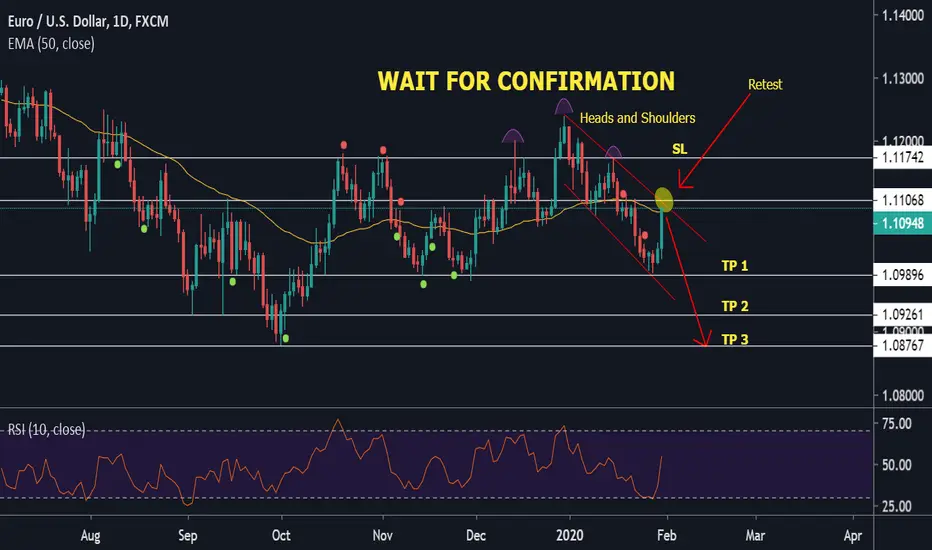
EUR/USD Short EUR/USD price break the support trend line and support , waiting retracement in gold zone then it will decrease.
US500 potencial correction and continue down trendcorrection to trend line, MA 50 and strong resist level and go DOWN

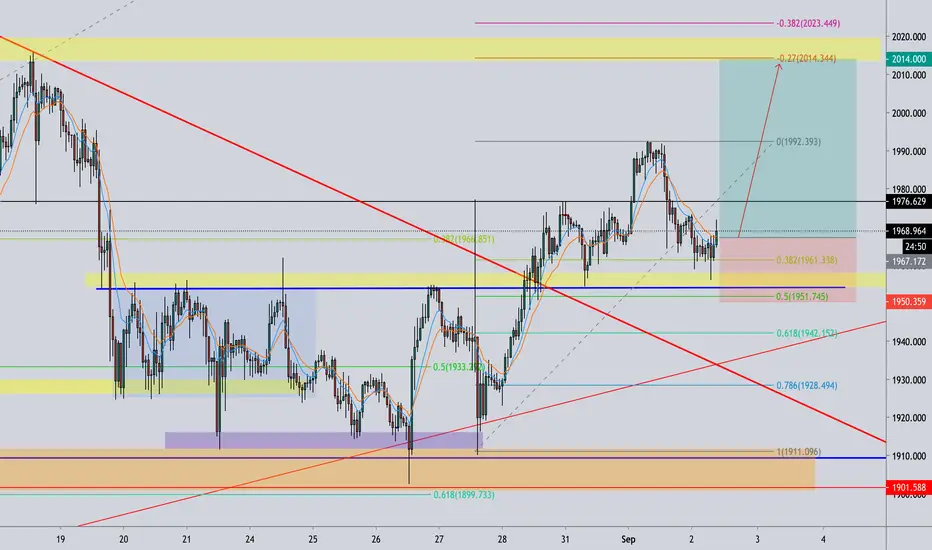
Gold (Xau/usd )buy opportunity !!we clearly see price retrace 38.2% from high, nice respect of the liquidity level, we also see EMA crossover.
manage your risk and have a wonderful day

Long Bhartiartl With Stoploss of 560.15 and Target 577Long Bhartiartl With Stop-loss of 560.15 and Target 577..
We are not SEBI registered and this is only for educational purpose..

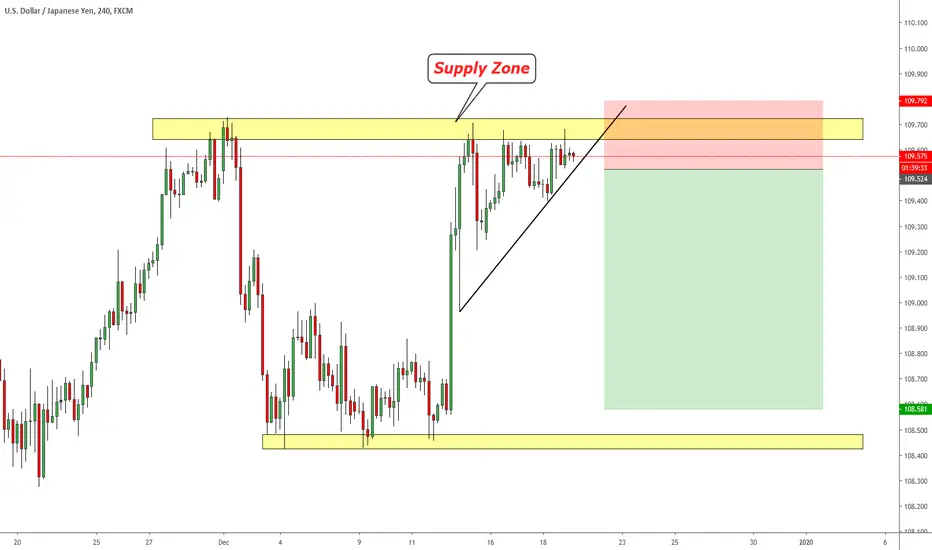
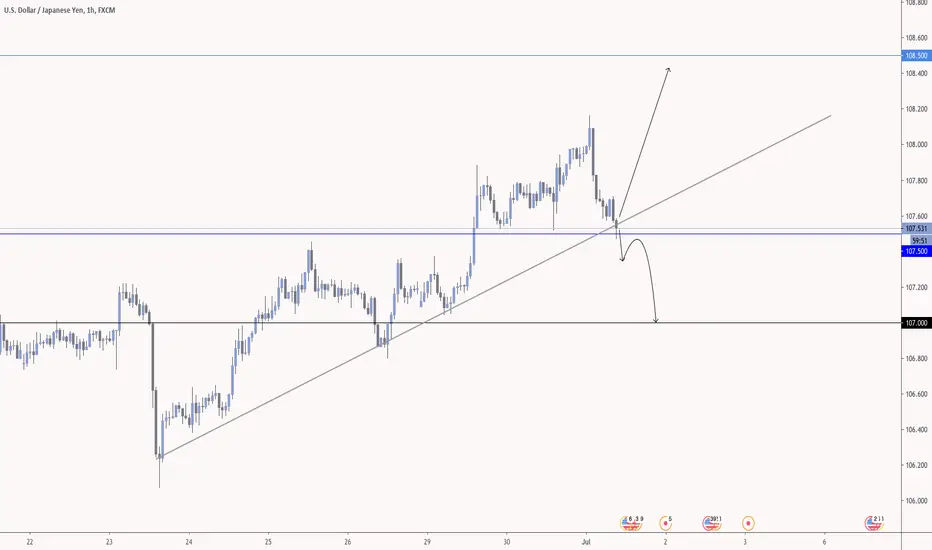
USDJPY - Trend Line Hold?Will the ascending trendline to the upside hold or will we see a break below? It's very hard to tell especially with the indecision on the DXY but I will certainly be monitoring this pair.
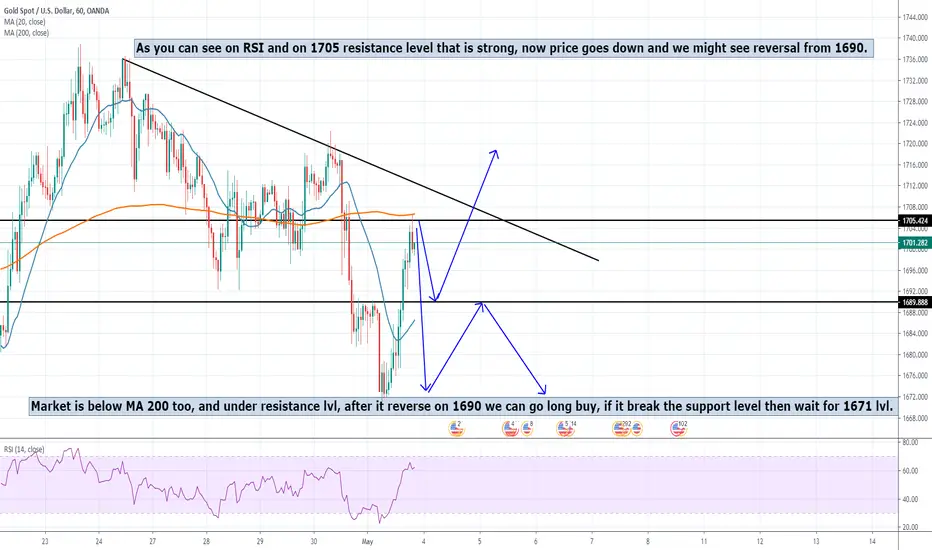
XAUUSD Buy at 1690I think bulls took out of control last trading day and we might see reversal on 1690 support level which can be supprt and go for buying till 1719, or what we can expect is breaking of the 1690 level and going to 1672, maybe lower. RSI says that brice is over buyed. Market is down trend, on 4H too.
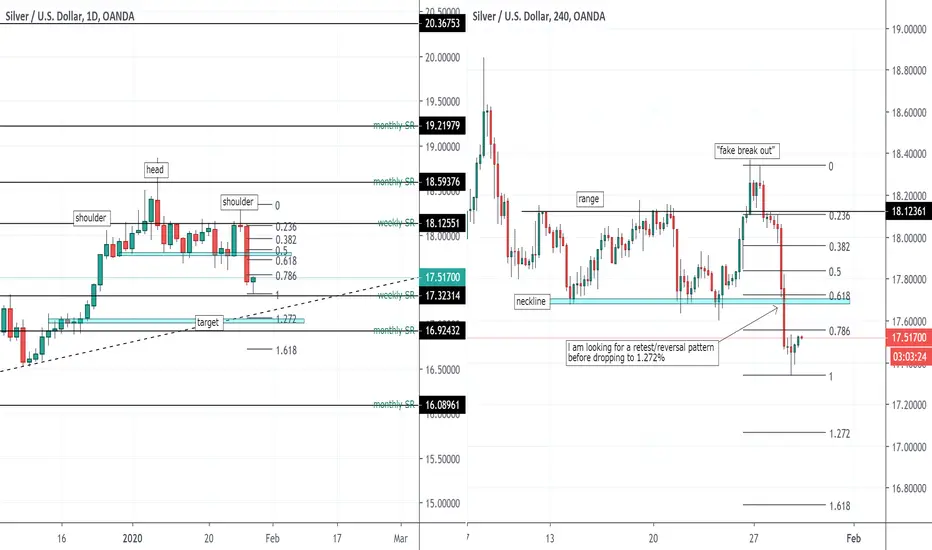
Selling pressure Appearing on 78.6% FibonacciThis week we saw Gold Pumped and got dumped at the level of 78.6% Fibonacci level and crafting out the peak in 2011 and bottom of 2016 within the range period and price very highly respects for fibonacci retracement levels.
there are a few scenario for the gold and would like to highlight some of the things that we might be facing for clarity.
For traders that trading using price action and support & resistance levels together with fib, you might already saw what i am seeing now. the confirmation will only happen after this month closing below the fib level of 78.6%.
If it happens
1. will be seeing to trade within the inside bar of March 2020. the closing of the month will be a strong signal of the direction of the market.
2. Price breaking down march low and close will move towards 2013 - 2019 range for 2nd order flow.
3. If price fail to hold ant buy zone 1 and 2 will be seeing to reach near the 2016 low of 1040ish level for the third buy.
Note: if price breaks below, will be seeing melt down from there.
We have a possible weekly chart Wick selling when market open on Monday and with a definite risk of last week high will be a good area to place a stop loss to ride a mini trend downwards.
I am quite bullish on gold for long term but for short term this is a short call.
I hope you like my post and can support me by like follow and share my idea.
Till then.

CADCHF ShortCC short to .68 level...I see it also hitting a level of supply , rejecting and then continuing down

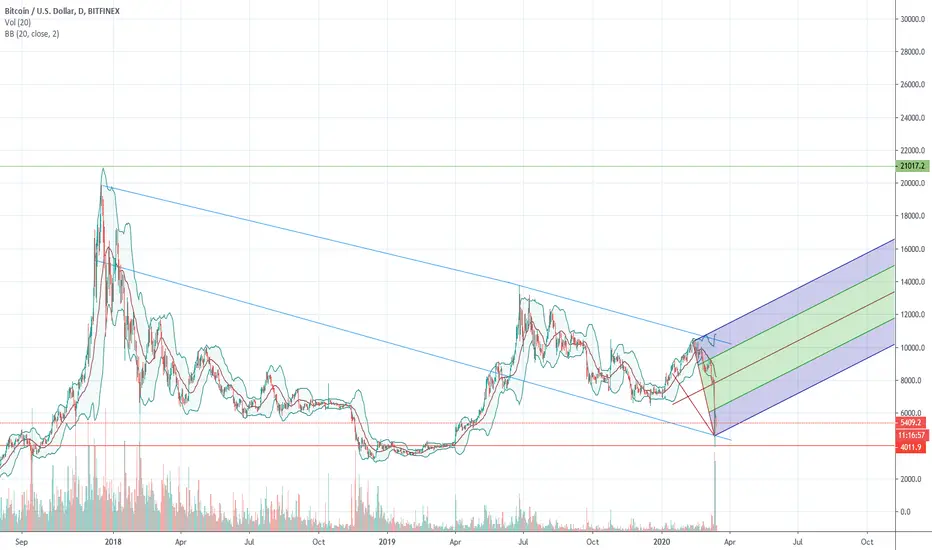
BTCUSDGood afternoon! Excellent went to the correction, exactly 0.61 on the Fibonacci. Possible declines to 0.78, but I'm already starting to buy in small parts) have a Good day and a big profit!
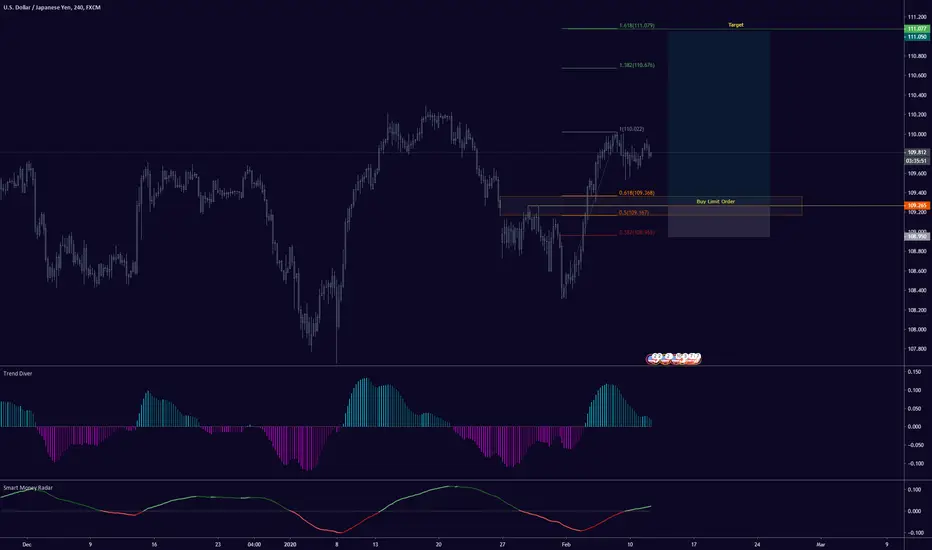
USD/JPY - Long opportunitiesHello traders, buy opportunities @ 109.265 - based on my own strategy.
TP - 111.050
SL - 108.950
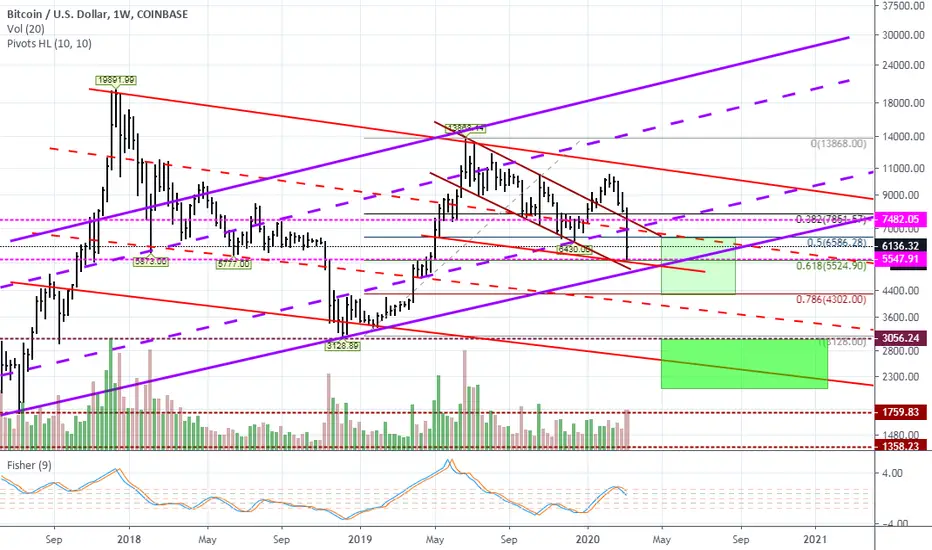
Bitcoin - Time to BUY...I'm not big cryptocurrency fan, but this looks me now quite interesting....If i look only technical analysis then there is so many ''buy'' opportunities confluence.
5 wave down correction get over with bearish divergence and sort of HS patter on 200ema zone...Correction trendline is broken and now it retested at 38fib...also an there is bullish hidden divergence as well what means that bullish run should ccontinuation...lets siis how is play out...:)