LUNAUSDT Hit the bottom of its 6 month Channel Up*** ***
For this particular analysis on TERRA we are using the LUNAUSDT symbol on the Phemex exchange.
*** ***
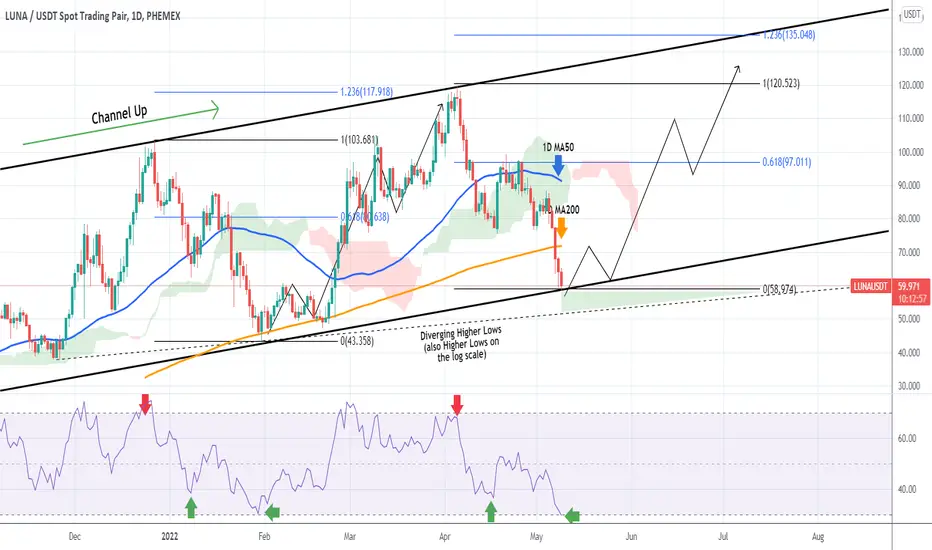
The idea is on the 1D chart with the blue trend-line being the 1D MA50 and the orange trend-line the 1D MA200. As shown, LUNAUSD has been trading within a Channel Up ever since its December 2021 High. Two Higher Lows and another Higher High have followed, forming the bullish trend on this Channel.
Today the price hit the Higher Lows trend-line (bottom) of this long-term Channel Up on the liner scale. On the log scale, there is still some room for a complete pull-back, which happens to be on this diverging Higher Lows trend-line as illustrated on the chart. The RSI (1D) is exactly on the level (oversold 30.000) where the last Higher Low was priced on January 30 2022. If those Support levels hold, we expect LUNA to gradually start the new rally to a Higher High within the Channel Up.
Attention is needed, as this time besides the 1D MA50, it also has the 1D MA200 as a Resistance on the short-term. Potential confirmation comes if the price breaks above it. The 0.618 Fibonacci retracement level ($97.000) can be used as a medium-term target with the 1.236 ($135.000) being the long-term (which priced the previous Higher High).
--------------------------------------------------------------------------------------------------------
** Please support this idea with your likes and comments, it is the best way to keep it relevant and support me. **
--------------------------------------------------------------------------------------------------------
Terrasignals
LUNAUSD Update for the next 3 months. Target $160.00.My last Terra (LUNAUSD) analysis was in late February where I set a medium-term target of $130.00:
Even though the price "only" managed to scratch the $120 mark, that was good enough for those who bought into the rally and naturally the price dropped on heavy profit taking.
As you see the fractal comparison with the early 2021 Cycle played out fairly well. From September to November 2021, the fractal extended its rise through a steadier and more structured Channel Up formation. That pattern in a little more than 3 months reached the 1.5 Fibonacci extension.
That extension is currently a little above $160.00 and that is our target by mid Summer.
--------------------------------------------------------------------------------------------------------
Please like, subscribe and share your ideas and charts with the community!
--------------------------------------------------------------------------------------------------------

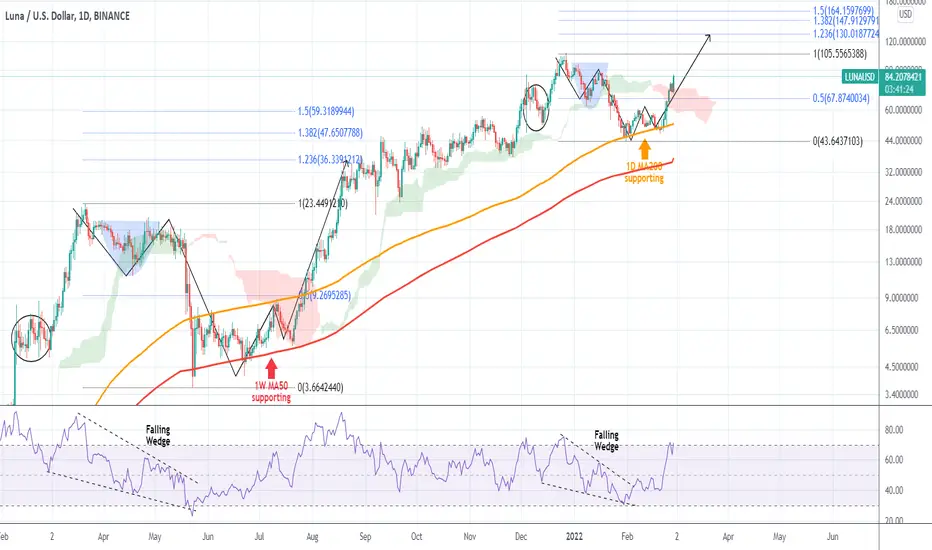
LUNAUSD is at its very best now and targeting $130.00 mid-termTerra is having a very impressive 1 week bullish streak, rising more than +80% since February 20. The price action since December 2021 is very similar with that of March - July 2021. This time it is the 1D MA200 (orange trend-line) supporting, while in March - July it was the 1W MA50 (red trend-line). Even the RSI on the two was a Falling Wedge pattern.
In August 19 2021, LUNAUSD reached the 1.236 Fibonacci extension initially before in a time-span of 3 months it slowly hit the 1.382 and the 1.5 Fib extensions successively. Currently the 1.236 Fib ext is exactly at $130.00 and that stands out as a realistic medium-term target for buyers.
--------------------------------------------------------------------------------------------------------
** Please support this idea with your likes and comments, it is the best way to keep it relevant and support me. **
--------------------------------------------------------------------------------------------------------
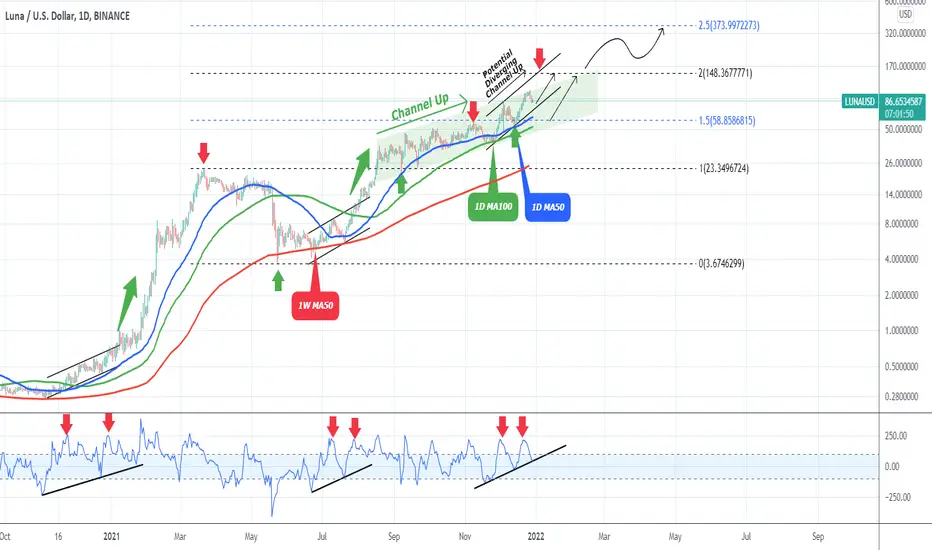
LUNA Bullish formations emerging. 2022 outlook.I have posted a LUNAUSD analysis earlier this month (Dec 02) but due to the latest market volatility, it is a good time to update it:
As you see that pattern above played out almost exactly as planned as the price initially broke out then pulled-back to the 1.0 Fib and rallied strongly above $100.00 up until the last few days. The obvious dominant pattern is the (green) Channel Up, which currently uses the 1D MA50 (blue trend-line) - 1D MA100 (green trend-line) zone as its Support. However I see the potential for a diverging Channel Up (black lines) if LUNA finds support around the current levels today or tomorrow. The main reason for this emergence is the 1D CCI indicator which being on a Double Top (red arrows) while supported on Higher Lows, resembles the diverging Channels of June - July 2021 and November - December 2020, both of which initiated strong rallies once the broke upwards.
As shown on the chart, Terra targets the +0.5 Fibonacci intervals and when it breaks them, it later tests them as Supports. The 1.5 Fib extension has already been tested as Support so the next target is technically the 2.0 Fib ext (roughly $148.00) followed by the 2.5 (roughly $373.00). My thesis is that it is not late to invest in LUNA.
--------------------------------------------------------------------------------------------------------
** Please support this idea with your likes and comments, it is the best way to keep it relevant and support me. **
--------------------------------------------------------------------------------------------------------