TESLA: Long Signal with Entry/SL/TP
TESLA
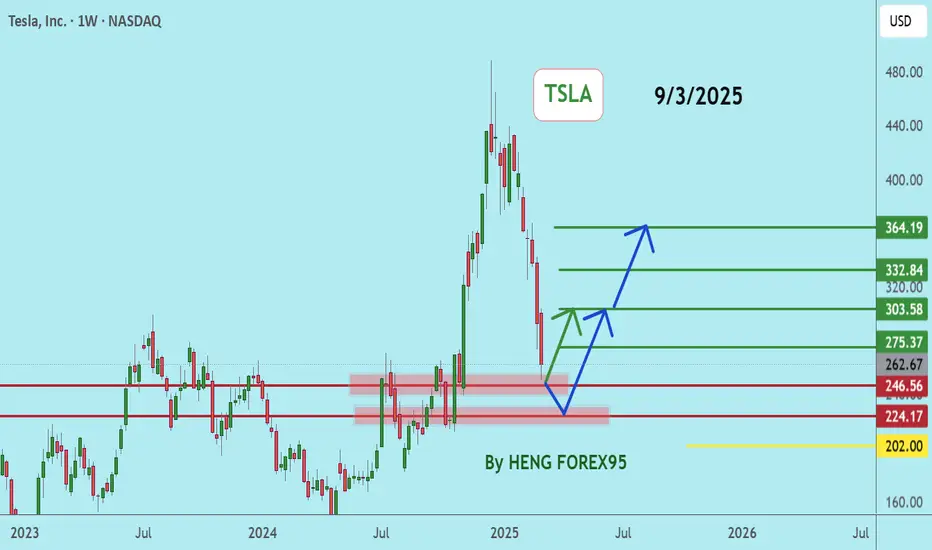
- Classic bullish formation
- Our team expects pullback
SUGGESTED TRADE:
Swing Trade
Long TESLA
Entry - 295.19
Sl - 276.74
Tp -325.39
Our Risk - 1%
Start protection of your profits from lower levels
Disclosure: I am part of Trade Nation's Influencer program and receive a monthly fee for using their TradingView charts in my analysis.
❤️ Please, support our work with like & comment! ❤️
Tesla

TESLA Massive Short! SELL!
My dear friends,
Please, find my technical outlook for TESLA below:
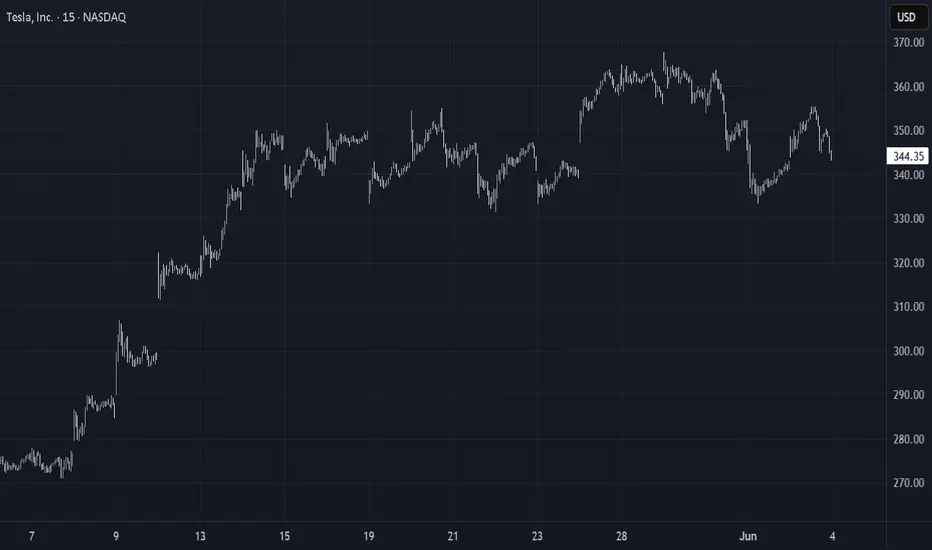
The instrument tests an important psychological level 345.78
Bias - Bearish
Technical Indicators: Supper Trend gives a precise Bearish signal, while Pivot Point HL predicts price changes and potential reversals in the market.
Target - 308.21
Recommended Stop Loss - 364.73
About Used Indicators:
Super-trend indicator is more useful in trending markets where there are clear uptrends and downtrends in price.
Disclosure: I am part of Trade Nation's Influencer program and receive a monthly fee for using their TradingView charts in my analysis.
———————————
WISH YOU ALL LUCK

$NASDAQ:TSLA is Going to SkyRocket is Inevitable.NASDAQ:TSLA
Hi
Its the Moment for Collecting and Accumulating Stocks.
From Today on wards and upto 2 to 3 Years, its goin Sky Rocket.
Dnt Miss The Rallly ......
Thanks

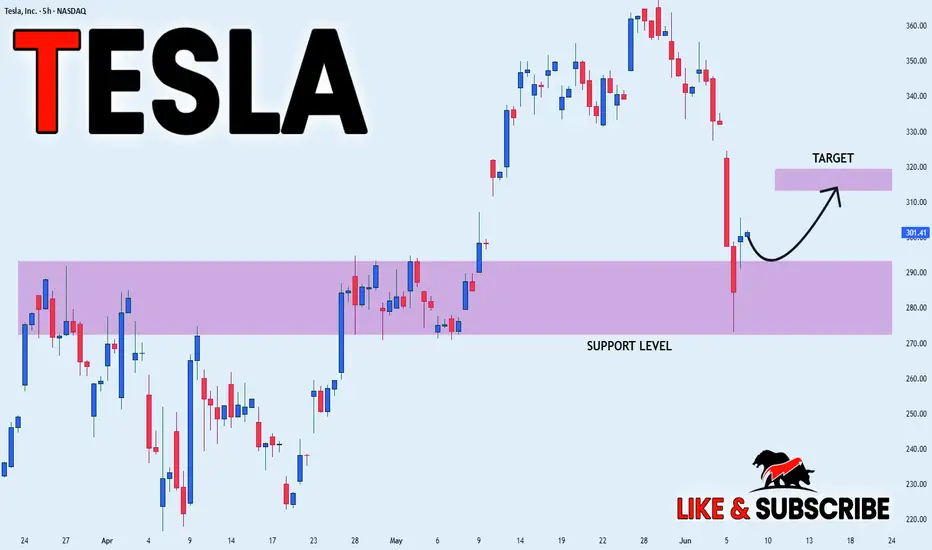
TESLA RECOVERY AHEAD|LONG|
✅TESLA lost more than 25%
On the Elon VS Trump fallout
In less than a week which is
Seen by many as an excellent
Opportunity to add TESLA stocks
To their portfolios with a great
Discount which is why we are
Already seeing a nice rebound
From the wide strong horizontal
Support just above 270$ level
And as we are locally bullish
Biased we will be expecting
Further growth on Monday
LONG🚀
✅Like and subscribe to never miss a new idea!✅
Disclosure: I am part of Trade Nation's Influencer program and receive a monthly fee for using their TradingView charts in my analysis.
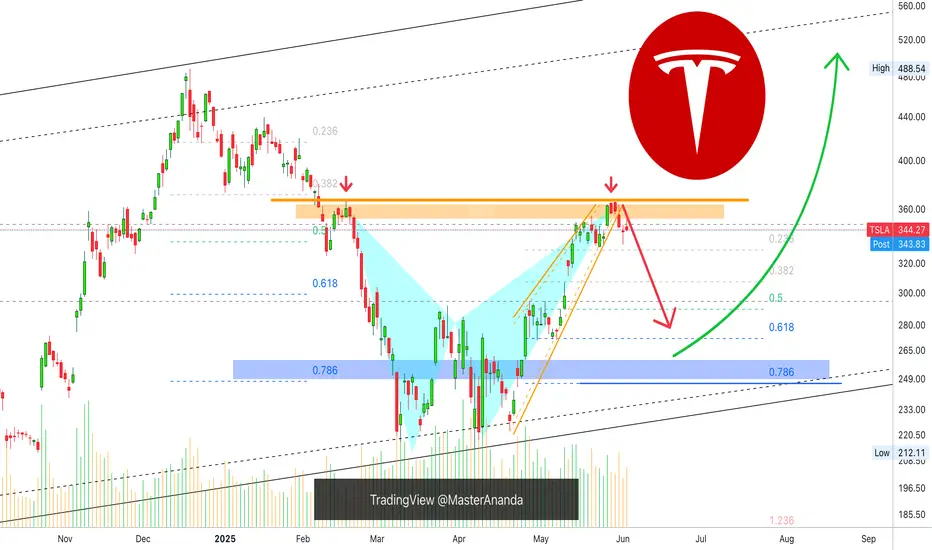
$TSLA - Time to BUY (F to sellers)When weak hands sell in fear, we proudly buy.
Tesla is at the perfect spot for buying right now, both from fundamental and technical sides. The recent fight between Elon & Trump granted so much needed correction to the chart. The price is resting on the $260 - $280 support now - ideal spot for buying before the massive blast off will happen.
A few technical factors: there is a HUGE ascending triangle with horizontal resistance ($415), the 3rd approach of this resistance should be final before the breakout happens! Moreover, the price is steadily forming a bullish pennant that will help in breaking the resistance up.
The overall trend is strictly bullish according to Fibo. The target of this upward movement is located in the $900 - $1000 zone which is x4 from current points. Not very often in our century you get such an opportunity.
You may have different opinions about Elon Musk, but you can't deny the fact he is brilliant businessman and entrepreneur. You can already see that "Tesla owners are scrambling to remove their anti Elon stickers from their car now that he is feuding with Trump" . Elon is a good-guy for liberals again, while republicans didn't change their positive attire regarding his company as well.
I tend to believe that all those news we witnessed yesterday (mean Elon&Trump fight) was just a part of a bigger plan , the outcome of which we will see later this year or even next year.

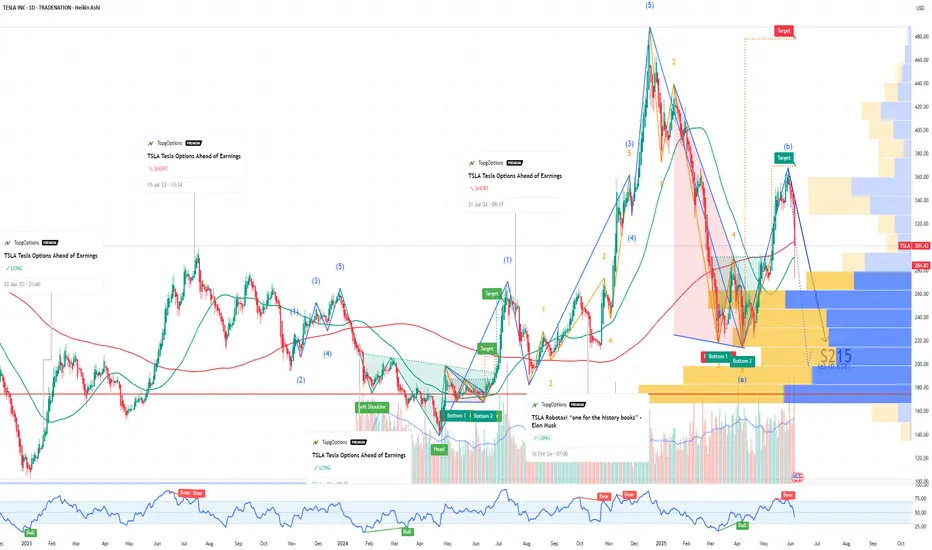
TESLA Is it a good buy after the Trump - Musk clash?Tesla (TSLA) lost $150 billion yesterday, closing the session down by -14%, following President Trump's public feud with its CEO Elon Musk. Trump responded to Musk' criticism over the new tax bill, claiming that Musk was upset because the bill takes away tax benefits for electric vehicle purchases.
The obvious question that arises for investors is this: Is Tesla still a buy?
Quick answer? Yes. And once the dust from the fundamentals/ news settles, the technical patterns will prevail.
The long-term pattern since the January 03 2023 bottom has been a Channel Up. The recent April 07 2025 Low has been a Higher Low on this pattern as, even though it didn't touch the Channel's bottom, it did triple bottom on the 0.236 Fibonacci Channel retracement level.
This kick-started the new Bullish Leg of the pattern and yesterday's correction may be nothing more than the start of a Bull Flag formation, similar to those that took place half-way through both previous Bullish Legs.
You can even see how similar the 1W RSI patterns are among the 3 fractals, which have been Accumulation Phases before the start of the 2nd part of the Bullish Leg.
Even though the 1.618 Fibonacci extension is a technical possibility, we can settle for a $600 Target, which would fulfil the conditions of keeping the price action within the Channel Up by the end of the year.
-------------------------------------------------------------------------------
** Please LIKE 👍, FOLLOW ✅, SHARE 🙌 and COMMENT ✍ if you enjoy this idea! Also share your ideas and charts in the comments section below! This is best way to keep it relevant, support us, keep the content here free and allow the idea to reach as many people as possible. **
-------------------------------------------------------------------------------
💸💸💸💸💸💸
👇 👇 👇 👇 👇 👇

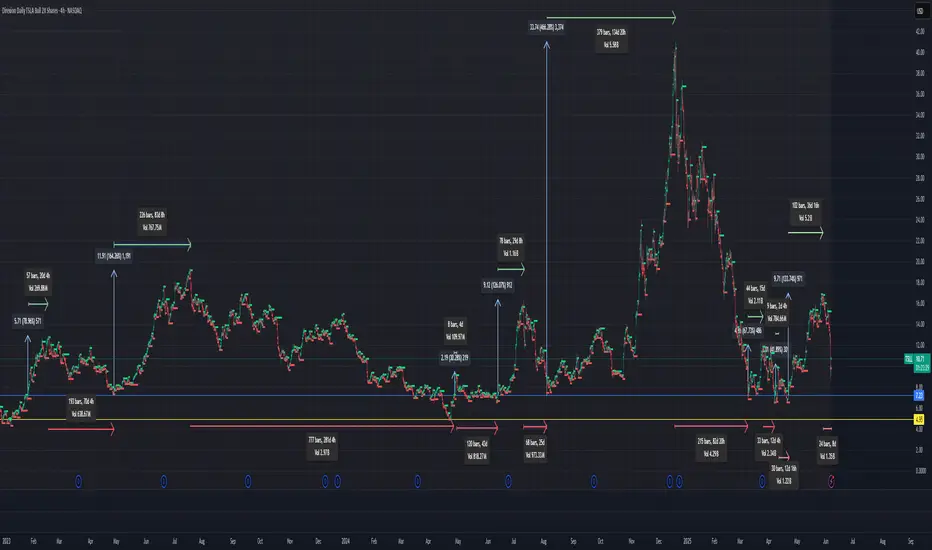
2X Levered TESLA TSLL: $7.23 level since 2023Since 2023, when TSLL 2X levered Tesla hit $7.23 it tend s to see significant upside. The chart show the peak profit levels from the $7.23 level. I am waiting for it to drop below and then buy when price rises above the level. The horizonal arrows at the top show how many days it takes to hit the peak in trade. The horizontal arrow on the bottom indicated the number of days it tool to fall from the peak to the next buying level.
Tesla Update Longs and shorts At the start of the video I recap my previous video and then bring us up to date with the present price action .
In this video I cover Tesla from the higher time frame and breakdown both a long term bullish scenario as well as a local bearish scenario .
Both of these scenarios present longs and short entries for day trade opportunities and swing positions .
Tools used Fibs , TR pocket , Volume profile , Pivots , and vwap .
Any questions ask in the comments
Safe trading and Good luck

Tesla Drop to the downside update In this video I recap what happened in the latest drop on Tesla and how we anticipated this move some 4 days ago .
I cover whats possibly next for tesla looking forward .
This video also covers a HTF perspective on the direction of Tesla .
Any questions ask in comments
Thanks for your support

TSLA Oversold Bounce Setup – Targeting $300 Max Pain Zone🚗 TSLA Oversold Bounce Setup – Targeting $300 Max Pain Zone 🔥
📅 Signal Date: June 5, 2025 | ⏳ Duration: 5–10 Day Swing
🎯 Objective: Play oversold bounce into heavy open interest at $300
📊 Multi-Model Insight Summary
Model Bias Strategy Strike Entry Target Stop Confidence
Grok Mod. Bullish Buy Call 290 34.00 40.80 17.00 75%
Claude Mod. Bullish Buy Call 290 34.00 50.00–65.00 20.00 75%
DeepSeek Mod. Bullish Buy Call 300 26.65 32.00 20.00 75%
Gemini Neutral/Stand Aside No Trade — — — — 45%
Llama Mod. Bearish Buy Put 280 3.30 1.65 3.30 75%
🔎 Technical & Sentiment Snapshot
15-Min RSI: Extremely oversold → Mean-reversion potential
Daily/Weekly: Neutral, but nearing key support zones
Price Action: 5-day sharp drop into $280–$285 area
Max Pain: $300 → potential gravitational magnet for bounce
Sentiment: News uncertainty (Musk/Trump noise) but positioning supports upside
IV Rank: Elevated — options rich but supported by move potential
🎯 Trade Setup – Long TSLA Call
Instrument: TSLA
Direction: CALL (LONG)
Strike: $290.00
Expiry: 2025-06-20
Entry Price: $34.00
Profit Target: $40.80 (20% premium gain)
Stop Loss: $17.00 (50% premium loss)
Size: 1 contract
Entry Timing: Market open
Confidence Level: 70%
⚠️ Risk Management Notes
🔻 Premium decay: Watch theta decay closely, especially if no bounce by day 5
🚫 Technical breach: Close trade if $280–$285 breaks on strong volume
💣 Headline risk: Musk-related catalysts or macro shifts can swing direction rapidly
⏳ Time Exit Rule: Consider exiting by June 14 if trade hasn’t reached target
🧠 Trade Rationale
TSLA’s sharp pullback into oversold territory alongside strong call OI at $300 sets the stage for a short-term relief bounce. Multiple models support the call play, with a focus on a 5–10 day recovery swing.
Tesla Monthly TF (Next Target —110-140)I will not bore you with too many details. I will do an analysis based on the moving averages to support my bias, bearish at this point.
April 2024 tests EMA89 as support and this support level holds. This results in a bullish impulse.
The impulse ends December 2024. On the drop, TSLA founds support at EMA55 monthly. There is bounce at this level and this bounce ends as a lower high.
» When this happens, the next moving average in line gets tested, in this case EMA89 or a minimum of 191 as the next target.
EMA55 monthly sits at 229.88 (230). This level will fail as support, why? Because the test of it in March and April led to a lower high and this lower high will be followed by a lower low.
If TSLA had moved higher than December 2024, then any drop or correction would not go below EMA55. Since the action is ending as a lower high, then the next drop which is already underway will break through this level.
The main level for the current move sits around 110-140 based on the long-term. These levels are close to the lows in January 2023 and December 2022.
Technical analysis can help you predict a move regardless of its cause. Don't believe me? See the 'related publications'.
Thanks a lot for your continued support.
Namaste.

Tesla Daily, Update (Bearish Trend Extends)Today TSLA produced the highest bearish volume session since July 2020. This high volume and strong sellers pressure shows up to break EMA55, EMA89 and MA200 daily as support. Needless to say, this is a very strong bearish development.
The break of this long-term support comes after a major lower high. May 2025 much lower compared to December 2024.
My point is to alert you of a much stronger correction than expected on this stock. Now that MA200 has been lost as support, with the highest volume in five years after a strong lower high, we can expect the continuation of the bearish trend.
I will look at Tesla on the monthly timeframe in a separate publication.
Thank you for reading.
Namaste.

TESLA PRICE ACTION JUNE 5TH 2025Welcome to Tesla weekly &there is a news about Elon going against the bill from trump.
I will never buy their news as they are manipulating retailers.
I am buying & I have discussed all the important levels here,
If you have any doubts, feel free to leave your comments here.

Tesla Still Slightly Bearish Until FED Cuts RatesOne of my followers asked, "how about now?"
The question comes because he is bullish and I am sharing bearish charts.
Here is the thing, the chart is still bearish of course because of the red candles and the double-top. This can't change unless the last high is broken with significant rising volume.
I'll make it easy. This stock is likely to continue bearish until after the Federal Reserve cuts interest rates. When they lower the stuff, they do their magic their numbers then the market will turn bullish. So bearish before, bullish after. And this is a classic dynamic.
The market goes through a retrace or correction preceding a major bullish development. Since the bullish development will definitely push prices up, the market must express its bearish tendencies before the event shows up.
So bearish now. When the Fed announces that they are reducing interest rates later this month, then 100% bullish I agree of course.
Thanks a lot for your continued support.
This same analysis applies to Bitcoin and all related markets.
The altcoins though are a different thing because these are smaller and already trading at bottom prices. They will recover sooner and will start moving ahead of the pack revealing what is coming to the bigger ones.
All is good.
Thank you for reading.
Namaste.
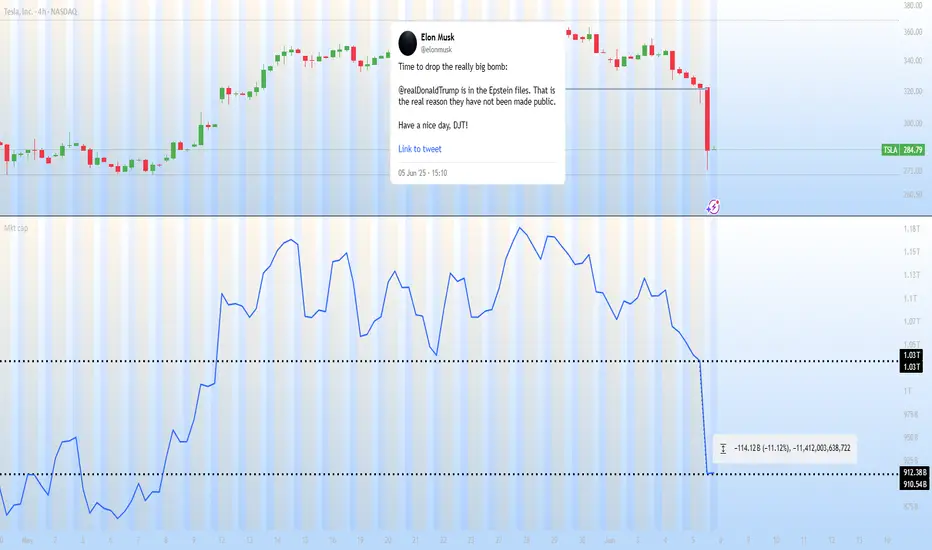
TSLA SellOff ! Elon Musk vs Donald Trump ! Beginning of the End?If you haven`t bought the dip on TSLA:
Now you need to know that TSLA Tesla experienced a significant drop of 14% today, marking its worst single-day performance in over four years. This decline erased approximately $150 billion in market capitalization, bringing the stock down to $284.70.
The immediate cause of this downturn is the escalating feud between CEO Elon Musk and President Donald Trump. Musk's public criticism of Trump's tax legislation, labeling it a "repugnant abomination," prompted Trump to threaten the revocation of government contracts with Musk's companies. This political clash has introduced significant uncertainty regarding Tesla's future government support.
Beyond the political arena, Tesla's core business metrics are showing signs of strain. The company reported a 9% decline in quarterly revenues and a staggering 71% drop in profits. Additionally, Tesla has lost its leadership position in the electric vehicle market to China's BYD, indicating increased competitive pressure.
cincodias.elpais.com
Investor sentiment is also waning. A Morgan Stanley survey revealed that 85% of investors believe Musk's political activities are negatively impacting Tesla's business fundamentals. This perception is further exacerbated by declining sales in key markets, such as a 17% drop in Model Y registrations in California.
thestreet.com
Elon Musk and Donald Trump have publicly clashed, escalating a feud that has unraveled their once-close relationship. The dispute centers on several issues:
Republican Tax and Immigration Bill: Musk criticized a sweeping Republican domestic policy bill backed by Trump, calling it a "disgusting abomination" on X. Trump claimed Musk initially had no issue with the bill, accusing him of being upset over the removal of an electric vehicle tax credit.
Epstein Files Allegation: Musk alleged Trump's name appears in classified Jeffrey Epstein files, escalating tensions. Trump has not directly addressed this claim but responded by threatening to cut government contracts with Musk's companies.
Personal and Financial Accusations: Musk argued Trump would have lost the 2024 election without his financial support, accusing him of ingratitude. Trump countered, saying he was "disappointed" in Musk, claiming he asked Musk to leave the administration and accused him of "Trump Derangement Syndrome."
Government Contracts and Tariffs: Trump threatened to cancel "billions and billions" in government contracts with Musk's companies, like SpaceX, amid the feud. Separately, Musk reportedly made personal appeals to Trump on auto tariffs, which Trump noted might involve a conflict of interest.
Cabinet Clash: Reports indicate Musk clashed with Trump’s cabinet, including Marco Rubio, over spending cuts related to the Department of Government Efficiency (DOGE), with some describing Musk's behavior as disruptive.
Given these challenges, a price target of $215 for TSLA appears justified. The combination of political entanglements, deteriorating financial performance, and eroding investor confidence suggests that Tesla's stock may face continued downward pressure in the near term.
Disclosure: I am part of Trade Nation's Influencer program and receive a monthly fee for using their TradingView charts in my analysis.
Tesla's Perfect Storm: A $152 Billion MeltdownTesla's Perfect Storm: A $152 Billion Meltdown, Chinese Rivals on the Attack, and a Faltering Shanghai Fortress
A tempest has engulfed Tesla, the electric vehicle behemoth, wiping a staggering $152 billion from its market capitalization in a single day. This monumental loss, the largest in the company's history, was triggered by a dramatic and public feud between CEO Elon Musk and former U.S. President Donald Trump. The confrontation, however, is but the most visible squall in a much larger storm. Lurking just beneath the surface are the relentless waves of competition from Chinese automakers, who are rapidly eroding Tesla's dominance, and the ominous sign of eight consecutive months of declining shipments from its once-impenetrable Shanghai Gigafactory.
The confluence of these events has plunged Tesla into a precarious position, raising fundamental questions about its future trajectory and its ability to navigate the turbulent waters of a rapidly evolving automotive landscape. The narrative of Tesla as an unstoppable force is being rewritten in real-time, replaced by a more complex and challenging reality.
The Trump-Musk Spat: A Bromance Turned Billion-Dollar Blow-Up
The relationship between Elon Musk and Donald Trump, once a seemingly symbiotic alliance of power and influence, has spectacularly imploded, leaving a trail of financial and political wreckage in its wake. The public falling out, which played out in a series of scathing social media posts and public statements, sent shockwaves through Wall Street and Washington, culminating in a historic sell-off of Tesla stock.
The genesis of the feud lies in Musk's vocal criticism of a sweeping tax and spending bill, a cornerstone of the Trump administration's second-term agenda. Musk, who had previously been a vocal supporter and even an advisor to the President, lambasted the legislation as a "disgusting abomination" filled with "pork." This public rebuke from a figure of Musk's stature was a direct challenge to Trump's authority and legislative priorities.
The President's response was swift and sharp. In an Oval Office meeting, Trump expressed his "disappointment" in Musk, questioning the future of their "great relationship." The war of words then escalated dramatically on their respective social media platforms. Trump, on his social media platform, threatened to terminate Tesla's lucrative government subsidies and contracts, a move that would have significant financial implications for Musk's business empire. He also claimed to have asked Musk to leave his advisory role, a statement Musk labeled as an "obvious lie."
Musk, in turn, did not hold back. On X (formerly Twitter), he claimed that without his substantial financial support in the 2024 election, Trump would have lost the presidency. This assertion of his political influence was a direct jab at the President's ego and a stark reminder of the financial power Musk wields. The spat took an even more personal and inflammatory turn when Musk alluded to Trump's name appearing in the unreleased records of the Jeffrey Epstein investigation.
The market's reaction to this public spectacle was brutal. Tesla's stock plummeted by over 14% in a single day, erasing more than $152 billion in market capitalization and pushing the company's valuation below the coveted $1 trillion mark. The sell-off was a clear indication of investor anxiety over the political instability and the potential for tangible financial repercussions from the feud. The incident underscored how intertwined Musk's personal and political activities have become with Tesla's financial performance, a vulnerability that has been a recurring theme for the company.
The Chinese Dragon Breathes Fire: Tesla's EV Dominance Under Siege
While the political drama in Washington captured headlines, a more fundamental and perhaps more enduring threat to Tesla's long-term prosperity is brewing in the East. The Chinese electric vehicle market, once a key engine of Tesla's growth, has become a fiercely competitive battleground where a host of domestic rivals are not just challenging Tesla, but in some aspects, surpassing it.
Companies like BYD, Nio, XPeng, and now even the tech giant Xiaomi, are relentlessly innovating and offering a diverse range of electric vehicles that are often more affordable and technologically advanced than Tesla's offerings. This intense competition has led to a significant erosion of Tesla's market share in China. From a dominant position just a few years ago, Tesla's share of the battery electric vehicle market has fallen significantly.
One of the key advantages for Chinese automakers is their control over the entire EV supply chain, particularly in battery production. This allows them to produce vehicles at a lower cost, a crucial factor in a price-sensitive market. The result is a growing disparity in pricing, with many Chinese EVs offering comparable or even superior features at a fraction of the cost of a Tesla.
Furthermore, Chinese consumers are increasingly viewing electric vehicles as "rolling smartphones," prioritizing advanced digital features, connectivity, and a sophisticated user experience. In this regard, many domestic brands are seen as more innovative and in tune with local preferences than Tesla. This shift in consumer sentiment has been a significant factor in the declining interest in the Tesla brand in China.
The numbers paint a stark picture of Tesla's predicament. While the overall new-energy vehicle market in China continues to grow at a remarkable pace, Tesla's sales have been on a downward trend. This is a worrying sign for a company that has invested heavily in its Chinese operations and has historically relied on the country for a substantial portion of its global sales.
The pressure on Tesla's sales in China is so intense that its sales staff are working grueling 13-hour shifts, seven days a week, in a desperate attempt to meet demanding sales targets. The high-pressure environment has reportedly led to high turnover rates among sales staff, a clear indication of the immense strain the company is under in this critical market.
The Shanghai Gigafactory: A Fortress with a Faltering Gate
The struggles in the Chinese market are reflected in the declining output from Tesla's Shanghai Gigafactory. For eight consecutive months, shipments from the factory, which serves both the domestic Chinese market and is a key export hub, have seen a year-on-year decline. In May 2025, the factory delivered 61,662 vehicles, a 15% drop compared to the same period the previous year.
This sustained decline in shipments is a significant red flag for several reasons. Firstly, the Shanghai factory is Tesla's largest and most efficient production facility, accounting for a substantial portion of its global output. A slowdown in production at this key facility has a direct impact on the company's overall delivery numbers and financial performance.
Secondly, the declining shipments are a direct consequence of the weakening demand for Tesla's vehicles in China. Despite being a production powerhouse, the factory's output is ultimately dictated by the number of cars it can sell. The falling shipment numbers are a clear indication that the company is struggling to maintain its sales momentum in the face of fierce competition.
The situation in China is a microcosm of the broader challenges facing Tesla. The company's product lineup, which has not seen a major new addition in the affordable segment for some time, is starting to look dated compared to the rapid product cycles of its Chinese competitors. The refreshed Model 3 and Model Y, while still popular, are no longer the novelties they once were, and are facing a growing number of compelling alternatives.
A Confluence of Crises: What Lies Ahead for Tesla?
The convergence of a high-profile political feud, intensifying competition, and production headwinds has created a perfect storm for Tesla. The company that once seemed invincible is now facing a multi-front battle for its future.
The spat with Trump, while seemingly a short-term crisis, has exposed the risks associated with a CEO whose public persona is so closely tied to the company's brand. The incident has also highlighted the potential for political winds to shift, and for government policies that have benefited Tesla in the past to be reversed.
The challenge from Chinese automakers is a more fundamental and long-term threat. The rise of these nimble and innovative competitors is not a fleeting trend, but a structural shift in the global automotive industry. Tesla can no longer rely on its brand cachet and technological lead to maintain its dominance. It must now compete on price, features, and innovation in a market that is becoming increasingly crowded and sophisticated.
The declining shipments from the Shanghai factory are a tangible manifestation of these challenges. The factory, once a symbol of Tesla's global manufacturing prowess, is now a barometer of its struggles in its most important market.
To navigate this storm, Tesla will need to demonstrate a level of agility and adaptability that it has not been required to show in the past. This will likely involve a renewed focus on product development, particularly in the affordable EV segment, to better compete with the value propositions offered by its Chinese rivals. It will also require a more nuanced and strategic approach to the Chinese market, one that acknowledges the unique preferences and demands of Chinese consumers.
The coming months will be a critical test for Tesla and its leadership. The company's ability to weather this storm and emerge stronger will depend on its capacity to innovate, to compete, and to navigate the complex and often unpredictable currents of the global automotive market. The era of unchallenged dominance is over. The battle for the future of electric mobility has truly begun.

Elon Musk vs Trump: Who you betting on?Elon Musk and Donald Trump have recently had a public falling-out, with their feud playing out on social media and in political circles.
The dispute seems to have started over Trump's new budget bill, which Musk has criticized for increasing the national debt. Trump, in turn, accused Musk of being upset because the bill removes electric vehicle subsidies that benefit Tesla.
The tension escalated when Trump suggested that Musk had known about the bill beforehand and had no issue with it until after leaving his government role. Musk denied this, claiming he was never shown the bill and that it was passed too quickly for proper review. Trump then took things further by threatening to cut Musk’s government contracts and subsidies, which amount to billions of dollars. Musk responded defiantly on social media, calling Trump "ungrateful" and claiming that without his financial support, Trump would have lost the election.
TSLA violated key levels and will be looking for a sharp technical bounce off the $260-$257 zone

Everything we know about the Trump - Musk divorce (so far)
Elon Musk publicly criticised Trump’s “One Big Beautiful Bill” as a “disgusting abomination” that would explode the U.S. deficit and “bankrupt America.” The bill is projected to add $2.5 trillion to the U.S. deficit over 10 years.
Musk claimed Trump wouldn’t have won the 2024 election without his support, calling the backlash “such ingratitude.”
Musk then alleged on X that Trump appears in the Epstein files. This marks a serious escalation (but we all thought this before Musk confirmed it right?)
Trump followed up on Truth Social by calling Musk “crazy” and hinting at cancelling federal contracts with his companies. Trump wrote that cancelling subsidies for Musk’s companies “could save billions,”.
Tesla has wiped out ~$100 billion in market value. Tesla now politically exposed?
Musk floated the idea of creating a new centrist political party, criticising both Democrats and MAGA Republicans. “We need a party that actually represents the interests of the people. Not lobbyists. Not legacy donors. Not extremists.”
SHORT Tesla, Bearish Chart SetupGood morning my fellow Cryptocurrency trader, I hope you are having a wonderful day. If you decide to call me a genius or whatever... The choice is yours to make.
Here, the TSLA stock (Tesla) is showing some weakness signals. Weakness that can translate into a drop.
Would you like me to point those out?
Ok, we can go through a few of them real-quick.
1) A rising wedge pattern. Always bearish.
2) Decreasing volume. Always bearish.
3) Resistance being confirmed at the 19-February peak.
4) Bearish bat.
These are just a few of the chart signals but it is not only about the signals, there is something in the air... I smell... Huh, what to call it? A flash crash? A market shakeout? A flush? A surprise? Or simply, a retrace?
I don't know... All I know is one thing, TSLA doesn't look bullish anymore.
The chart is saying down.
Let's see what kind of event shows up to match the chart.
Namaste.

5 stocks that shook the market in MayMay 2025 turned out to be a landmark month for the U.S. stock market. Several top companies posted impressive gains driven by explosive demand for AI technologies, advancements in autonomous transport, and strong corporate strategy.
Here are the five market leaders that set the tone in May:
1. Nvidia – The AI Powerhouse
Nvidia (#NVIDIA) surged 25% in May, becoming the most valuable U.S. company with a market cap of $3.45 trillion — surpassing even Microsoft. The rally was fueled by stunning data center results, with revenue hitting $39.1 billion (+427% YoY). Its new Blackwell chip series has already sparked massive interest from leading AI developers. UBS analysts raised their price target to $175, predicting further growth in high-performance computing.
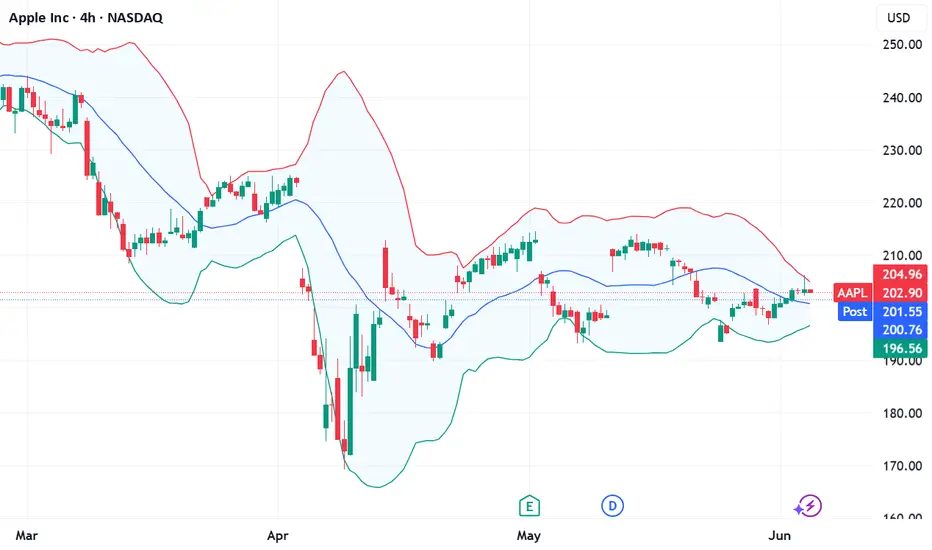
2. Apple – A return to growth
Apple (#Apple) saw a solid 7% gain, rebounding from earlier struggles. The company announced $500 billion in long-term investments over the next five years to create new jobs and manufacture AI servers in the U.S. This move restored investor confidence and supported the stock’s recovery.
3. Tesla – Robotaxis drive momentum
Tesla (#Tesla) jumped 25%, boosted by the announcement of its robotaxi launch in Austin, Texas, scheduled for June 12. Combined with improving market conditions and a pause in EU tariff pressure, Tesla shares reclaimed center stage. Wedbush analysts see potential for the stock to hit $500 as the company expands its autonomous and AI-driven initiatives.
4. Moderna – Biotech breakthroughs
Moderna (#Moderna) gained 7% following positive results from new cancer drug trials. The company also revealed plans to cut operational costs by $1.7 billion by 2027, aiming to boost overall efficiency. Investors welcomed the strategic pivot beyond COVID-related products.
5. Alcoa – Aluminum and geopolitics
Alcoa (#Alcoa) rose 6.5% on reports that the U.S. may ban aluminum imports from Russia. This geopolitical development, along with steady dividends and renewed investor interest in commodities, positioned Alcoa as a top-performing metals stock for the month.
May 2025 confirmed the market’s focus on AI, autonomous transport, biotech, and raw materials. Nvidia, Tesla, Apple, Moderna, and Alcoa led the charge — and FreshForex analysts recommend riding this momentum for active trading on high-performing stocks.
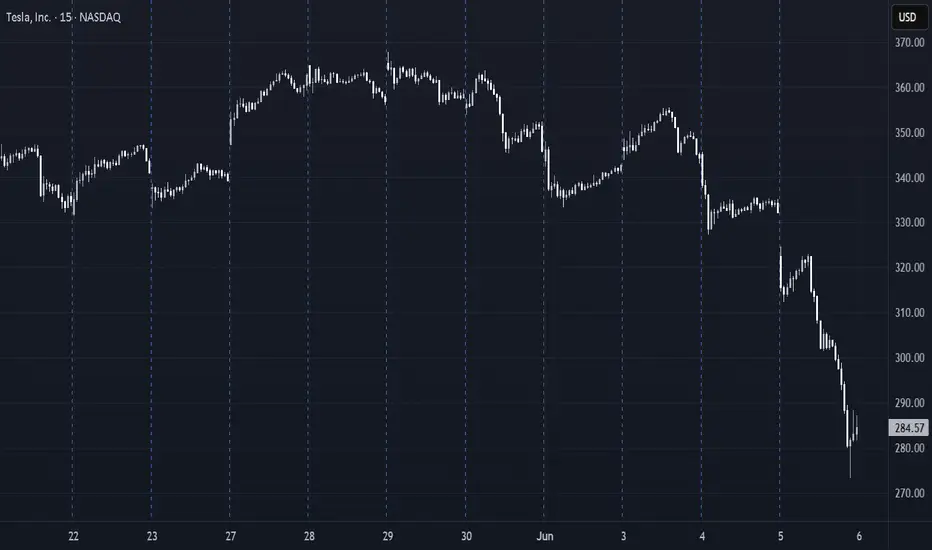
TSLA Weekly Options Outlook — June 3, 2025📉 TSLA Weekly Options Outlook — June 3, 2025
🚨 AI Model Consensus: Moderately Bearish into June 6 Expiry
🧠 Model Breakdown
🔹 Grok (xAI)
Bias: Bullish (Contrarian)
Setup: 5-min RSI oversold (~23.5); daily momentum weakening.
Trade: Buy $372.50C @ $0.88 → Bounce play
Confidence: 65%
🔹 Claude (Anthropic)
Bias: Bearish
Setup: Daily/M5 MACD bearish; RSI oversold; max pain magnet at $340
Trade: Buy $340P @ ~$5.55
Confidence: 75%
🔹 Llama (Meta)
Bias: Bearish
Setup: Below EMAs; RSI oversold; mixed longer-term read
Trade: Buy $342.50P @ $6.65
Confidence: 70%
🔹 Gemini (Google)
Bias: Bearish
Setup: Daily MACD bearish crossover; oversold short-term
Trade: Buy $320P @ $1.06
Confidence: 65%
🔹 DeepSeek
Bias: Bearish
Setup: MACD and EMAs confirm bearish setup; near max pain
Trade: Buy $340P @ $5.60
Confidence: 75%
✅ Consensus Summary
📉 4 of 5 models favor puts on TSLA
🧲 Max Pain at $340 is the dominant magnet
📉 Bearish MACD across timeframes; under EMAs
🔄 Short-term RSI is oversold — bounce risk acknowledged
📰 Mixed Tesla headlines & falling VIX offer minor support
🎯 Recommended Trade
💡 Strategy: Bearish Naked Weekly Put
🔘 Ticker: TSLA
📉 Direction: PUT
🎯 Strike: $340
💵 Entry: $5.60
🎯 Profit Target: $8.40 (+50%)
🛑 Stop Loss: $4.48 (−20%)
📏 Size: 1 contract
📅 Expiry: 2025-06-06
⏰ Entry Timing: Market Open
📈 Confidence: 73%
⚠️ Key Risks to Watch
🔄 Bounce Risk: RSI oversold — snapback could occur
📰 Tesla news (Powerwall, China) could surprise to upside
🧲 Max pain at $340 may anchor price near entry
⌛ Weekly theta decay means early move is essential
TSLATesla is in a correction phase, the price has a chance to test the support zone 246-218. If the price can stay above 218, it is expected that the price will have a chance to rebound. Consider buying the red zone.
🔥Trading futures, forex, CFDs and stocks carries a risk of loss.
Please consider carefully whether such trading is suitable for you.
>>GooD Luck 😊
❤️ Like and subscribe to never miss a new idea!
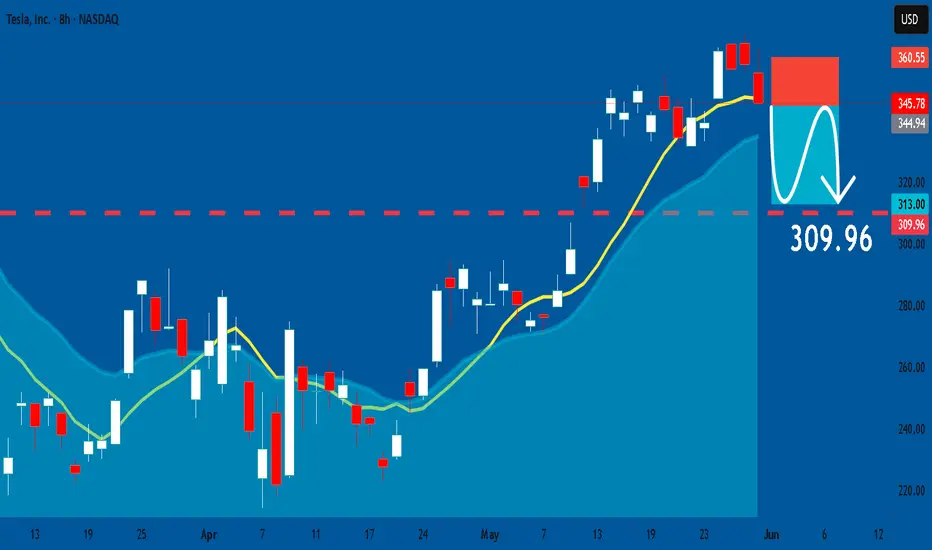
TESLA: Short Trade with Entry/SL/TP
TESLA
- Classic bearish formation
- Our team expects pullback
SUGGESTED TRADE:
Swing Trade
Short TESLA
Entry - 345.78
Sl - 360.55
Tp - 309.96
Our Risk - 1%
Start protection of your profits from lower levels
Disclosure: I am part of Trade Nation's Influencer program and receive a monthly fee for using their TradingView charts in my analysis.
❤️ Please, support our work with like & comment! ❤️