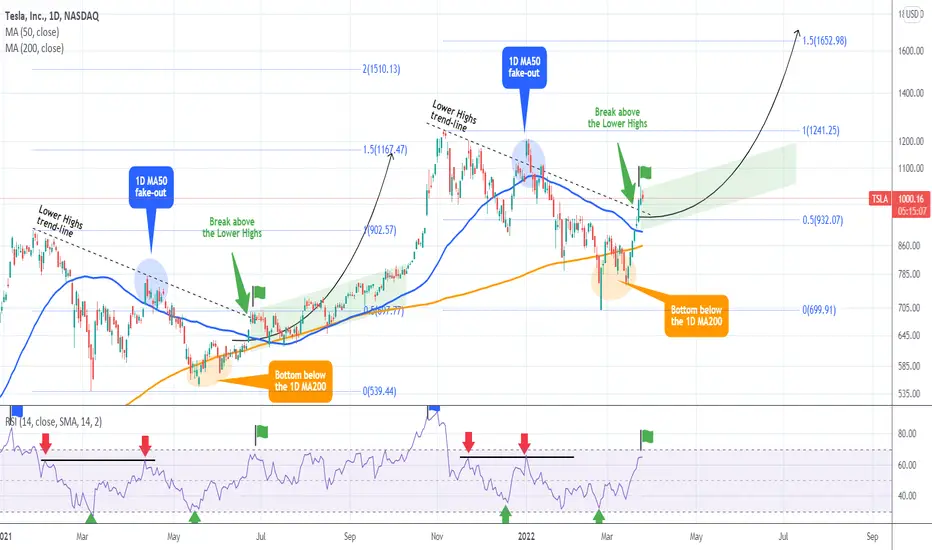
TESLA on a major bullish break-out. Possible $1500 target in Q3.Tesla (TSLA) broke this week above the All Time High (ATH) Lower Highs trend-line, giving a strong bullish signal. The pattern is replicating the break-out sequence of June 2021. In fact the whole Peak-Correction Cycle of January - June 2021 is identical to that of November 2021 - March 2022 (so far).
As this 1D chart shows, both patterns bottomed below the 1D MA200 (orange trend-line), with the RSI Double Bottoming around the 30.00 reading. What followed in July - September 2021 after the Lower Highs bullish break-out, was a slow Channel Up that ended violently with a parabolic rally just above the 1.5 Fibonacci extension level. That level is at $1650 from the recent market bottom so we are setting a target zone within $1500 - $1650 by the end of Q3.
* BONUS MATERIAL *
See how well another tech giant, Apple, is performing after our March 11 buy call exactly on the market bottom:
--------------------------------------------------------------------------------------------------------
** Please support this idea with your likes and comments, it is the best way to keep it relevant and support me. **
--------------------------------------------------------------------------------------------------------
Teslasignals
TESLA made its long-term bottom. $1400 Q3 target.TSLA touched last Friday both the 1D MA200 (orange trend-line) and the 1W MA50 (red trend-line). During the previous phase of the first 6 months of 2021, the price made a bottom when it hit this 1D MA200 - 1W M50 zone. In fact, as this chart shows, Tesla's price action since November is very similar to the first 6 months of 2021. The 1D RSI and MACD are identical, both phases made fake-outs above the 1D MA50 (blue trend-line), only to get rejected to a Lower Low.
In the previous phase, the price entered into a long-term buy when the 1D MA50 broke for the second time. As long as the 1D MA200/ 1W MA50 Support Zone holds, the 1D MA50 break-out shouldn't take long to happen. With every Higher High being a 0.5 Fibonacci extension level higher since September 2020, the next target to fill is the 3.5 Fib extension. We are setting a Q3 target on Tesla at $1400.
--------------------------------------------------------------------------------------------------------
** Please support this idea with your likes and comments, it is the best way to keep it relevant and support me. **
--------------------------------------------------------------------------------------------------------

TESLA - Now we see when to buy...
The green areas are planned as an accumulation.
If it penetrates green zone we will have to exit the position.


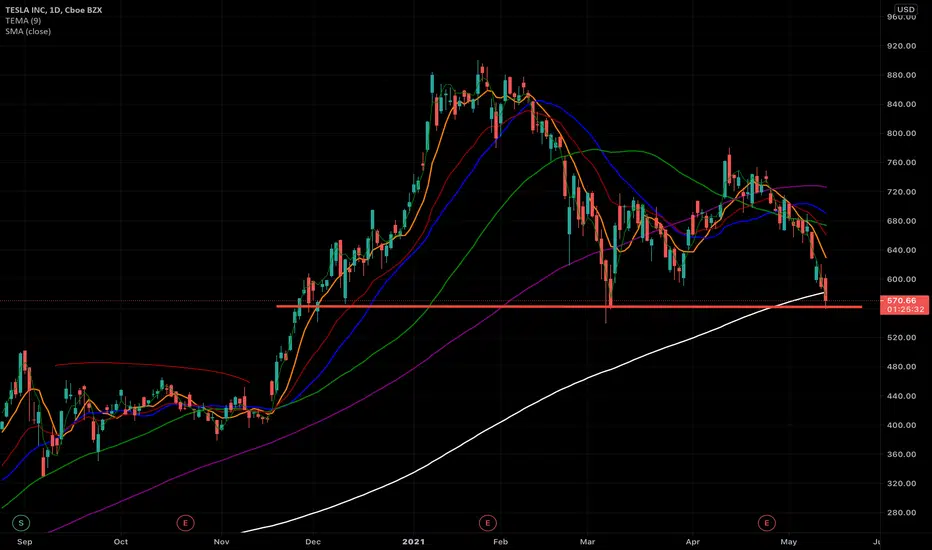
TESLA ! The moment of truth for Tesla who was in important support. If it passes below area 570, the fall can continue freely, only at 400 another major support appears. So eyes on Tesla, eyes on Musk !!
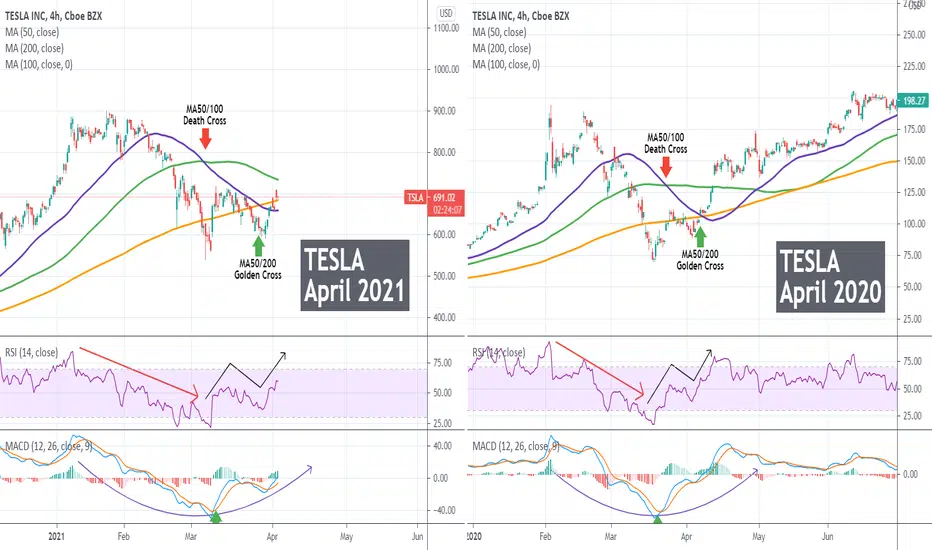
TESLA is repeating April 2020! Time to buy?As you see the two charts are fairly self-explanatory. Both in 2020 and now (2021), TSLA had already made a top by early February, formed a MA50/100 Death Cross, followed by a MA50/200 Golden Cross (on the 4H chart) that practically put the bottom behind. The RSI and MACD sequences are also fairly identical.
Is it time to buy the carmaker giant again?
** Please support this idea with your likes and comments, it is the best way to keep it relevant and support me. **
--------------------------------------------------------------------------------------------------------
!! Donations via TradingView coins also help me a great deal at posting more free trading content and signals here !!
🎉 👍 Shout-out to TradingShot's 💰 top TradingView Coin donor 💰 this week ==> xBTala
--------------------------------------------------------------------------------------------------------
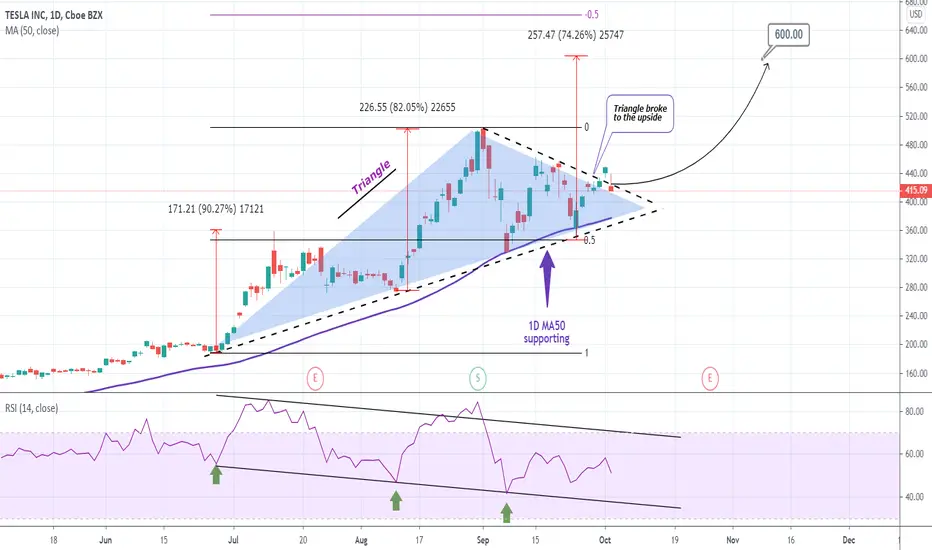
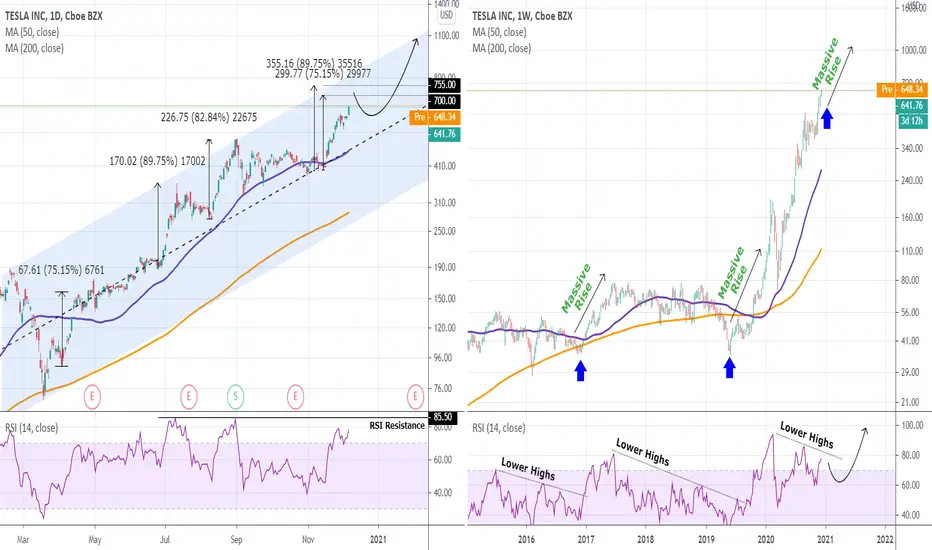
TESLA hit my $600 Target. What's next? $1000 eyed early 2021.Back in October when TSLA was coming out of its 1D Triangle, I posted the following idea with $600 as its Target:
Last week the Target got hit and yesterday we saw another big green candle (+7.13%). What does this mean for Tesla? Will it be extending the rally and for how long?
Personally I believe that as long as it is above the middle (dashed line) of the Channel Up that was created after the COVID collapse (left chart), it will be using the 1D MA50 (blue trend-line) as Support and rebound on every contact.
Since March every strong rise was within a +75% to +89% range. Assuming the same pattern is followed, we are looking at a price range within $700-755, before the next consolidation or pull-back to the 1D MA50. The RSI is also near its 6 month Resistance. Once this consolidation is over, the Channel Up shows a Higher High target at $1000 at least.
Needless to say, I am very bullish on the long-term on Tesla. The right chart is on the 1W time-frame, and the RSI shows a unique formation. Every time (since at least 2015) the 1W RSI breaks above a Lower Highs trend-line, a massive rise follows. This means that if the Lower Highs don't break now, the next pull-back might be the decisive to do so and start a new aggressive multi-month bullish leg.
** Please support this idea with your likes and comments, it is the best way to keep it relevant and support me. **
--------------------------------------------------------------------------------------------------------
!! Donations via TradingView coins also help me a great deal at posting more free trading content and signals here !!
🎉 👍 Shout-out to TradingShot's 💰 top TradingView Coin donor 💰 this week ==> TradingView
--------------------------------------------------------------------------------------------------------
TESLA 1D-TIMEFRAME ANALYSIS✨TESLA 1D-TIMEFRAME ANALYSIS✨
Hello ladies and gentlemen
This is my new idea for the TESLA
My idea is that the stock will go higher
Targets
620
780
I hope my idea is clear
Support me by like and share
Good luck💰💯

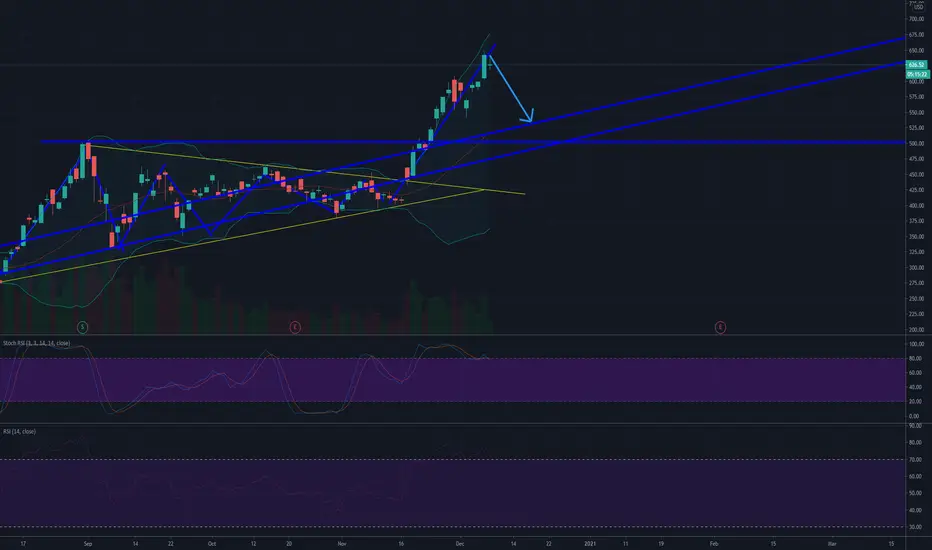
TESLA Bullish Break-outPattern: Triangle on 1D.
Signal: Buy as the Triangle broke above its Lower Highs trend-line.
Target: 600.00 (+74% rise/ arithmetic decline based on the previous rebounds).
** Please support this idea with your likes and comments, it is the best way to keep it relevant and support me. **
--------------------------------------------------------------------------------------------------------
!! Donations via TradingView coins also help me a great deal at posting more free trading content and signals here !!
🎉 👍 Shout-out to TradingShot's 💰 top TradingView Coin donor 💰 this week ==> godofuzzia
--------------------------------------------------------------------------------------------------------