Tesla (TSLA) Shares Break Above July HighTesla (TSLA) Shares Break Above July High
As the chart indicates, Tesla (TSLA) stock is demonstrating a pronounced upward trend. Specifically, its price:
→ has risen for four consecutive days;
→ has moved above its July high;
→ has gained over 10% since the start of August.
Why Is TSLA Rising?
Among other factors, TSLA’s share price is being driven by:
→ News that Tesla has extended the estimated delivery time for the Model Y from one–three weeks to four–six weeks (according to Barron’s). This may signal an increase in orders, boosting market optimism after the first two quarters showed a notable decline in electric vehicle sales.
→ Statements from Elon Musk regarding the development of the robotaxi project. According to him, Tesla’s robotaxi service will be publicly available next month. Musk also noted that Tesla has achieved several additional breakthroughs in artificial intelligence that will make car control remarkably similar to that of a human driver.
Can TSLA continue to rise?
Technical Analysis of TSLA Stock
When analysing the TSLA chart on 24 July, we identified a broadening triangle pattern with its axis around $317. Since then:
→ the price tested the lower boundary of the triangle and reversed upwards (as indicated by the arrow);
→ importantly, it broke through the upper boundary. This was made possible by the improvement in the fundamental backdrop (as reflected in the news), leading to a shift in market sentiment in favour of buyers.
Yesterday, the NASDAQ recorded the highest trading volume in August, with the daily candle closing below its midpoint – a sign of increased seller activity, further confirmed by the most recent long bearish candle on the hourly chart.
Given the above (as well as the RSI indicator approaching overbought levels), we could assume that TSLA’s share price could see a short-term correction following its rally in early August. Should the market follow this scenario, the price could pull back to the area highlighted in purple, which represents a significant support level, as it lies close to:
→ the upper boundary of the triangle (former resistance);
→ the lower boundary of the ascending channel (shown in blue);
→ the 50% retracement level of the A→B impulse;
→ price zones of strong upward movement (a bullish imbalance zone, as described by the Fair Value Gap pattern of the Smart Money Concept methodology).
This article represents the opinion of the Companies operating under the FXOpen brand only. It is not to be construed as an offer, solicitation, or recommendation with respect to products and services provided by the Companies operating under the FXOpen brand, nor is it to be considered financial advice.
Teslastockanalysis

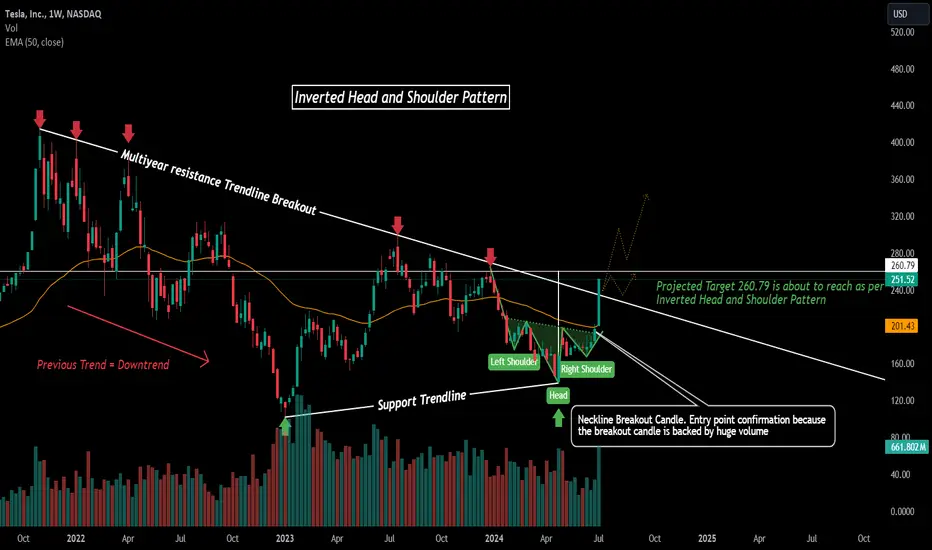
Tesla Analysis!NASDAQ:TSLA Analysis on a Weekly Timeframe!
Multiyear trendline breakout in Tesla!
Inverted Head and Shoulders Pattern formation at Support!
Neckline breakout in Tesla!
Of course we have missed the entry in a Tesla but take is as a learning. Where I have combined Multiyear Resistance trendline with Inverted Head and Shoulders Pattern. So what we need to do is ,Identify the chart pattern on a longer timeframe and after that on the event of breakout need to come down to lower timeframe. As I marked all the levels on a weekly timeframe but we can enter in the stock on a Daily Timeframe.
Disclaimer = Consider my analysis for Educational Purposes only.
Before entering into any trade -
1) Educate Yourself
2) Do your research and analysis
3) Define your Risk to Reward ratio
4) Don't trade with full capital
Tesla's stock has plummeted and broken the limit Tesla's stock has plummeted and broken the limit
This chart shows the weekly level candle chart of Tesla stock in the past two years. The top to bottom golden section at the end of 2021 is superimposed in the figure. As shown in the figure, Tesla's stock has plummeted and broken the limit for three consecutive weeks, falling below the 2.000 level of the top to bottom golden section in the figure, and is about to hit the strong support of 2.382 level! For a period of time in the future, Tesla's stock will be judged by the top to bottom golden split of 2.382 ($185.2) as the long short divide, with a strong range above it and a weak range below it!

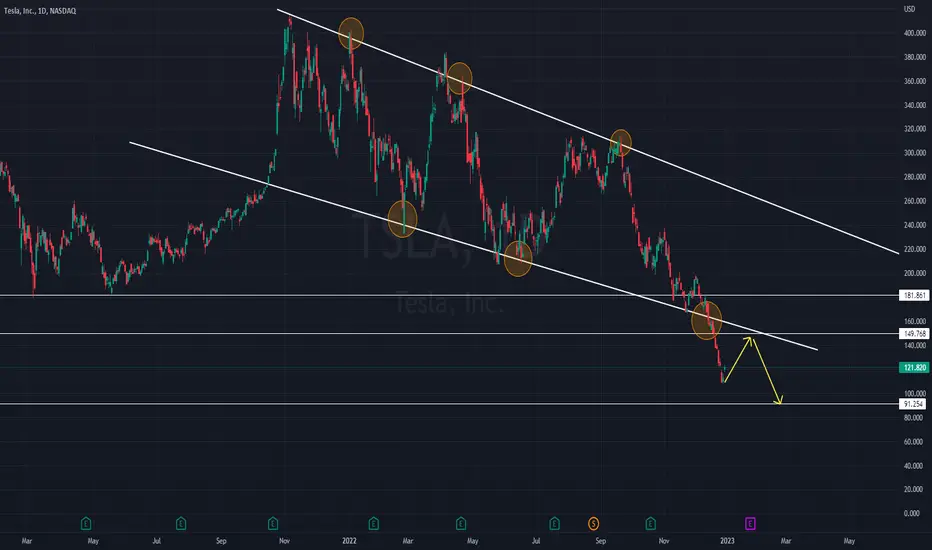
Some Recovery Expected Price have broken the channel ( Support ) some recovery from here is expected till about 146.00 area and then a drop - lower low till about 90s. Over all trend is still to the down side. Shorts in play, any rise is shorting opportunity for now.
Hit like & follow for more updates ;)