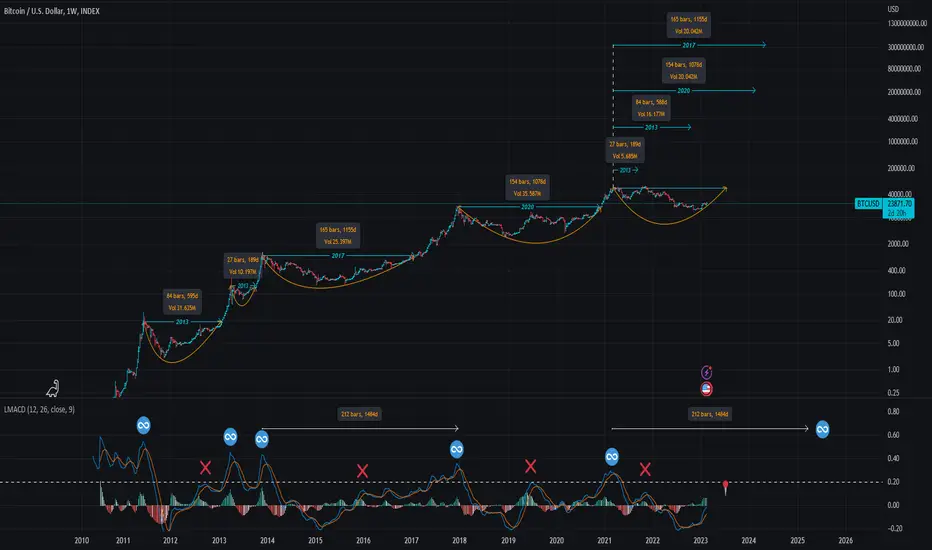
60k July forecast - and the end of Bitcoin Cycles is coming.The Bitcoin cycles get really repetitive once you layout the movements like I have here we start to see the patterns it creates.
I don't daily trade I don't recommend you to either, open your mind to a further time frame and setup prior to these movements giving you freedom to use lower leverage if you do trade.
I use the L-MACD (Logarithmic Moving Average Convergence/Divergence) with a simple trend line plotted at .20 points, what we can notice here with the momentum oscillator below 0.20 points is where Bitcoin trends for a good amount of months before making a fast rapid return to the average of the 0.20 trend line. A return the trend line repeating historic movements would put Bitcoin at around $60,000 by July-Aug 2023. Note the future bar lines are to be used for total days of movement prior to a bull market not the dollar values.
Where I positioned the red pin is where we should expect a red X to occur with momentum shifting from bearish to neutral, neutral then to bullish.
What people really forget about previous cycles is the 1/2 years prior to the peak of the market a very strong accumulation occurs, its happening right now. Don't be misguided by the second peak in the market it is irrelevant to the overall growth and movement of Bitcoin, every cycle has its theme and painting of a different picture but ultimately resulting in the same movement and growth into the next cycle.
When we return to $60,000 by July-Aug what would the high be in 2025-2026? lets take a look at previous psychology
-----------------------------
2011 $2.17
x570
2013 $1,240
-----------------------------
2015 $164
x120
2017 $19,770
-----------------------------
2020 $3,800
x18
2021 $69,000
-----------------------------
2022 $15,000
x72
2025 ? ($1,080,000)
-----------------------------
Elephant in the room, end of cycles is it coming? sadly yes. I hope we all can see the world past 2040 where "Bitcoin Cycles" will be seen as a period where this all started, kids of the future will wish they was around to see this unfolding in real time, some of course will think they could have made fortunes from it. Although Bitcoin Cycles will end, bull & bear markets will not.
Eventually Bitcoin will be worth $25,000,000 a single coin a lot compared to today's value right? but even a 1x of the future puts $25,000,000 to $50,000,000 that will be the new growth over decades.
The period where large financial institutions and wealthy sovereign states make the leap of allocating and becoming a holder of Bitcoin is where we will likely see a gigantic move unlike any other previously, this allocation once regulation is fully in place will shoot Bitcoins price beyond your imagination, this will sadly mark the end of the Bitcoin Cycles era and begin a new phase where bull markets last 10 years and bear markets 5 for example.
The final point to make here, we all have this information right in front of us, the network works and continues to grow stronger, governments are adopting Bitcoin, Gary Gensler marks it as a commodity, the largest institutions in the world have noted they are going to allocate with their funds and with clients once regulations finish the frame work.
Fidelity 4.5 trillion USD AUM
Blackrock 10 trillion USD AUM
Charles Schwab 7.13 trillion USD AUM to name a few
I see projections for cycles that even out around 2040, but what if this happens in 2030? that would mean a gigantic parabolic move comes before 2030 and Bitcoin could be in a bear market till 2035, 2020-2021 based on history with Bitcoin was the smaller cycle, the next cycle should be bigger and possibly could be the last.
Good luck and HODL.
Tether
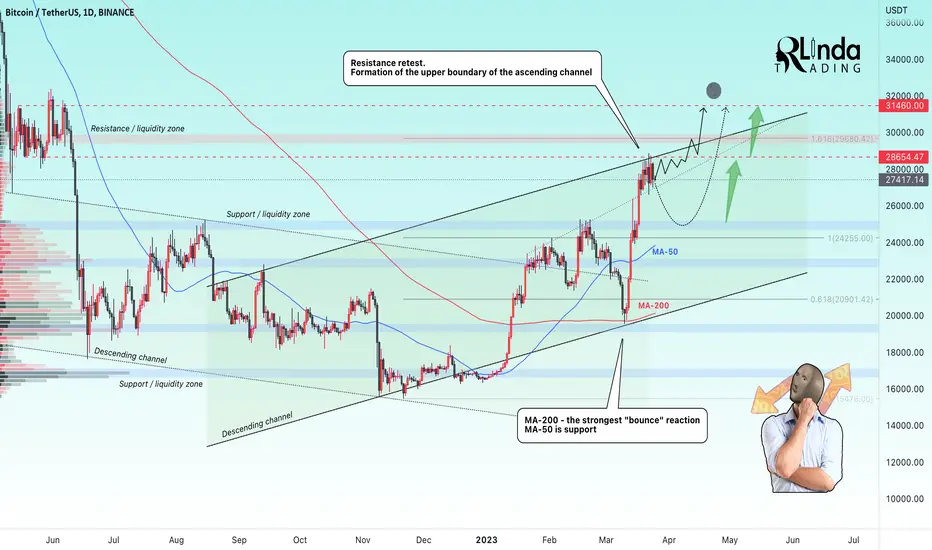
RLinda ! BTCUSD-> The coin went into consolidation. What's next?Bitcoin tests the high of 28868 and forms a correction, thereby presumably defining local resistance to the uptrend. The coin is in consolidation and let's try to figure out what to expect next
Geopolitical uncertainty and the ongoing banking crisis are factors contributing to Bitcoin's growing appeal as an alternative investment. The flagship cryptocurrency is increasingly separated from traditional financial markets, making it an attractive hedge against potential future crises.
In times of global banking panic and financial turmoil, Bitcoin offers a level of security and control as people can keep the asset in their hardware wallets.
The Fed's rate hike and a number of other economic fundamentals have had a bullish effect on the price, as the potential for global factors in the global economy affect BTC more strongly.
Also what is worth paying attention to:
-Historically, there is a positive correlation between changes in M2 money supply growth in the U.S. and the bitcoin exchange rate (most likely the reason for this is inflows into BTC due to the banking crisis)
-CNBC writes that crypto industry insiders remain bullish on BTC
-A new "supercycle" may be starting in BTC. Cryptocurrency now behaves stronger than many commodities and gold - Bloomberg Intelligence chief strategist
-Tether has printed another 1 billion.
In terms of technical analysis we have the following situation:
Bitcoin is most likely in an upward price channel. The price is testing the resistance of the uptrend range(confirms it)
The tested level of 28654 is currently a strong resistance area, which may stop the price growth for some time.
On the local chart, an upward triangle is forming (horizontal resistance 28390 and an upward support line starting in mid-January). Price is in consolidation within this range. A breakout of the support could drop the price to the liquidity zone of 24800-25000. But a breakout of the triangle resistance would send price to the retest of the 30000 and 31460 (liquidity zone)
Moving averages are acting as support
Currently, bitcoin is approaching the Fibo level of 0.236 (26700) - this level may affect the price (bullish), the next one is 0.382 at 25347, it is not considered at the moment)
Short-term outlook - consolidation, or technical rollback to the middle of the range, but medium and long-term outlook looks bullish: 30000, 31460, 35000, 40000
Regards R. Linda!
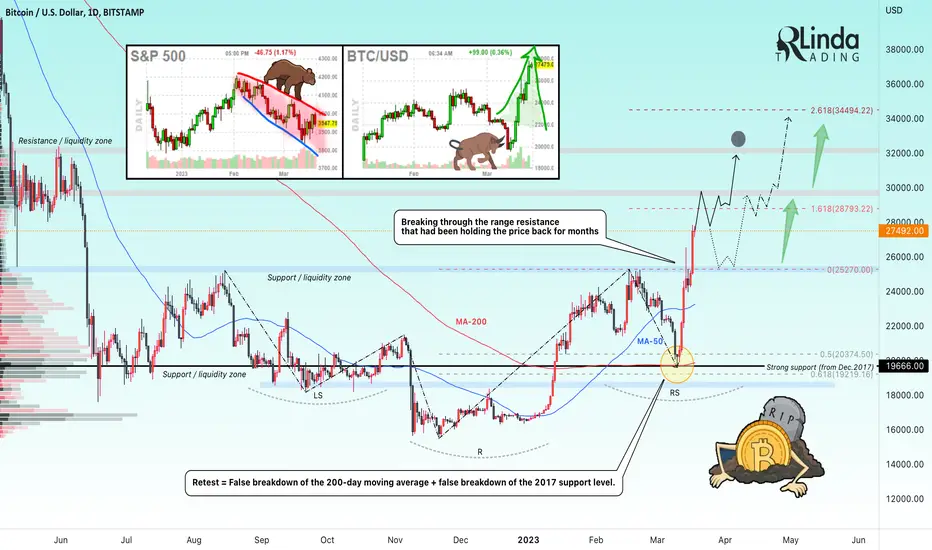
RLinda ! BTCUSD-> 27500 already. An impulse into the new range. BTCUSD - After plummeting to $19,700 last week, Flagship found support at its 200-day moving average , in the same area where the support level from 2017 passes . This area helped the flagship recover and overcome the previous resistance level of $25,200.
After a month of fluctuations, bitcoin is now in an uptrend, trading at $ 27,400 . The 200-day moving average provides strong support , suggesting that BTC could reach new yearly highs and approach the $28,800, $30,000, $32,000 and $34,000 levels.
Bitcoin's market capitalization is up $194 billion in 2023. Its 66% year-to-date growth has far outpaced Wall Street's leading bank stocks .
In addition, bitcoin separated from U.S. stocks for the first time in a year , its price up about 65% compared to the S&P 500's 2.5% rise in 2023 .
The banking crisis in the U.S ., which then spread to Europe, had a negative impact on bitcoin price dynamics late last week, when the asset's price fell below $20,000 for the first time in two months. However, as the new week began, the situation began to change . The cryptocurrency asset is breaking through a strong resistance zone, increasing its capitalization and renewing 10-month highs .
From a technical analysis perspective:
Bitcoin is breaking through and entering a new range, so to speak: " kicking a door down ". Strong momentum is forming towards liquidity density and testing the Fibo level of 1.618 at $28793 .
There is a possibility of a small pullback from this area, but in the medium term the upside potential to 30000 and 34000 may persist
Regards, R. Linda!
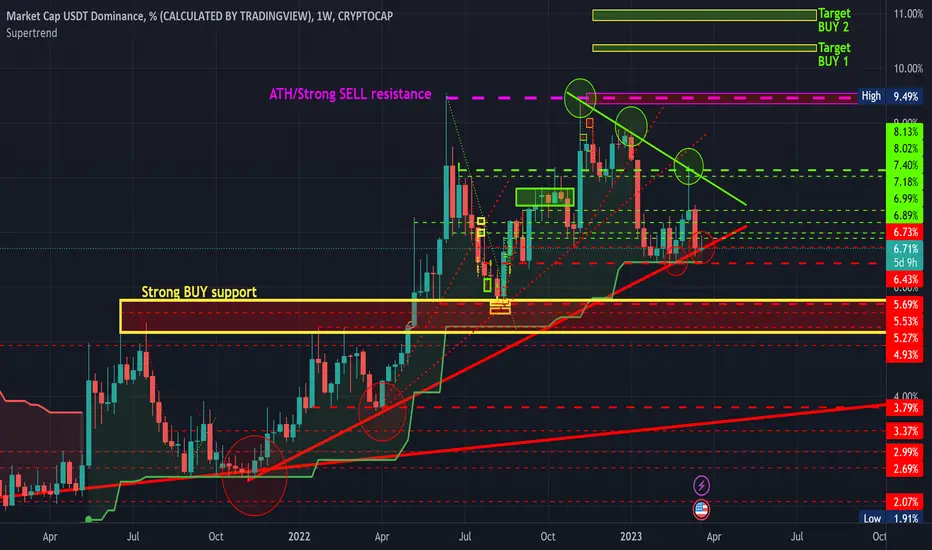
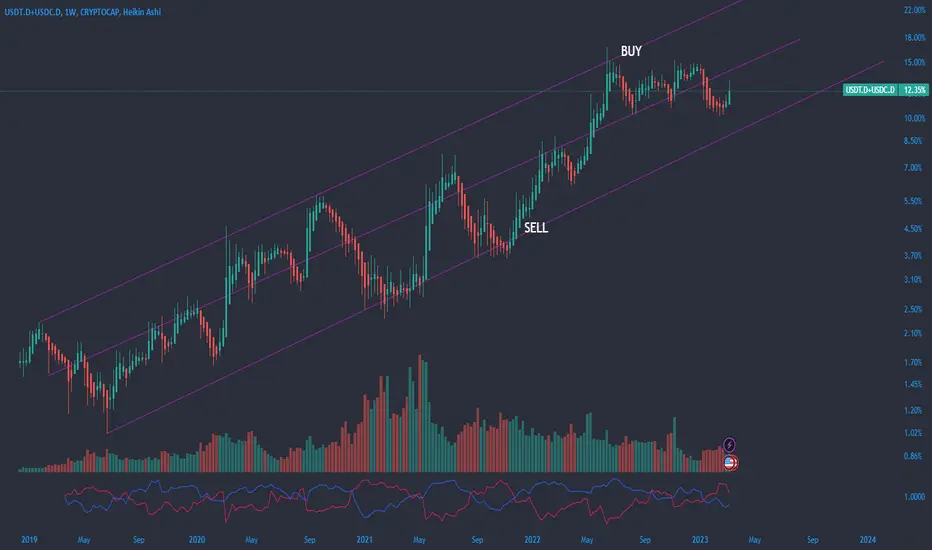
Tether Dominance - showing signs of pivotal movementUSDT Dominance is currently at a level of strong longer term trend SUPPORT (i.e. market resistance level).
Red circles represent contact with the current trend support which signals the selling of USDT (i.e. buys in the crypto market), with a current double bottom shown.
Green circles represent the current trend resistance hits and USDT sell-offs (crypto market rallies).
With the FOMC meeting starting today and concluding tomorrow, FED announcements will dictate "loss of this support" (market rally) or a "Bounce at support" (market sell-off).
📈 Tether Dominance Monthly, First Time Ever! (4.10% Next)This is the first time ever we look at Tether Dominance on the monthly timeframe.
This is extreme bearishness what I am seeing here.
Let's start at the end, the stage is set for a drop to 4.10% minimum, that's the conclusion.
I mentioned that this would translate to Bitcoin at around ~$40,000.
Notice the "~" symbol, which means more or less as it should range between $38,000 and $42,000 when the time comes, which is soon.
USDT.D already printed an upper wick and trading near the low of the current session/candle.
The current candle trades below EMA10 on a very, very strong bearish bias.
✔️We have a massive rising wedge that already broke bearish.
✔️We have lower highs long-term (more than 6 months).
✔️And volume going lower and lower.
The volume will only increase again when the major drop comes.
As USDT.D goes down, Bitcoin and the Altcoins goes up.
✔️ Please make sure to Boost to help with your support.
Thank you for reading.
Namaste.

📈 Tether Dominance Long-Term Bearish Trend ConfirmedLast week closed as an inverted hammer and this was the "last hooray".
EMA50 still stands as support but we have multiple lower highs since June 2022.
The weekly MACD just entered the bearish zone:
The weekly RSI is also showing a strong bearish bias:
All the USDT (Tether) will be used to buy Bitcoin and Altcoins.
Here we can see clearly on the daily timeframe how MA200 has been lost as support:
Below this level Tether Dominance is always bearish.
Notice bear volume being at its highest since November 2022 when USDT.D started to decline.
The next drop will send USDT.D to around 4.81%, a major drop.
This is the level it traded at around April 2022, this would mean Bitcoin trading at about $40,000.
There is strong support at this level just as Bitcoin will face strong resistance at $40k.
Everything is pointing in the same direction... Bitcoin will grow like the world is ending... But the world isn't ending, it is just the end of an era where a new financial system will emerge.
✔️ Bitcoin is the future of money.
✔️ Cryptocurrency is the future money.
✔️ Bitcoin is the present of money.
✔️ Bitcoin is very likely to save us from another 2008.
Namaste.

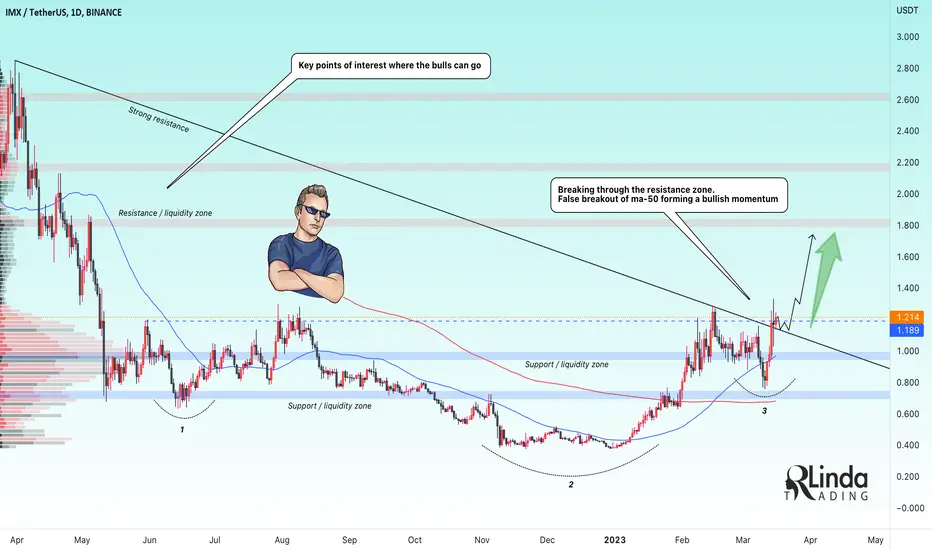
RLinda ! IMXUSDT-> The bulls are pulling aheadIMXUSDT is bursting ahead as bitcoin and the entire market strengthens. A false moving average breakout forms a liquidity grab and positive potential formation.
Price breaks through the 1.189 level and the strong downward resistance line. If the price successfully consolidates above the support level, the coin can shoot towards 1.1800 and reach the target fairly quickly. There is a void ahead. The odds are high.
I expect the bulls to be able to hold above the 1.189 level, in which case I will stick to the bullish potential in the medium term. My targets are 1.1800, 2.200
Regards to R. Linda!
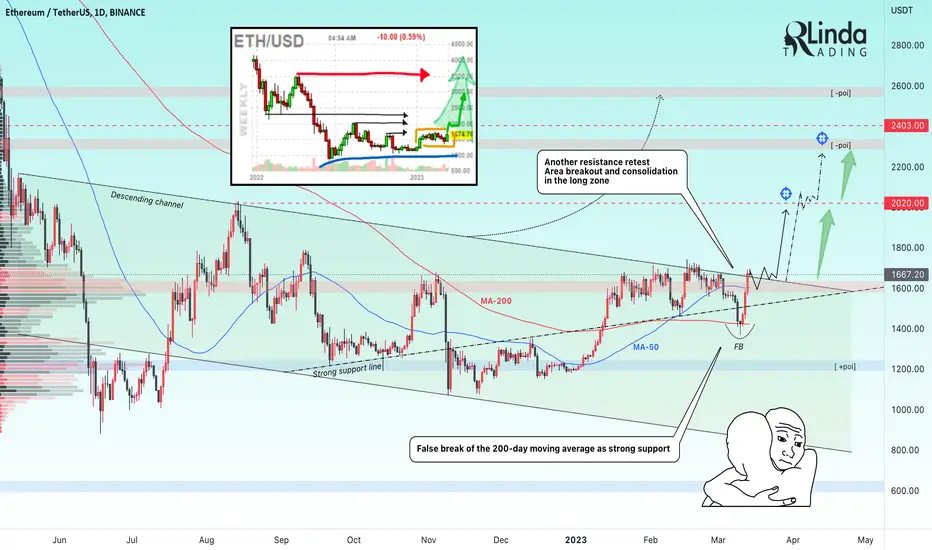
RLinda ! ETHUSD-> Rally, resistance breakthrough, consolidationETH began its rise on March 10 (after a false breakdown of the 200-day SMA). Cryptocurrency market rises on collapse of USA banking system - "banks collapse and that's what BTC was invented for" - Cryptocommunity.
Ethereum rose to $1,693 on March 13 after U.S. regulators backed faltering confidence in the banking sector with the closure of $209 billion Silicon Valley Bank (SVB) and $110 billion Signature Bank
On March 12, the U.S. Treasury Department, the Federal Reserve and the Federal Deposit Insurance Corporation assured SVB and Signature Bank depositors that they would get their money back. The regulators also noted that the U.S. government's bank deposit insurance fund would cover all deposits instead of the standard $250,000.
The intervention stopped depositors' panic and helped markets recover that suffered last week amid fears of a broader banking contagion, including cryptocurrencies. Ether, the second-largest cryptocurrency by market capitalization, also recovered and cut its March losses.
From the technical analysis point of view, we see strong buying after a false breakdown of the 200-day moving average, acting as a strong support. A pin bar which was formed sends the coin up to 1693 and it makes a total gain of almost 23.5%.
On the weekly chart, we see a fairly strong consolidation forming, but if you look closely, there is no decline. The price holds the range area, hence I conclude that the coin is accumulating liquidity to break through the tight resistance area.
At the moment, we see the price exiting the downward channel after another retest of the resistance area. A bullish price retention above the descending line will determine a bullish potential for ETH, and a medium-term veil of 2000.
I expect that in the near or medium term, the bulls will be able to retain the descending line and support area of 1650 to further strengthen the coin. The medium-term and long-term potential is 2020, 2200, 2400, 2600 and 3000.
Regards R. Linda!
Binance Coin Bear RunAll the markets, they all move in cycles.
They move up and down, up and down...
Look at the volume... It goes lower and lower before the final drop.
As the drop is happening bear volume starts to increase and it ends with strong bull volume showing up.
You don't see this type of volume when prices are set to grow.
We are now looking at Binance Coin's (BNBUSDT) bear run.
It will recover of course after the bear run is over, see the green arrow...
Make sure to support me in whatever way you want if you enjoy the content.
I am 100% crypto so my money will evaporate for sure, just like yours, and I never short my crypto-coins.
When the market goes down, your capital goes down.
When the market goes up, your capital goes up.
Be in the market.
Buy when red.
Sell when green.
That's all.
Namaste.

📈 Cryptocurrency Under Attack, More Problems AheadWell my friends, it seems the Cryptocurrency market is under attack from all fronts, and endless battle it seems.
Now the Stablecoins are under attack and it seems they are going to fight Tether (USDT), next.
I just saw this piece of news article, it links Russia to Tether and that's how it all starts: tradingview.sweetlogin.com
It says the Russian are using USDT, they will surely use this as an excuse to start some sort of banning which will end up affecting everyone... Or maybe not but that's how it always start.
We've been bearish on USDT.D for a long time as the chart shows but that's because people use Tether to buy Altcoins and Bitcoin , not due to this type of situation.
If there is an attack on Tether, another one, let's just hope it is something that doesn't bring down the market as whole.
Cryptocurrency is under attack from all fronts and it is technology that is only helping people, it is a technology for peace, innovation and exchanging value.
A means of payment like cash, gold, credit, wires and so on.
Stay safe.
Trade Bitcoin.
Namaste.

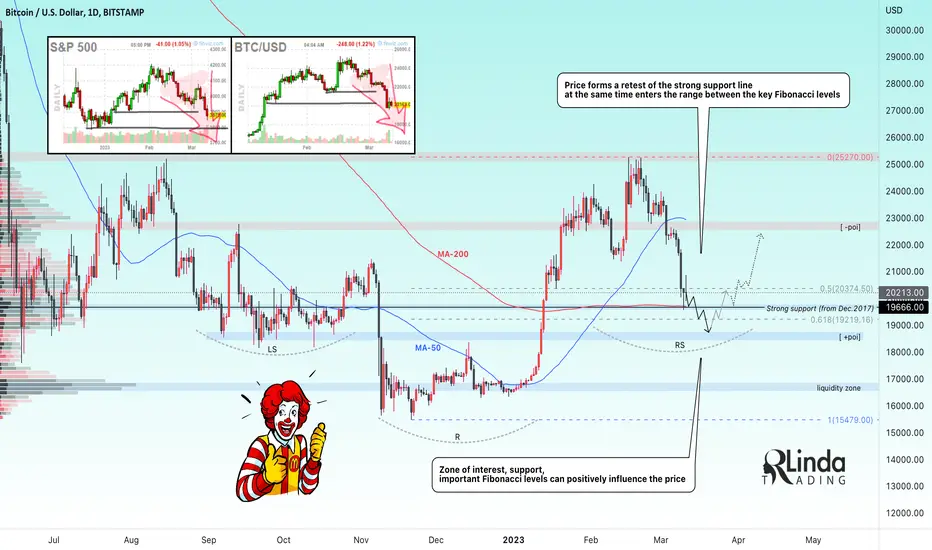
RLinda ! BTCUSD->Crash, Retest 0.5 Fibo and Powell's performanceBitcoin is in a phase of strong decline, the catalyst for which is the fundamental side of the global economy. The price may close the weekly session in a range between -10% and -12%. Let's figure out what's going on and what to expect in the medium term.
The sense of risk was tempered by Federal Reserve Chairman Jerome Powell's testimony , which signaled a potentially longer cycle of tightening.
In his testimony on Capitol Hill, Powell said that "if all the data pointed to the need for faster tightening, we would be willing to increase the pace of rate hikes." He also said that the Fed had not yet decided on the pace of interest rate hikes at its March 21-22 meeting.
Nevertheless, we have a coincidence in the structure of the daily market with the accumulation according to the wyckoff method:
Phase A (Price has passed this phase) : Stopping the previous downward movement (strong move). The approaching supply contraction is evidenced by the culmination of selling ( SC ) - the widening spread and high volume reflect the transition of a huge amount of liquidity from the large mass of players to the large professional investors. Once the pressure of intense selling eases, an automatic rally ( AR ) usually sets in. A successful secondary test ( ST ) in the SC area will show less selling than before, narrowing of the spread and a decrease in volume, usually stopping at or above the same price level as SC .
Phase B (Price at the end of phase two formation) :
At the beginning of phase two, price swings tend to be wide and accompanied by high volume . However, as professionals absorb supply, volume tends to decrease on dips within the range.
Large professional interests accumulate relatively inexpensive inventory in anticipation of the next markup. The institutional accumulation process can take a long time (sometimes a year or more) and involves buying the BTC asset at lower prices and checking for price increases with short sales.
During the second phase, several STs usually occur. In general, large investors are net buyers of the coin as the situation evolves, seeking to purchase as much as possible from the remaining floating supply. Institutional buying and selling creates a characteristic up-and-down price movement in the trading range .
Phase C : It is in Phase C that the stock price passes the decisive test of remaining supply, allowing the market maker and the big players to determine whether the market is ready to go up.
As noted earlier, the spring is a price move below range support that quickly reverses and moves back into the range - an example of a " bear trap " as falling below support would seem to signal the resumption of a downtrend . In reality, however, it marks the beginning of a new uptrend , trapping late sellers (bears) . A low-volume spring (or shakeout) indicates that bitcoin is probably ready to move up , so it is a good time to open at least a partial long position.
The appearance of an SOS shortly after a " spring " or " shakeout " confirms that the analysis is correct. However, supply testing can occur higher without a spring or shakeout.
Phase D : There follows a consistent dominance of demand over supply. During the fourth phase, the price moves to the upper end of the range. LPS in this phase is usually a great place to open or complement profitable long positions .
Phase E : In this phase, price moves out of resistance , demand is in complete control and growth is obvious to all !
From the point of view of technical analysis we have a downward movement which is based more on fundamental leverage:
The price has tested the strong support of 19666 , which was formed back in 2017 ( December )
There is a small price reaction in the form of a 6.5% recovery to 20900
In the medium term, there is a big chance of continuation of the fall if the price bounces down from the 0.5 Fibo level (20374) and returns to retest the strong support, in which case a retest of the 0.618 Fibo area (19219) or the 18500-18600 interest zone is evident.
Right now the price is in a range between 0.5 Fibo and 0.618 Fibo. After a strong drop, the price may form a consolidation in these boundaries.
Regards R. Linda!
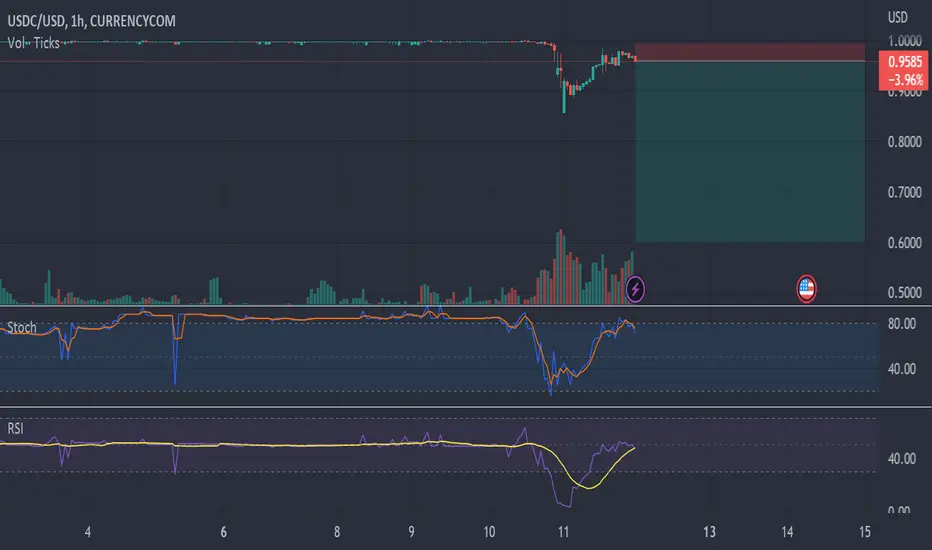
USDC SHORTUSDC has just DE pegged, and in my opinion will experience a full on crash this coming week.
Summary of BTC in 4Has you see it's ranging (accumulation)
overlap with OB4
Need to wait for good entry on 65% long

📈 Tether Dominance 25-Feb. Update = Bitcoin BullishFor this update, I left the chart from the 25-Feb. trade idea intact where I mention:
"Last time USDT.D found resistance at EMA50.
"Yesterday, the peak was hit at exactly this same level.
"This resistance is there but likely to be taken out."
USDT.D is now facing the next resistance in the form of EMA100, this one is stronger and less likely to be taken out.
In fact, I believe that this one will hold but let's see what the chart has to say as believes don't hold much value in this game.
The trading volume has been low and it is going lower.
The RSI is curving down and showing some bearish divergence.
Technically speaking, solely focusing on the chart, this resistance can also break but the next one at 7.51% is super strong and the last level, MA200.
Conclusion
We are seeing a bounce take place but the bearish bias remains strong.
The initial move is a bearish breakdown that happened in January, after a lower high in December.
This drop continues active below 8.77%.
But we are looking at a drop now and Bitcoin moving ahead.
If it moves to MA200 it should all still happen within a matter of days, say 5-9 days max and that's it for this bounce.
For those not familiar with why I am reading this chart.
Bitcoin (BTCUSD) and Tether Dominance (USDT.D) have an inverse relation.
When USDT.D drops, Bitcoin goes up.
When USDT.D goes up, Bitcoin drops.
USDT.D is now facing resistance as EMA100 and if this resistance holds, we get a continuation of the previous drop... And Bitcoin goes up.
Namaste.

📈 Tether Dominance Bounce vs Bitcoins Correction AnalysisTether Dominance produced a bounce and this isn't surprising as this is within normal price action.
Last time USDT.D found resistance at EMA50.
Yesterday, the peak was hit at exactly this same level.
This resistance is there but likely to be taken out.
If EMA50 is confirmed as resistance a second time the below analysis isn't necessary.
After EMA50 or 7.04% Tether Dominance faces another challenge in the form of EMA100 (7.31%) and MA200 (7.46%), these resistance level are likely to hold.
The candles can pierce a bit above these levels before dropping or it can drop before reaching said levels but these are very likely to be confirmed as resistance on the first try as it happened with EMA50.
MA200, the black line on the chart, is a long-term indicator and thus this resistance needs to be confirmed.
Since it is the first time that USDT.D moves below this level since April 2021, it is important to retest it before continuing lower.
Once a level is turned, in this case from support to resistance, it needs to be tested as resistance to see if it holds.
If it holds, the USDT.D long-term downtrend is confirmed and the index is set to move much lower.
If it doesn't hold, the downtrend is likely to be over and USDT.D can resume growing.
Our belief based on reading multiple charts all across is that this level will be confirmed as resistance.
It can happen sooner than expected but the timing is for the market to decide.
Bitcoin moved from $15,500 to $25,250, which makes it normal if any type of correction, short or strong shows up.
But after the correction continues the growth.
Bitcoin is ultra-bullish above $22,222.
Bitcoin remains extremely-bullish above $20,000.
Breaking below $20,000 would be a very bad signal but the bullish potential would remain intact above the late November 2022 low.
As long as Bitcoin continues trading above its November 2022 low, the bullish potential for higher highs and higher lows long-term remains active.
Namaste.

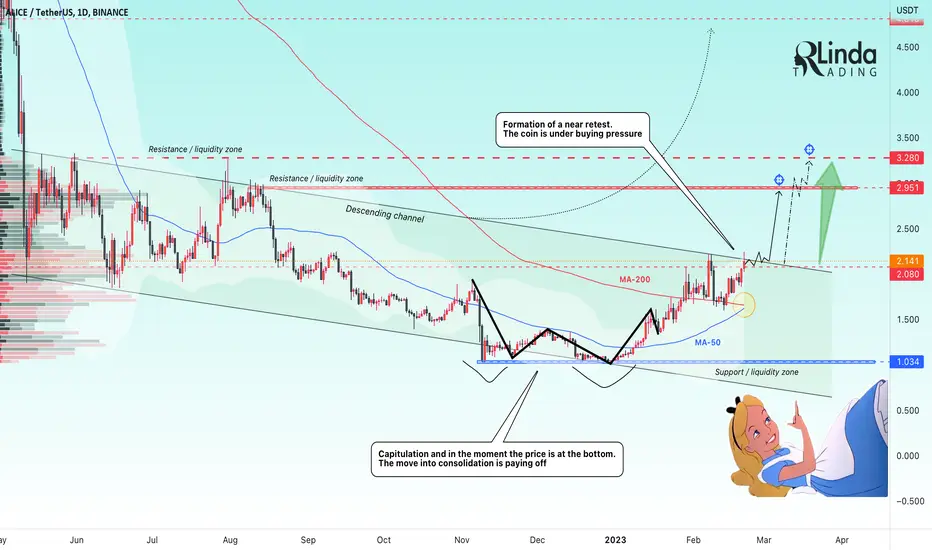
RLinda ! ALICEUSDT-> Bulls are testing resistance again Alice is showing a bullish mood on the chart. The price tested the 200-day moving average after the false-break and came back to retest the channel resistance.
In the center of the channel, you can clearly see the near touch zone of the two strong moving averages ma-200 and ma-50. The crossing will form a strong reversal signal.
The price, after a false breakdown of the red moving average, returns to the retest of the channel resistance line. I think the coin has a strong potential to overcome this area and further consolidation above the channel will open a potential for movement to 2.950 and 3.280
I expect in the nearest future breakdown of 2.080 and resistance area with further bullish momentum and reaching the above mentioned targets: 2.950 and 3.280. In the long-term prospect - 4.800.
Regards R. Linda!
📈 Tether Dominance Points LowerUSDT.D bounced from 2-Feb. to 14-Feb. finding resistance at EMA50 and producing a lower high.
EMA50 has been confirmed as resistance and this lower high will now lead to a lower low.
USDT.D is set to drop based on this MA analysis.
Also, the RSI is below 50 which is bearish.
The MACD below zero while printing a bearish cross.
These additional signals support a lower low.
As USDT.D goes down, Bitcoin and in this case the Altcoins mainly will go up.
Remember that just as the big Altcoins take turns with the smaller Altcoins, Bitcoin takes turn with the market as a whole.
Namaste.

Btc Analysis and Trade Idea💸 #Analysis #Trade 💸
📊 #BTC 1H-45min_ 15min
Follow the trend and wait for the trade confirmation.
➖➖➖➖➖➖➖➖
📗Order Type: Buy Limit (Not Active Yet)
🟡Ep 1=23400$
🟡Ep 2=23000$
⛔️Stop>22850$
➖➖➖➖➖➖➖➖
📕Order Type: Sell Limit
🟡Ep 1=25200$
🟡Ep 2=25450$
⛔️Stop> 25650$
➖➖➖➖➖➖➖➖
📊Powered By Smart Money Concept+Volume profile
🆚Risk/Reward Ratio:10
➖➖➖➖➖➖➖➖
👤 Analysis By Trader_Needs🦅
📅 2.19.2023
📫Get Free Access to Premium «Analysis + Trading Signals.»
USDT Dominance Bump and Run UpdateSo far we're flowing exactly how I expected. We just got a pullback... but we did not retest the running trendline (the trendline with the increased degree of rise).
We now look like we're on the move down after a little correction. The next few weeks will continue to give us clarity. Breaking some of the horizontal supports would increase confidence that the bull, at least short term, is back. These levels are:
1. ~6.5%
2. ~5.6%
3. ~5.0%
BTC USDT BUY (BITCOIN - TETHER US)Hi there.
Price is moving impulsively to the upside.
Wait for the price to form a continuation pattern and watch strong price action for buy.
LDO looks to be running out of steam (at least short-term)Hello Traders & Investors!
Here is a quick video going over the daily chart of BINANCE:LDOUSD for @hardikpatel1648
It looks to be forming a bear flag and the last bear flag played out, so I would look out below.
Let me know what you think and comment your own thesis below!
If you would like to make a request you can reach me here, or there is my Linktree on my profile where you can find all my contact info.

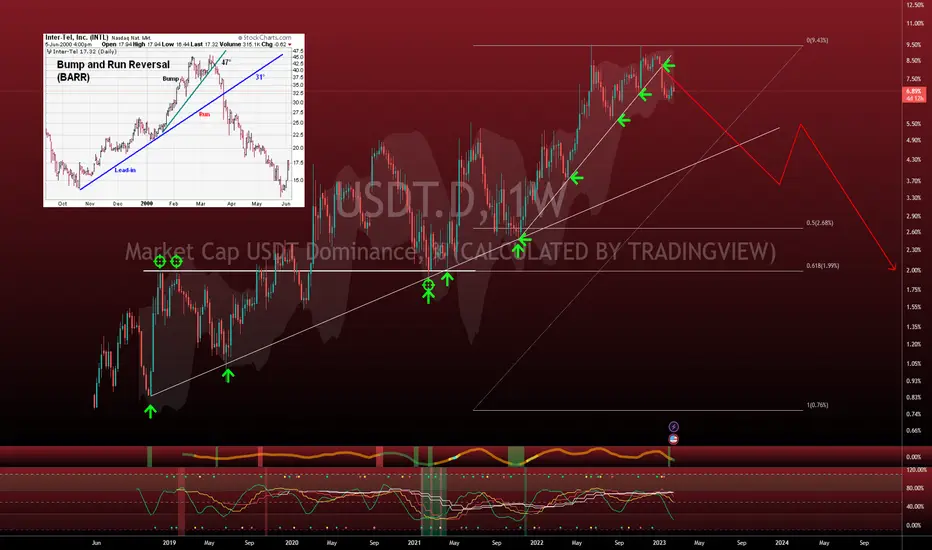
TETHER DOMINANCE - Bump and Run UpdateQuick update on the bump and run reversal idea that I posted several weeks ago right when we broke the trendline. At the time, I was super bullish on crypto in general because I've seen this structure play out many times in the past.
So far, TETHER dominance has continued to slide which is an indication that other crypto assets are continuing to rise. There are so many bears out there calling for a raid of the November lows and a push even lower.
I have one thing to say about all the mega bears out there. If you ignore all the major movements and just sit and wait for a single trade that is going to make you rich, then you aren't going to make it. You have to harness the moment and take advantage of the major moves that the market gives you on a regular basis. Sure, you'll be wrong sometimes, but if you rely on 1 or 2 trades to make you rich, then one of two things will happen:
1. You won't get your dream position
2. You're going to get demolished and end up losing anyway
I've seen it over and over again. Harness the trend and realize when there's a trend change. Take advantage of it and know when numerous instruments are telling you things are changing.
