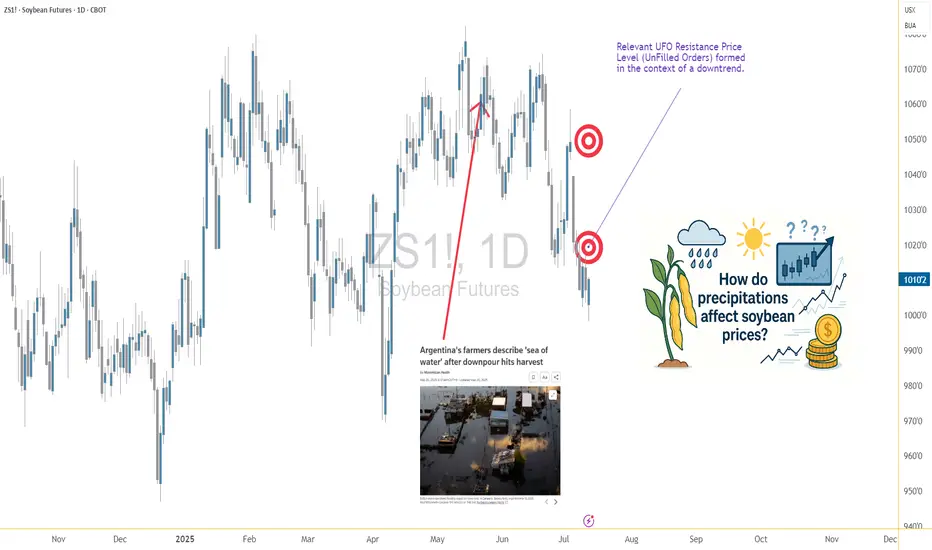
Soybeans and Rain: Moisture’s Market Impact on the Bean Trade1. Introduction: Moisture & Market Momentum
Soybeans, often referred to as “the oilseed king,” are a cornerstone of global agriculture. As a leading source of protein for both humans and animals, their price fluctuations affect industries ranging from food production to biofuels. One key variable traders often monitor? Rainfall. 🌧️
Moisture plays a critical role in soybean development, influencing yield and quality from the moment the seed is sown. It’s no surprise that many market participants assume a strong correlation between rainfall and price behavior. But is that assumption truly supported by data?
In this article, we analyze how varying precipitation levels impact weekly soybean futures returns. As you'll see, the results might not be as clear-cut as you’d expect—but they still offer meaningful insights.
2. Biological Realities: Soybeans’ Water Needs
Soybeans thrive under specific conditions. While they’re generally resilient, rainfall—or the lack thereof—can tip the balance between bumper harvests and disappointing yields.
During early vegetative stages, sufficient moisture ensures healthy root development. Later, during the pod-fill phase, rainfall becomes even more essential. Too little water at this point leads to incomplete pods or aborted seeds. On the flip side, too much rain can invite fungal diseases and delay harvests, especially in lower-lying regions.
In countries like Brazil and Argentina, soybean fields often face seasonal extremes, while the U.S. Midwest typically enjoys more consistent conditions—though droughts and floods have both hit the Corn Belt in recent years. These environmental realities create natural volatility in both yield and pricing expectations.
3. Methodology: How We Analyzed Weather vs. Futures
To explore the potential connection between rainfall and soybean futures prices, we collected weekly weather data for major soybean-growing cities across the globe. Each week’s precipitation was categorized using a normalized percentile system:
Low Rainfall: below the 25th percentile
Normal Rainfall: between the 25th and 75th percentiles
High Rainfall: above the 75th percentile
We then matched this data against weekly returns of standard soybean futures (ZS) and micro soybean futures (MZS), both traded on the CME Group.
This allowed us to compare average price behavior in different rainfall scenarios—and test whether there was any statistically significant difference between dry and wet weeks.
4. Statistical Findings: Is There a Signal in the Noise?
When examining the data, the initial visual impression from boxplots was underwhelming—return distributions across rainfall categories looked surprisingly similar. However, a deeper dive showed that the difference in mean returns between low and high precipitation weeks was statistically significant, with a p-value around 0.0013.
What does that mean for traders? While the signal may not be obvious to the naked eye, statistically, rainfall extremes do impact market behavior. However, the magnitude of impact remains modest—enough to be part of your strategy but not enough to drive decisions in isolation.
Soybean prices appear to be influenced by a mosaic of factors, with precipitation being just one tile in that complex picture.
5. Charting the Relationship: Visual Evidence
While statistical tests gave us the green light on significance, we know traders love to “see” the story too. Boxplots of weekly soybean futures returns segmented by rainfall categories offered a subtle narrative:
Low-precipitation weeks showed slightly higher average returns and tighter interquartile ranges.
High-precipitation weeks had broader return distributions and more frequent downside outliers.
Normal weeks exhibited relatively stable behavior, reinforcing the idea that the market reacts most during extremes.
This kind of visualization may not scream alpha at first glance, but it reinforces the idea that precipitation events—particularly dry spells—tend to nudge prices upward, possibly as market participants price in production risk.
6. Trading Implications: Positioning Around Weather
Here’s where things get practical. While weather alone won’t dictate every trading decision, it can be a key filter in a broader strategy. For soybean traders, rainfall data can help inform:
Bias assessment: Low-precipitation weeks may suggest bullish tendencies.
Risk control: Expect wider return distributions in high-precip weeks—adjust stops or contract sizing accordingly.
Event trading: Pair weather anomalies with technical signals like trendline breaks or volume surges for potential setups.
It’s also worth noting that weekly weather forecasts from reputable sources can serve as a forward-looking indicator, giving traders a head start before the market fully reacts.
7. Margin Efficiency with Micro Soybeans
For traders looking to scale into soybean exposure without the capital intensity of full contracts, the CME Group’s micro-sized futures offer a compelling alternative.
📌 Contract Specs for Soybean Futures (ZS):
Symbol: ZS
Contract size: 5,000 bushels
Tick size: 1/4 of one cent (0.0025) per bushel = $12.50
Initial margin: ~$2,100 (varies by broker and volatility)
📌 Micro Soybean Futures (MZS):
Symbol: MZS
Contract size: 500 bushels
Tick size: 0.0050 per bushel = $2.50
Initial margin: ~$210
These smaller contracts are perfect for strategy testing, risk scaling, or layering exposure around key macro events like WASDE reports or weather disruptions. For traders aiming to build weather-aligned positions, MZS is a powerful tool to balance conviction with capital efficiency.
8. Wrapping It All Together
Rain matters. Not just in fields, but in futures prices too. While soybean markets may not overreact to every drizzle or downpour, extreme rainfall conditions—especially drought—can leave noticeable footprints on price action.
For traders, this means opportunity. By incorporating precipitation metrics into your workflow, you unlock a new layer of context. One that doesn’t replace technical or fundamental analysis, but enhances both.
And remember: this article is just one piece of a larger exploration into how weather affects the commodity markets. Make sure you also read prior installments.
When charting futures, the data provided could be delayed. Traders working with the ticker symbols discussed in this idea may prefer to use CME Group real-time data plan on TradingView: tradingview.sweetlogin.com - This consideration is particularly important for shorter-term traders, whereas it may be less critical for those focused on longer-term trading strategies.
General Disclaimer:
The trade ideas presented herein are solely for illustrative purposes forming a part of a case study intended to demonstrate key principles in risk management within the context of the specific market scenarios discussed. These ideas are not to be interpreted as investment recommendations or financial advice. They do not endorse or promote any specific trading strategies, financial products, or services. The information provided is based on data believed to be reliable; however, its accuracy or completeness cannot be guaranteed. Trading in financial markets involves risks, including the potential loss of principal. Each individual should conduct their own research and consult with professional financial advisors before making any investment decisions. The author or publisher of this content bears no responsibility for any actions taken based on the information provided or for any resultant financial or other losses.
The Futures Leap
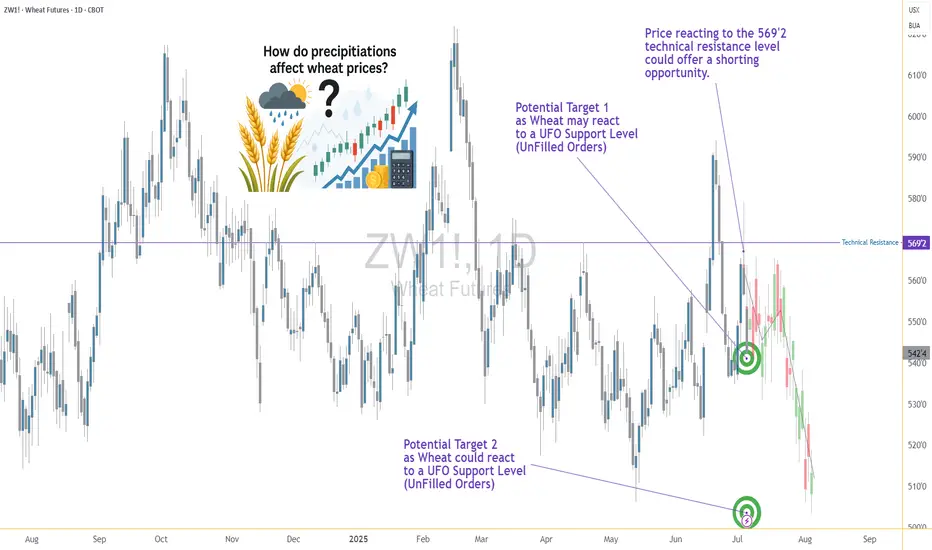
Rain or Ruin? Analyzing Wheat Prices During Precip Extremes1. Introduction: When Rain Means Risk for Wheat Traders
Rain is life for wheat crops—until it isn’t. In the world of agriculture, water is essential, but extremes in precipitation can cause just as much harm as droughts. For traders in the wheat futures market, understanding this relationship between rainfall and price action is not just useful—it’s essential.
Wheat is a crop with a long growth cycle, grown across diverse geographies like the U.S. Plains, the Canadian Prairies, Russia, and Ukraine. Each region has its own precipitation rhythm, and any disruption can ripple through the global supply chain. The question is: can weather signals—especially rainfall—be used to predict market behavior?
This article dives into that question using a data-driven lens. We categorized precipitation data and measured how wheat futures returns responded to different rainfall environments. The results? Revealing, and at times, counterintuitive.
2. The Role of Rainfall in Wheat Production
Wheat, especially spring and winter varieties, is particularly sensitive to soil moisture levels at key phases like germination, tillering, and heading. Too little rain in early development and the crop can fail to establish. Too much rain close to harvest? Risk of disease, sprouting, and quality degradation.
Traders have long known that unexpected wet or dry weeks can trigger speculative surges or hedging activity. But how do these events influence actual futures returns?
Before answering that, we need to translate rain into something traders can use: categories based on historical norms.
3. Methodology: Categorizing Rainfall and Measuring Market Response
To understand how wheat prices respond to different levels of rainfall, we analyzed weekly precipitation data across global wheat-producing regions. We normalized the data using percentiles:
Low Precipitation: Below the 25th percentile
Normal Precipitation: Between the 25th and 75th percentiles
High Precipitation: Above the 75th percentile
We then matched this categorized weather data with weekly returns from wheat futures (symbol: ZW) to explore if price behavior systematically varied depending on how wet or dry a week had been.
To test significance, we used a simple t-test comparing the mean returns of low-precip and high-precip weeks. The p-value (6.995E-06) revealed a compelling result: yes, there is a statistically significant difference.
4. Results: High Rainfall, Higher Price Volatility
The data confirms that weeks with extreme rainfall—especially those with high precipitation—often align with more volatile wheat price movements.
But here’s the twist: while low-precip weeks didn’t consistently show bullish returns, high-precip weeks correlated with negative or erratic returns. That makes sense when you think about harvest delays, rot, and declining grain quality.
Traders watching forecasts for excessive rainfall should consider the implications for grain availability and price stabilization mechanisms. This is where speculative plays or hedging via options and standard or micro futures contracts can become especially useful.
5. Interpreting the Volatility: Why the Market Reacts to Rain
Why does excessive rain lead to such uneven price behavior?
The answer lies in uncertainty. Heavy rainfall often introduces multiple variables into the equation: planting delays, logistical bottlenecks, and downgraded wheat quality due to fungal infections. For example, a wet harvest can reduce protein content, pushing millers to seek alternatives—altering both demand and supply expectations simultaneously.
This dual-sided pressure—reduced high-quality yield and uncertain export capability—tends to shake market confidence. Traders respond not just to the supply data but also to how much trust they place in the supply pipeline itself.
6. Futures Contracts: Navigating Risk with Position Size Control
Traders looking to participate in wheat price action have two main CME-listed options:
Standard Wheat Futures (ZW)
Contract Size: 5,000 bushels
Tick Size: 1/4 cent per bushel (0.0025) has a $12.50 per tick impact
Margin Requirement: Approx. $1,700 (subject to change)
Micro Wheat Futures (MZW)
Contract Size: 500 bushels (1/10th the size of the standard contract)
Tick Size: 0.0050 per bushel has a $2.50 per tick impact
Margin Requirement: Approx. $170 (subject to change)
Micro contracts like MZW offer a lower-cost, lower-risk way to trade wheat volatility—perfect for sizing into weather-related trades with precision or managing risk in a more granular fashion. Many traders use these contracts to test strategies during seasonal transitions or while responding to forecast-driven setups.
7. Visual Evidence: Price Behavior by Precipitation Category
To visually represent our findings, we used box plots to show wheat weekly returns grouped by precipitation category:
The shape of these distributions is revealing. High-precipitation weeks not only show lower average returns but also a wider range of possible outcomes—underscoring the role that rainfall extremes play in price volatility rather than just directional bias.
We are also complementing this visual with a weather map that shows real-time precipitation patterns in major wheat-growing regions. This could help traders align weather anomalies with trading opportunities.
8. Final Thoughts: The Forecast Beyond Forecasts
Precipitation isn’t just an agricultural concern—it’s a market catalyst.
Our analysis shows that rainfall extremes, particularly heavy rain, create meaningful signals for wheat traders. The price response is less about direction and more about uncertainty and volatility, which is equally important when structuring trades.
If you’re serious about trading wheat futures, don’t just watch the charts—watch the clouds.
This article is one piece in our broader series on how weather influences ag futures. Stay tuned for the next one, where we continue to decode the atmosphere’s impact on the markets.
When charting futures, the data provided could be delayed. Traders working with the ticker symbols discussed in this idea may prefer to use CME Group real-time data plan on TradingView: tradingview.sweetlogin.com - This consideration is particularly important for shorter-term traders, whereas it may be less critical for those focused on longer-term trading strategies.
General Disclaimer:
The trade ideas presented herein are solely for illustrative purposes forming a part of a case study intended to demonstrate key principles in risk management within the context of the specific market scenarios discussed. These ideas are not to be interpreted as investment recommendations or financial advice. They do not endorse or promote any specific trading strategies, financial products, or services. The information provided is based on data believed to be reliable; however, its accuracy or completeness cannot be guaranteed. Trading in financial markets involves risks, including the potential loss of principal. Each individual should conduct their own research and consult with professional financial advisors before making any investment decisions. The author or publisher of this content bears no responsibility for any actions taken based on the information provided or for any resultant financial or other losses.
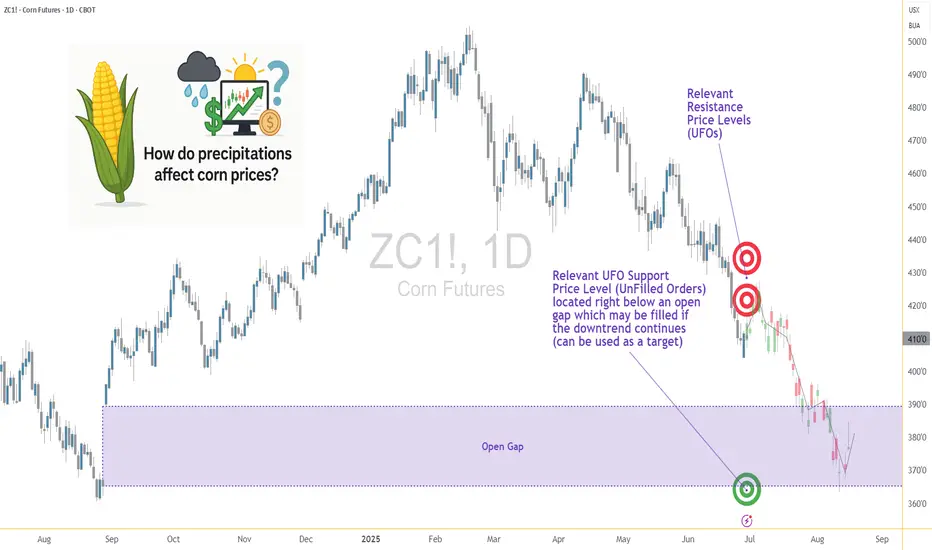
Weather and Corn: Understanding the Precipitation Factor1. Introduction: Rain, Grain, and Market Chain Reactions
In the world of agricultural commodities, few forces carry as much weight as weather — and when it comes to corn, precipitation is paramount. Unlike temperature, which can have nuanced and sometimes ambiguous effects depending on the growth stage, rainfall exerts a more direct and consistent influence on crop performance. For traders, understanding the role of rainfall in shaping market sentiment and price behavior isn't just an agricultural curiosity — it's a trading edge.
This article unpacks the relationship between weekly rainfall levels and corn futures prices. By leveraging normalized weather data and historical returns from Corn Futures (ZC), we aim to translate weather signals into actionable market insights. Whether you're managing large agricultural positions or exploring micro futures like MZC, precipitation patterns can provide vital context for your trades.
2. Corn’s Moisture Dependency
Corn is not just sensitive to water — it thrives or suffers because of it. From the moment seeds are planted, the crop enters a delicate dance with precipitation. Too little moisture during the early stages can impair root development. Too much during germination may lead to rot. And during pollination — particularly the tasseling and silking stages — insufficient rainfall can cause the plant to abort kernels, drastically reducing yield.
On the other hand, excessive rainfall isn't necessarily beneficial either. Prolonged wet periods can saturate soil, hinder nutrient uptake, and encourage fungal diseases. Farmers in the U.S. Corn Belt — particularly in states like Iowa, Illinois, and Nebraska — know this well. A single unexpected weather shift in these regions can send ripple effects across global markets, causing speculators to reassess their positions.
For traders, these weather events aren’t just environmental footnotes — they are catalysts that influence prices, volatility, and risk sentiment. And while annual production is important, it's the week-to-week rhythm of the growing season where short-term trades are born.
3. Our Data-Driven Approach: Weekly Rainfall and Corn Returns
To understand how rainfall impacts price, we collected and analyzed decades of historical weather and futures data, aligning weekly precipitation totals from major corn-growing regions with weekly returns from Corn Futures (ZC).
The weather data was normalized using percentiles for each location and week of the year. We then assigned each weekly observation to one of three precipitation categories:
Low rainfall (<25th percentile)
Normal rainfall (25th–75th percentile)
High rainfall (>75th percentile)
We then calculated the weekly percent change in corn futures prices and matched each return to the rainfall category for that week. The result was a dataset that let us measure not just general trends but statistically significant shifts in market behavior based on weather. One key finding stood out: the difference in returns between low-rainfall and high-rainfall weeks was highly significant, with a p-value of approximately 0.0006.
4. What the Numbers Tell Us
The results are striking. During low-rainfall weeks, corn futures often posted higher average returns, suggesting that the market responds to early signs of drought with anticipatory price rallies. Traders and institutions appear to adjust positions quickly when weather models hint at below-normal moisture during key growth stages.
In contrast, high-rainfall weeks displayed lower returns on average — and greater variability. While rain is essential, excess moisture raises fears of waterlogging, planting delays, and quality issues at harvest. The futures market, ever forward-looking, seems to price in both optimism and concern depending on the volume of rain.
Boxplots of these weekly returns reinforce the pattern: drier-than-usual weeks tend to tilt bullish, while wetter periods introduce uncertainty. For discretionary and algorithmic traders alike, this insight opens the door to strategies that incorporate weather forecasts into entry, exit, and risk models.
📊 Boxplot Chart: Weekly corn futures returns plotted against precipitation category (low, normal, high). This visual helps traders grasp how price behavior shifts under varying rainfall conditions.
5. Strategy: How Traders Can Position Themselves
With the clear statistical link between rainfall extremes and price behavior in corn futures, the logical next step is applying this insight to real-world trading. One straightforward approach is to incorporate weather forecast models into your weekly market prep. If a key growing region is expected to receive below-normal rainfall, that could serve as a signal for a potential bullish bias in the upcoming trading sessions.
This doesn’t mean blindly buying futures on dry weeks, but rather layering this data into a broader trading thesis. For example, traders could combine weather signals with volume surges, technical breakouts, or news sentiment to form confluence-based setups. On the risk management side, understanding how price behaves during extreme weather periods can inform smarter stop-loss placements, position sizing, or even the use of option strategies to protect against unexpected reversals.
Additionally, this information becomes particularly valuable during the planting and pollination seasons, when the corn crop is most vulnerable and the market reacts most strongly. Knowing the historical patterns of price behavior in those weeks — and aligning them with current forecast data — offers a clear edge that fundamental and technical analysis alone may not reveal.
🗺️ Global Corn Map Screenshot: A world map highlighting major corn-growing regions with weather overlay. This helps illustrate the geographic variability in rainfall and how it intersects with key production zones.
6. Corn Futures Contracts: Speculating with Flexibility
For traders looking to act on this kind of seasonal weather intelligence, CME Group provides two practical tools: the standard-size Corn Futures contract (ZC) and the Micro Corn Futures contract (MZC).
Here are some quick key points to remember:
Tick size for ZC is ¼ cent (0.0025) per bushel, equating to $12.50 per tick.
For MZC, each tick is 0.0050 equating to $2.50 per tick.
Standard ZC initial margin is approximately $1,000 and MZC margins are around $100 per contract, though this can vary by broker.
Micro contracts are ideal for those who want exposure to corn prices without the capital intensity of full-size contracts. They’re especially helpful for weather-based trades, where your thesis may rely on shorter holding periods, rapid scaling, or position hedging.
7. Conclusion: Rain’s Role in the Corn Trade
Precipitation isn’t just a farmer’s concern — it’s a trader’s opportunity. Our analysis shows that weather data, especially rainfall, has a statistically significant relationship with corn futures prices. By normalizing historical precipitation data and matching it to weekly returns, we uncovered a clear pattern: drought stress tends to lift prices, while excessive moisture creates volatility and downside risk.
For futures traders, understanding this dynamic adds another layer to market analysis.
As part of a broader series, this article is just one piece of a puzzle that spans multiple commodities and weather variables. Stay tuned for our upcoming releases, where we’ll continue exploring how nature’s forces shape the futures markets.
When charting futures, the data provided could be delayed. Traders working with the ticker symbols discussed in this idea may prefer to use CME Group real-time data plan on TradingView: tradingview.sweetlogin.com - This consideration is particularly important for shorter-term traders, whereas it may be less critical for those focused on longer-term trading strategies.
General Disclaimer:
The trade ideas presented herein are solely for illustrative purposes forming a part of a case study intended to demonstrate key principles in risk management within the context of the specific market scenarios discussed. These ideas are not to be interpreted as investment recommendations or financial advice. They do not endorse or promote any specific trading strategies, financial products, or services. The information provided is based on data believed to be reliable; however, its accuracy or completeness cannot be guaranteed. Trading in financial markets involves risks, including the potential loss of principal. Each individual should conduct their own research and consult with professional financial advisors before making any investment decisions. The author or publisher of this content bears no responsibility for any actions taken based on the information provided or for any resultant financial or other losses.
Why Soybean Oil Outperforms Crude Oil?From their recent lows, soybean oil has quietly crept up by 50%, while crude oil has risen by 40%. The reason goes beyond the recent renewal of tensions in the Middle East — it runs deeper than that.
Mirco SoybeanOil Futures
Ticker: MZL
Minimum fluctuation:
0.02 per pound = $1.20
Disclaimer:
• What presented here is not a recommendation, please consult your licensed broker.
• Our mission is to create lateral thinking skills for every investor and trader, knowing when to take a calculated risk with market uncertainty and a bolder risk when opportunity arises.
CME Real-time Market Data help identify trading set-ups in real-time and express my market views. If you have futures in your trading portfolio, you can check out on CME Group data plans available that suit your trading needs tradingview.sweetlogin.com
Trading the Micro: www.cmegroup.com
www.cmegroup.com

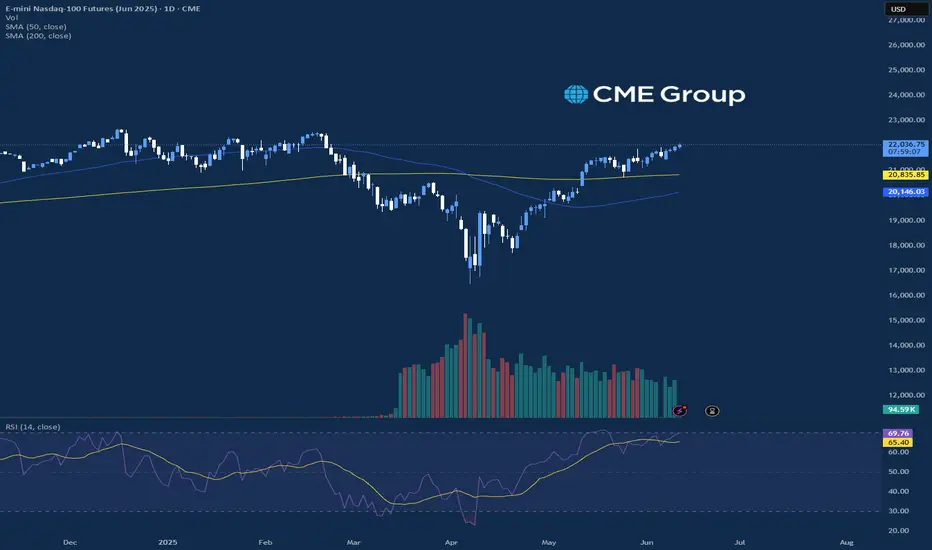
US–Iran Conflict Triggers a Potential Nasdaq Bearish Setup🟣 Geopolitical Flashpoint Meets Technical Confluence
The U.S. weekend airstrike on Iranian nuclear facilities has reignited geopolitical instability across the Middle East. While broader markets often absorb news cycles quickly, high-beta assets like Nasdaq futures (NQ) tend to react more dramatically—especially when uncertainty meets existing technical vulnerability.
Monday’s session opened with a notable gap to the downside, reflecting immediate risk-off sentiment among futures traders. While the initial drop is being retraced intraday, historical patterns suggest that such gap-fills can often serve as ideal shorting zones—particularly when other bearish signals confirm the narrative. The backdrop is clear: this is no ordinary Monday open.
🟣 Bearish Divergence on CCI Builds the Case
From a technical standpoint, the setup gains weight through a clear bearish divergence on the Commodity Channel Index (CCI) using a 20-period setting. While prices recently pushed higher, momentum failed to follow—an early indication that buyers may be running out of steam. This divergence appears just as price approaches the origin of Friday’s gap, a level that frequently acts as a resistance magnet in such contexts. This confluence of weakening momentum and overhead supply aligns perfectly with the geopolitical catalyst, offering traders a compelling argument for a potential reversal in the short term.
🟣 Gap Origin: The Line in the Sand
The origin of the gap sits at 21844.75, a price level now acting as potential resistance. As the market attempts to climb back toward this zone, the likelihood of encountering institutional selling pressure increases. Gap origins often represent unfinished business—zones where prior bullish control was suddenly interrupted. In this case, the added layer of global tension only strengthens the conviction that sellers may look to reassert dominance here. If price action stalls or rejects at this zone, it could become the pivot point for a swift move lower, especially with bearish momentum already flashing caution signals.
🟣 Trade Plan and Reward-to-Risk Breakdown
A potential short trade could be structured using 21844.75 as the entry point—precisely at the gap origin. A conservative stop placement would rest just above the most recent swing high at 22222.00, offering protection against a temporary squeeze. The downside target aligns with a prior UFO support area near 20288.75, where demand previously showed presence. This sets up a risk of 377.25 points versus a potential reward of 1556.00 points, resulting in a reward-to-risk ratio of 4.12:1. For traders seeking asymmetrical opportunity, this ratio stands out as a strong incentive to engage with discipline.
🟣 Futures Specs: Know What You’re Trading
Traders should be aware of contract specifics before engaging. The E-mini Nasdaq-100 Futures (NQ) represent $20 per point, with a minimum tick of 0.25 worth $5.00. Typical margin requirements hover around $31,000, depending on the broker.
For smaller accounts, the Micro Nasdaq-100 Futures (MNQ) offer 1/10th the exposure. Each point is worth $2, with a $0.50 tick value and much lower margins near $3,100.
🟣 Discipline First: Why Risk Management Matters
Volatility driven by geopolitical events can deliver fast gains—but just as easily, fast losses. That’s why stop-loss orders are non-negotiable. Without one, traders expose themselves to unlimited downside, especially in leveraged instruments like futures. Equally critical is the precision of entry and exit levels. Acting too early or too late—even by a few points—can compromise an otherwise solid trade. Always size positions according to your account, and never let emotion override logic. Risk management isn’t a side-note—it’s the foundation that separates professionals from those who simply speculate.
When charting futures, the data provided could be delayed. Traders working with the ticker symbols discussed in this idea may prefer to use CME Group real-time data plan on TradingView: tradingview.sweetlogin.com - This consideration is particularly important for shorter-term traders, whereas it may be less critical for those focused on longer-term trading strategies.
General Disclaimer:
The trade ideas presented herein are solely for illustrative purposes forming a part of a case study intended to demonstrate key principles in risk management within the context of the specific market scenarios discussed. These ideas are not to be interpreted as investment recommendations or financial advice. They do not endorse or promote any specific trading strategies, financial products, or services. The information provided is based on data believed to be reliable; however, its accuracy or completeness cannot be guaranteed. Trading in financial markets involves risks, including the potential loss of principal. Each individual should conduct their own research and consult with professional financial advisors before making any investment decisions. The author or publisher of this content bears no responsibility for any actions taken based on the information provided or for any resultant financial or other losses.

What Is the Base Price for Oil?What is the base price for oil? Specifically, today we will discuss crude oil, and we can apply this understanding to other commodities as well.
I won't go into too much technical detail about the difference between the base price and the cost price for crude oil, but for most people, it helps to see the title as “Is there a bottom-line price or support level for crude oil?”
My answer is yes, and this is due to inflation. Over time, we tend to pay higher prices for food, gas and many others that we consume.
WTI Crude Oil Futures & Options
Ticker: MCL
Minimum fluctuation:
0.01 per barrel = $1.00
Disclaimer:
• What presented here is not a recommendation, please consult your licensed broker.
• Our mission is to create lateral thinking skills for every investor and trader, knowing when to take a calculated risk with market uncertainty and a bolder risk when opportunity arises.
CME Real-time Market Data help identify trading set-ups in real-time and express my market views. If you have futures in your trading portfolio, you can check out on CME Group data plans available that suit your trading needs tradingview.sweetlogin.com
Trading the Micro: www.cmegroup.com
www.cmegroup.com

Nasdaq Leading Equities HigherThe equity markets are seeing higher prices today with the Nasdaq leading the way higher trading up near 2.5% on the day while the S&P and Russell both traded over 1% as well. There was steep selling pressure in equities to end the week last Friday due to additional tensions in the Middle East, and the markets are seeing a strong rebound today, especially on the technology front. While the equities were strong today, Crude Oil had the opposite effect, with a strong push higher on Friday and strong selling pressure on the session today trading down near 2.5%.
Looking ahead for the week, the big ticket item will be the Fed Meeting and interest rate decision on Wednesday the 18th, where the market is pricing in another pause on interest rates. Looking at the CME Fed Watch Tool, it is pricing in the first rate cut of the year to come in September at a 56% probability, which has continued to get pushed back later into the year with all of the uncertainty and volatility in the market. Traders will be more concerned with Fed Chair Powell’s remarks after the decision about the future plans of the Fed for the remainder of the year.
If you have futures in your trading portfolio, you can check out on CME Group data plans available that suit your trading needs tradingview.com/cme/
*CME Group futures are not suitable for all investors and involve the risk of loss. Copyright © 2023 CME Group Inc.
**All examples in this report are hypothetical interpretations of situations and are used for explanation purposes only. The views in this report reflect solely those of the author and not necessarily those of CME Group or its affiliated institutions. This report and the information herein should not be considered investment advice or the results of actual market experience.

What is Gold Silver Spread?What is gold silver spread? How to understand them to determine the market direction.
Reuters mentioned that the gold-silver ratio dropped from 105 to 94. What does this mean? Does it indicate that silver is about to trend higher, or is it a sign that gold will continue its trend?
Micro Silver Futures
Ticker: SIL
Minimum fluctuation:
0.005 per troy ounce = $5.00
Disclaimer:
• What presented here is not a recommendation, please consult your licensed broker.
• Our mission is to create lateral thinking skills for every investor and trader, knowing when to take a calculated risk with market uncertainty and a bolder risk when opportunity arises.
CME Real-time Market Data help identify trading set-ups in real-time and express my market views. If you have futures in your trading portfolio, you can check out on CME Group data plans available that suit your trading needs tradingview.sweetlogin.com
Trading the Micro: www.cmegroup.com
www.cmegroup.com

Ether Leads Markets HigherThe crypto markets move to the upside continued in today's session, with Ether futures leading the way higher trading up over 8% while Bitcoin rose nearly 1.5%. There has been significant strength from the Crypto markets over the last few weeks, and Ether is now trading right near the 50% retracement mark from the December 2024 high price when looking at a daily chart. Along with Bitcoin and Ether, the Solana market also saw a sharp rise over 5% on the session while XRP saw slight losses.
Outside of the Crypto markets, the Equity Indices traded slightly higher near 0.5% with Tesla leading the Nasdaq higher on the session. This is the third session in a row with a new higher high price for the S&P and could support a strong market at these levels. There have also been continued talks between President Trump and China about tariff policy, and the outcomes could add significant volatility to markets globally when resolved.
If you have futures in your trading portfolio, you can check out on CME Group data plans available that suit your trading needs tradingview.com/cme/
*CME Group futures are not suitable for all investors and involve the risk of loss. Copyright © 2023 CME Group Inc.
**All examples in this report are hypothetical interpretations of situations and are used for explanation purposes only. The views in this report reflect solely those of the author and not necessarily those of CME Group or its affiliated institutions. This report and the information herein should not be considered investment advice or the results of actual market experience.
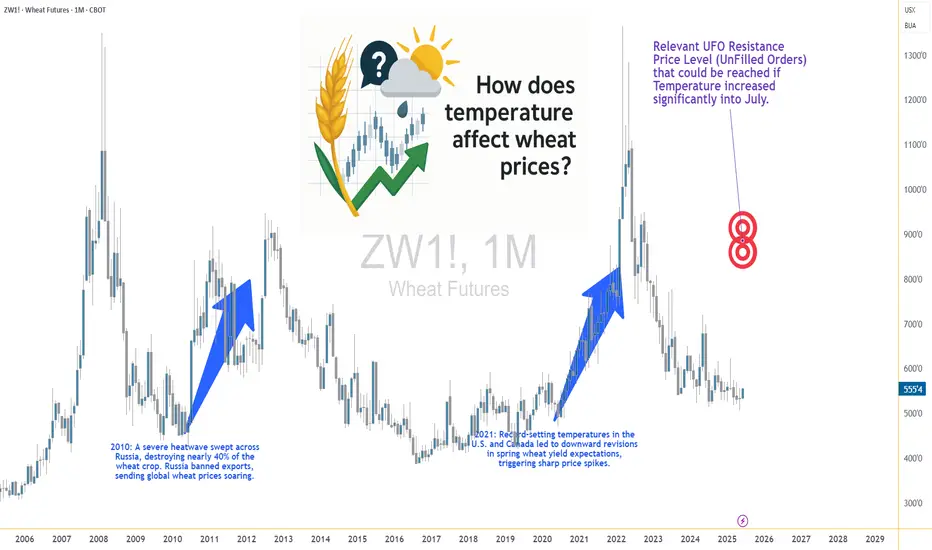
Heatwaves and Wheat: How Temperature Shocks Hit Prices🌾 Section 1: The Wheat–Weather Connection—Or Is It?
If there’s one crop whose success is often tied to the weather forecast, it’s wheat. Or so we thought. For decades, traders and analysts have sounded the alarm at the mere mention of a heatwave in key wheat-producing regions. The logic? Excessive heat during the growing season can impair wheat yields by disrupting pollination, shortening the grain-filling period, or damaging kernel development. A tightening supply should lead to price increases. Simple enough, right?
But here’s where the story takes an unexpected turn.
What happens when we actually analyze the data? Does heat reliably lead to price spikes in the wheat futures market? The short answer: not exactly. In fact, our statistical tests show that temperature may not have the consistent, directional impact on wheat prices that many traders believe it does.
And that insight could change how you think about risk, seasonality, and the role of micro contracts in your wheat trading strategy.
📈 Section 2: The Economics of Wheat—And Its Role in the Futures Market
Wheat isn’t just a breakfast staple—it’s the most widely grown crop in the world. It’s cultivated across North America, Europe, Russia, Ukraine, China, and India, making it a truly global commodity. Because wheat is produced and consumed everywhere, its futures markets reflect a wide array of influences: weather, geopolitics, global demand, and speculative positioning.
The Chicago Board of Trade (CBOT), operated by CME Group, is the main venue for wheat futures trading. It offers two primary wheat contracts:
Standard Wheat Futures (ZW)
Contract Size: 5,000 bushels
Tick Size: 1/4 cent per bushel (0.0025) has a $12.50 per tick impact
Margin Requirement: Approx. $1,700 (subject to change)
Micro Wheat Futures (MZW)
Contract Size: 500 bushels (1/10th the size of the standard contract)
Tick Size: 0.0050 per bushel has a $2.50 per tick impact
Margin Requirement: Approx. $170 (subject to change)
These micro contracts have transformed access to grain futures markets. Retail traders and smaller funds can now gain precise exposure to weather-driven moves in wheat without the capital intensity of the full-size contract.
🌡️ Section 3: Weather Normalization—A Smarter Way to Measure Impact
When analyzing weather, using raw temperature values doesn’t paint the full picture. What’s hot in Canada might be normal in India. To fix this, we calculated temperature percentiles per location over 40+ years of historical weather data.
This gave us three weekly categories:
Below 25th Percentile (Low Temp Weeks)
25th to 75th Percentile (Normal Temp Weeks)
Above 75th Percentile (High Temp Weeks)
Using this approach, we grouped thousands of weeks of wheat futures data and examined how price returns behaved under each condition. This way, we could compare a “hot” week in Ukraine to a “hot” week in the U.S. Midwest—apples to apples.
🔄 Section 4: Data-Driven Temperature Categories and Wheat Returns
To move beyond anecdotes and headlines, we then calculated weekly percent returns for wheat futures (ZW) for each of the three percentile-based categories.
What we found was surprising.
Despite common assumptions that hotter weeks push wheat prices higher, the average returns didn’t significantly increase during high-temperature periods. However, something else did: volatility.
In high-temp weeks, prices swung more violently — up or down — creating wider return distributions. But the direction of these moves lacked consistency. Some heatwaves saw spikes, others fizzled.
This insight matters. It means that extreme heat amplifies risk, even if it doesn't create a reliable directional bias.
Traders should prepare for greater uncertainty during hot weeks — an environment where tools like micro wheat futures (MZW) are especially useful. These contracts let traders scale exposure and control risk in turbulent market conditions tied to unpredictable weather.
🔬 Section 5: Statistical Shock—The t-Test Revelation
To confirm our findings, we ran two-sample t-tests comparing the returns during low vs. high temperature weeks. The goal? To test if the means of the two groups were statistically different.
P-Value (Temp Impact on Wheat Returns): 0.354 (Not Significant)
Conclusion: We cannot reject the hypothesis that average returns during low and high temp weeks are the same.
This result is counterintuitive. It flies in the face of narratives we often hear during weather extremes.
However, our volatility analysis (using boxplots) showed that variance in returns increases significantly during hotter weeks, making them less predictable and more dangerous for leveraged traders.
🧠 Section 6: What Traders Can Learn from This
This analysis highlights a few key lessons:
Narratives aren’t always backed by data. High heat doesn’t always mean high prices.
Volatility increases during weather stress. That’s tradable, but not in the way many assume.
Risk-adjusted exposure matters. Micro wheat futures (MZW) are ideal for navigating weather-driven uncertainty.
Multi-factor analysis is essential. Weather alone doesn’t explain price behavior. Global supply chains, speculative flows, and other crops’ performance all play a role.
This article is part of a growing series where we explore the relationship between weather and agricultural futures. From corn to soybeans to wheat, each crop tells a different story. Watch for the next release—we’ll be digging deeper into more effects and strategies traders can use to capitalize on weather.
When charting futures, the data provided could be delayed. Traders working with the ticker symbols discussed in this idea may prefer to use CME Group real-time data plan on TradingView: tradingview.sweetlogin.com - This consideration is particularly important for shorter-term traders, whereas it may be less critical for those focused on longer-term trading strategies.
General Disclaimer:
The trade ideas presented herein are solely for illustrative purposes forming a part of a case study intended to demonstrate key principles in risk management within the context of the specific market scenarios discussed. These ideas are not to be interpreted as investment recommendations or financial advice. They do not endorse or promote any specific trading strategies, financial products, or services. The information provided is based on data believed to be reliable; however, its accuracy or completeness cannot be guaranteed. Trading in financial markets involves risks, including the potential loss of principal. Each individual should conduct their own research and consult with professional financial advisors before making any investment decisions. The author or publisher of this content bears no responsibility for any actions taken based on the information provided or for any resultant financial or other losses.
How to Identify Head and Shoulders?How to identify head and shoulders patterns?
We’ll use the current example from the Nasdaq or the US markets. We can quite clearly observe that a potential head and shoulders formation is developing. This means that if the price breaks below the neckline, we may see a deeper correction from the April low.
I will go through the rules on how to identify a head and shoulders formation.
We will also cover how to recognize when the pattern is invalid — meaning the market may continue pushing above its all-time high.
Finally, we’ll discuss how we can position ourselves early, before waiting for a break below the neckline for confirmation.
Micro Nikkei Futures
Ticker: MNQ
Minimum fluctuation:
0.25 index points = $0.50
Disclaimer:
• What presented here is not a recommendation, please consult your licensed broker.
• Our mission is to create lateral thinking skills for every investor and trader, knowing when to take a calculated risk with market uncertainty and a bolder risk when opportunity arises.
CME Real-time Market Data help identify trading set-ups in real-time and express my market views. If you have futures in your trading portfolio, you can check out on CME Group data plans available that suit your trading needs tradingview.sweetlogin.com
Trading the Micro: www.cmegroup.com
www.cmegroup.com

Russell Leads Equities HigherEquity markets saw a positive day today with the Russell leading the way higher being up over 1.5% on the session. For the S&P and Nasdaq, this was the third session in a row with a higher high, and the 200-day moving average has acted as a floor in these markets since the breakout higher on May 12th. CPI numbers came out for Europe and came in worse than expected, and then the JOLTs data released later in the day was a better than expected figure and equites saw prices rise throughout the day.
Outside markets also saw movement today with Crude Oil strength continuing up over 1% on the session and closing out above the 50-day moving average for the July contract. The Crude Oil market has not seen the recovery that equities did from the breakdown in early April, and are still trading below the breakdown point. Along with Crude Oil, crypto futures had a strong day today, with XRP trading up over 4% and Solana and Ether both rising over 2.5% on the session. Tomorrow traders will get a look at ADP Nonfarm Employment Change along with manufacturing data before the critical jobs data at the end of the week.
If you have futures in your trading portfolio, you can check out on CME Group data plans available that suit your trading needs tradingview.com/cme/
*CME Group futures are not suitable for all investors and involve the risk of loss. Copyright © 2023 CME Group Inc.
**All examples in this report are hypothetical interpretations of situations and are used for explanation purposes only. The views in this report reflect solely those of the author and not necessarily those of CME Group or its affiliated institutions. This report and the information herein should not be considered investment advice or the results of actual market experience.
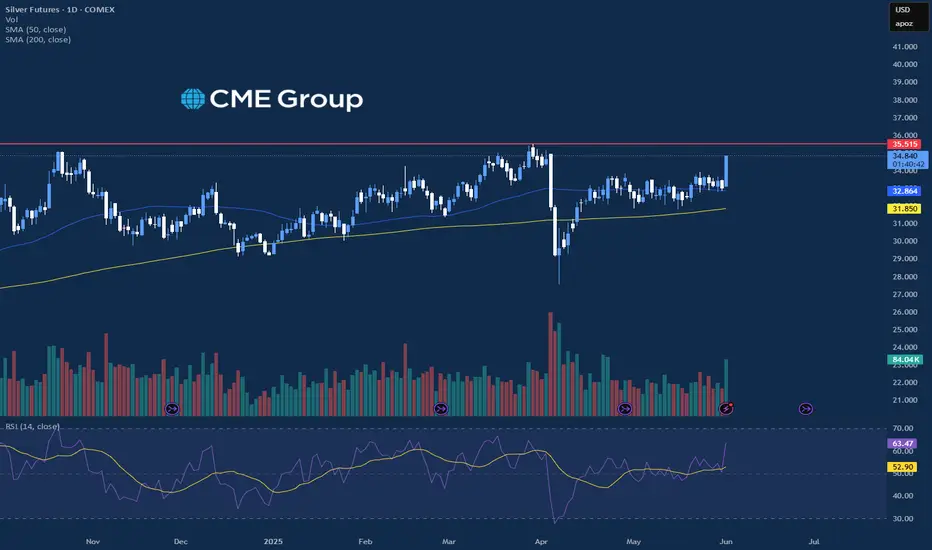
Precious Metals Leading Charge HigherStarting off the week today, traders are seeing many markets moving higher with the precious metals and energy markets leading the way. Gold futures over 2.5% on the session while Silver led the charge higher being up nearly 5%, and the Crude Oil market saw gains north of 3% while Natural Gas was up over 7% on the session. Equity markets traded slightly higher on the session but did not see the volatility seen in the precious metals or energy markets.
Looking at the economic data today, there was a big slate of data coming out of the U.S. looking at ISM manufacturing and S&P Global manufacturing that came in worse than expected. Tomorrow, traders will get a look at CPI coming out of Europe and JOLTs data here in the U.S. that could add additional volatility to the precious metals for the rest of the week. Along with that, the CVOL for Silver still remains very wide as seen below, and looking back over the past year shows that the volatility is relatively low compared to the current underlying price even with the spike traders saw today.
If you have futures in your trading portfolio, you can check out on CME Group data plans available that suit your trading needs tradingview.com/cme/
*CME Group futures are not suitable for all investors and involve the risk of loss. Copyright © 2023 CME Group Inc.
**All examples in this report are hypothetical interpretations of situations and are used for explanation purposes only. The views in this report reflect solely those of the author and not necessarily those of CME Group or its affiliated institutions. This report and the information herein should not be considered investment advice or the results of actual market experience.
Markets Lower Ahead of Nvidia Earnings Equity Indices traded loEquity Indices traded lower on the session today after seeing strong gains yesterday to start the week with the Russell leading the downside pressure being down near 1%. The FOMC minutes were released this afternoon and showed that the Fed was comfortable with rates remaining unchanged for the time being, and equity markets fell while traders saw Bond Yields trade higher. Gold, Silver and Copper also saw losses on the session with Copper leading the selling pressure being down near 1.5%.
The big news today came after the bell with Nvidia reporting earnings, where they saw a beat on both EPS and Revenue, and the S&P and Nasdaq are seeing some after hours gains. There was news this afternoon as well where President Trump ordered US chip designers to stop selling software to China, which could have longer term effects on the global supply and demand. Looking ahead for the rest of the week, traders will see key economic data looking at jobs and GDP that can add volatility to the equity indices and outside markets like the precious metals or crypto markets.
If you have futures in your trading portfolio, you can check out on CME Group data plans available that suit your trading needs tradingview.com/cme/
*CME Group futures are not suitable for all investors and involve the risk of loss. Copyright © 2023 CME Group Inc.
**All examples in this report are hypothetical interpretations of situations and are used for explanation purposes only. The views in this report reflect solely those of the author and not necessarily those of CME Group or its affiliated institutions. This report and the information herein should not be considered investment advice or the results of actual market experience.

Recap: Short below LIS/Yearly Open Crude OilNYMEX:CL1!
Another day and EdgeClear brings you another recap where one of the highlighted scenarios in our weekly plan for WTI crude oil, published on February 24, 2025 , played out as expected.
Our Scenario 3 looked at price discovery extending the 2025 range into Q4 2024 lower distribution. Our analysis indicated an initial move lower bouncing from CVPOC 2022 support. The key was price moving below key LIS/yearly open. We did not see a bearish head and shoulders pattern develop, however, the rest of the plan played out as expected.
Note the price action till Friday, 28th Feb 2025.
We have been consistently providing traders with a roadmap for WTI crude oil with our thoughts and opinions on the market. WTI crude oil is a fundamental product that is affected by several factors, such as: macro, geopolitical, economic, supply, demand, and oil production dynamics.
Our analysis considers these developments along with auction market theory and key indicators that may be important to watch at times. As an example, for our January 13, 2025, blog , we noted increased volume with increased open interest that drove bullish sentiment in crude oil prices. We also highlighted potential short opportunities that played out per our plan.
For last week’s blog, we noted the overall trend in volume and open interest falling, indicating a potential move lower. This combined with multiple tests of our key LIS/ yearly open, strengthened our thesis for further price discovery lower.
In our blog, we have highlighted two key ranges:
$70 - $75 - Q1 2025 Value Area
$65 - $70 - Q4 2024 Lower Distribution
Focus is shifting towards oil market fundamentals i.e., supply, demand, and production outlook.
While headline news may drive short-term and intraday volatility, investors and market participant’s focus will shift towards oil market fundamentals. On March 3rd, 2025, OPEC+ reaffirmed its decision from December 5, 2024, to proceed with gradual and flexible return of 2.2 mbpd voluntary cuts, starting April 1, 2025. It provided a detailed table along with a cautious approach should this decision require any amendments. In our analysis, while trade war and tariff tantrum create uncertainty around demand outlook, any news providing clarity on tariffs will be considered net positive.

US Market Reversal EmergedLast Friday marked the final trading day of February. I always take the opportunity to analyze the monthly chart closely.
We saw an inverted hammer. From the cash chart, clearly, we can see the inverted hammer. Beyond that, it also appears to be a potential double top for the Nasdaq.
E-mini Nasdaq Futures & Options
Ticker: NQ
Minimum fluctuation:
0.25 index points = $5.00
Micro E-mini Nasdaq Futures & Options
Ticker: MNQ
Minimum fluctuation:
0.25 index points = $0.50
Disclaimer:
• What presented here is not a recommendation, please consult your licensed broker.
• Our mission is to create lateral thinking skills for every investor and trader, knowing when to take a calculated risk with market uncertainty and a bolder risk when opportunity arises.
CME Real-time Market Data help identify trading set-ups in real-time and express my market views. If you have futures in your trading portfolio, you can check out on CME Group data plans available that suit your trading needs tradingview.sweetlogin.com
Trading the Micro: www.cmegroup.com

ES Futures & Macro Trends: Key Levels and Market ScenariosCME_MINI:ES1!
Macro and Geopolitics:
There was continued news flow over the weekend after derailed talks between Trump and Zelensky. Europe, UK and Saudi Arabia are still pushing for a Russia-US-Ukraine peace deal that will likely include rare earth minerals.
We also heard Trump commenting on an executive order on digital assets strategic reserves helping reverse losses in CME BTC futures. Investors see this as a positive development prior to the upcoming Crypto Summit in Washington on March 7th.
US March 4th tariff deadlines loom for Canada, Mexico, and China. Trump repeated America's first stance commenting that border security and stopping illegal drug trades should be America’s prime focus.
Economic Calendar:
Looking ahead this week, key economic events include manufacturing PMI data on Monday, employment and services data midweek, and major central bank decisions and labor market reports toward the end of the week. Here’s a breakdown of important releases:
Monday:
Manufacturing PMI data release
Wednesday:
ADP Nonfarm Employment Change
Services PMI
Crude Oil Inventories
Thursday:
European Central Bank (ECB): Interest rate decision & monetary policy statement
U.S. Data:
Weekly Initial Jobless Claims
Continuing Jobless Claims
U.S. Trade Balance
January 2025 Imports & Exports data
Friday:
U.S. Employment Data:
Nonfarm Payrolls (NFP) report
Average Hourly Earnings
Unemployment Rate
Federal Reserve Speakers:
Bowman & Powell scheduled to speak
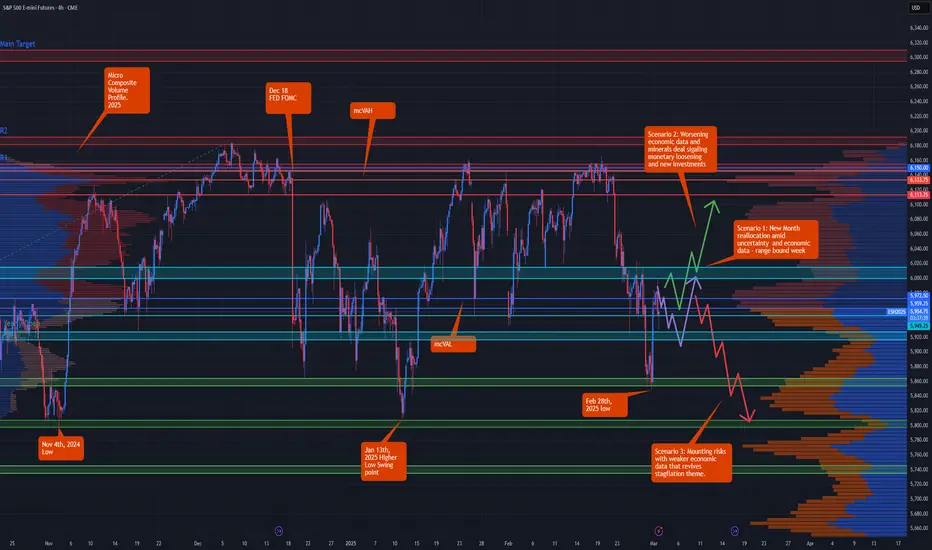
ES Big Picture:
Despite increased volatility and risks mounting, looking at the daily chart shows that ES futures are still within range and trading above Nov 4th, 2024 and January 13th, 2025 low, however, 2025 mcVAH and R1 confluence has been acting as strong resistance and keeping the markets from reaching new all-time highs.
Despite the risks, our analysis suggests that with the U.S. economy showing resilience, a "buy the dip" approach remains favorable. However, staying selective and strategic with opportunities is key to balancing risk and reward.
Key Levels:
Key levels represent areas of interest and zones of active market participation. The more significant a key level, the closer we monitor it for potential reactions and trade setups in alignment with our trading plan.
2025 VAH: 6,150
2025 VPOC: 6,133.75
LVN: 6,113.25
Neutral Zone: 6,000 - 6,015
2025 VAL: 5,972.50
LIS/Yearly Open: 5,949.50
Neutral Zone: 5,916.50 - 5,927.25
Feb 2025 Low: 5,848
Jan 2025 Low: 5,809
Scenario 1: Range bound week
Market remains volatile, however, within the neutral zone below key LIS/yearly open and neutral zone above Key LIS/yearly open.
Scenario 2: Weak data points slowing economy
Worsening economic data points along with progress in Ukraine- US minerals deal points towards further buying. Weaker data points may provide room for further rate cuts should economic weakening further materialize.
Scenario 3: Mounting risks and weaker economic data
On the contrary, mounting risk and weaker economic data may point towards stagflation as inflation remains sticky while the economy weakens. This provides room for further decline in ES futures.
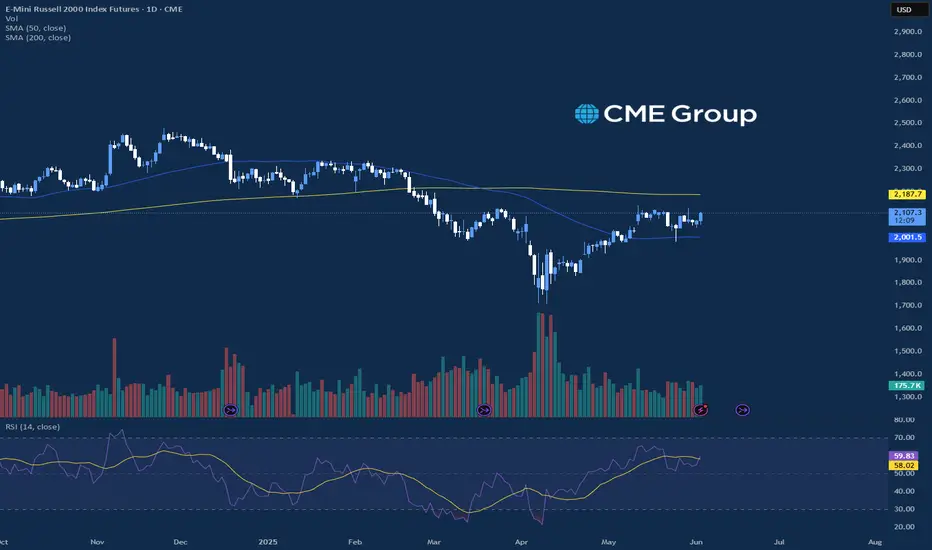
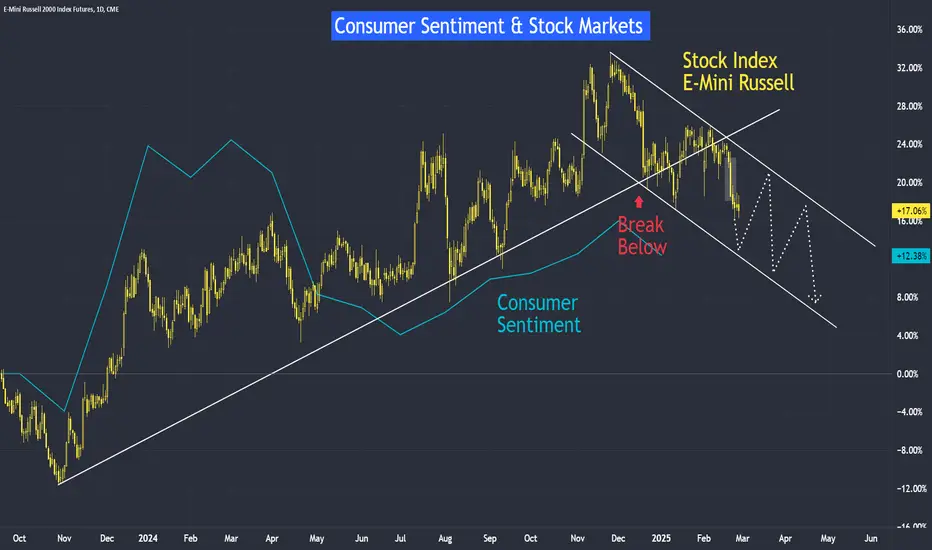
Consumer Sentiment & Stocks MarketsStock Markets Track Consumer Sentiment Closely
The relationship between consumer sentiment and the stock market is evident in this observation. Historically, consumer sentiment tends to lead stock market movements, providing valuable insights into potential trends.
Personally, I consider the Russell 2000 Index as a reflection of mass consumer sentiment, given that it tracks the 2,000 smallest publicly traded companies in the U.S. market. Looking at the E-Mini Russell futures, consumer sentiment peaked in December 2024, and since then, I have been monitoring the Russell and other indices along their well-supported trendlines. When the Russell started testing its trendline in January, I became cautious about its uptrend.
The clean break on February 21 signaled a shift: Russell transitioned from an uptrend to a downtrend on the daily chart. Consequently, my trading strategy has shifted from buying on dips to selling on strength whenever opportunities arise.
Russell is Leading Dow Jones, Nasdaq and S&P???
Indices tend to influence each other, and leadership often rotates. While the Nasdaq has previously led market moves, this case study suggests Russell is currently taking the lead.
Technically, the overall U.S. market remains bullish as long as it holds above the primary uptrend line. A bear market is typically confirmed when the market drops 30%, and by then, it should break below all primary uptrend lines. However, waiting for that confirmation is too late—by then, the damage will be significant.
The key observation is that Russell has already broken its secondary uptrend line. Will the Dow Jones, S&P 500, and Nasdaq follow? If so, we need to make fundamental projections. Factors like escalating tariff conflicts could worsen inflation, directly impacting the broader stock market and indices.
Consumer Sentiment Still Below 80 Despite Pandemic Being Long Over
Given the current macro environment, consumer sentiment is likely to remain below 80 for an extended period. Additionally, there is a downside risk if geopolitical tensions escalate.
From past case studies, a consumer sentiment reading below 80 has often preceded a stock market decline. This historical pattern raises concerns about future market stability.
My Trading Strategy: Cautiously Bullish
• Technical Perspective: Apart from Russell, I remain bullish on other indices.
• Fundamental Perspective: Market sentiment leans toward pessimism.
• Conclusion: This dual outlook leads me to a cautiously bullish stance.
For Russell 2000, my preferred strategy is to sell into strength, guided by a downtrend channel. Another alternative is trading Micro E-Mini Russell futures (M2K) for precision and risk management.
📈 Happy trading!
Please see the following disclaimer and additional information that may be useful.
E-mini Russell Futures
Ticker: RTY
Minimum fluctuation:
0.10 index points = $5.00
Micro E-mini Russell Futures
Ticker: M2K
Minimum fluctuation:
0.10 index points = $0.50
Disclaimer:
• What presented here is not a recommendation, please consult your licensed broker.
• My mission is to create lateral thinking skills for every investor and trader, knowing when to take a calculated risk with market uncertainty and a bolder risk when opportunity arises.
Trading the Micro: www.cmegroup.com
CME Real-time Market Data help identify trading set-ups in real-time and express my market views. If you have futures in your trading portfolio, you can check out on CME Group data plans available that suit your trading needs tradingview.sweetlogin.com
Timing the Markets with Consumer SentimentBusinesses and producers around the world always cheer when U.S. consumer sentiment is in the 80 to 100 zone, as U.S. consumers play a big part in the global economic ecosystem.
The United States remains the largest consumer market in the world, but since the pandemic, this index has not recovered above the 80 level.
Does it mean that, there is a risks economy to enter into a recession?
How can we use this index to time our investments and trades?
E-mini Russell Futures
Ticker: RTY
Minimum fluctuation:
0.10 index points = $5.00
Micro E-mini Russell Futures
Ticker: M2K
Minimum fluctuation:
0.10 index points = $0.50
Disclaimer:
• What presented here is not a recommendation, please consult your licensed broker.
• Our mission is to create lateral thinking skills for every investor and trader, knowing when to take a calculated risk with market uncertainty and a bolder risk when opportunity arises.
Trading competition: tradingview.sweetlogin.com
Trading the Micro: www.cmegroup.com
CME Real-time Market Data help identify trading set-ups in real-time and express my market views. If you have futures in your trading portfolio, you can check out on CME Group data plans available that suit your trading needs tradingview.sweetlogin.com

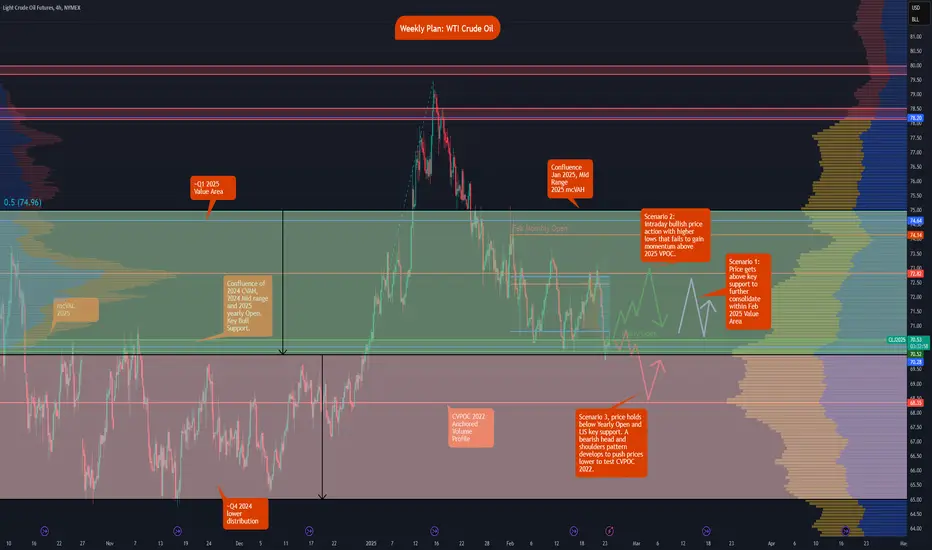
Is CL looking bearish? Short below LIS/Yearly Open?NYMEX:CL1!
Macro update:
Will we see another bullish leg like Jan 2025? Or does crude oil have room to move further lower and resume its downtrend after putting in the high of the year?
In our opinion, most headlines since the new US administration have already been priced in by market participants.
Crude oil fundamentals—encompassing supply, production, and demand outlook—are likely to influence prices more significantly than headline news. Our analysis indicates that the market has rebalanced, trading above the Composite Volume Point of Control (CVPOC) at $68.45 per barrel, as derived from our 2022 anchored Composite Volume profile. Furthermore, the 2025 Volume profile is exhibiting a “b”-shaped formation, signaling a move toward balance in its lower range.
From a market auction perspective, two key price ranges are established:
Q4 2024 Lower Distribution: Approximately $65–$70, indicating a balanced market.
Q1 2025 Value Area: Approximately $70–$75, also reflecting balance.
In our analysis, it’s essential to adopt a broader view by examining higher timeframe levels to stay aligned with these key market levels. While intraday or intrawork trends may display bearish or bullish momentum, the overall market auction framework suggests further consolidation within these ranges—unless new developments significantly alter the crude oil fundamentals or breaking headlines emerge that have yet to be priced in.
Key Levels to Watch
Key levels represent areas of interest and zones of active market participation. The more significant a key level, the closer we monitor it for potential reactions and trade setups in alignment with our trading plan.
Jan 2024 CVPOC and mCVPOC Q4 2024 confluence: 68.45 - 68.25
Key Bull Support/LIS: 69.90 - 70.50
Feb 2025 VAL: 70.80
2025 mCVPOC: 72.82
Feb 2025 VAH: 72.70
mCVAH/Jan 2025 mid: 74.96 - 74.80
Scenario 1:
Price gets above key support to further consolidate within Feb 2025 Value Area
Scenario 2:
Intraday bullish price action with higher lows that fails to gain momentum above the 2025 VPOC.
Scenario 3:
Price holds below Yearly Open and LIS key support. A bearish head and shoulders pattern develops to push prices lower to test CVPOC 2022.
Micro CME contracts allow for more precise risk management during volatile market conditions. Additionally, you can participate in the CME and TradingView paper trading competition, giving you the opportunity to test your skills in The Leap without risking real money.
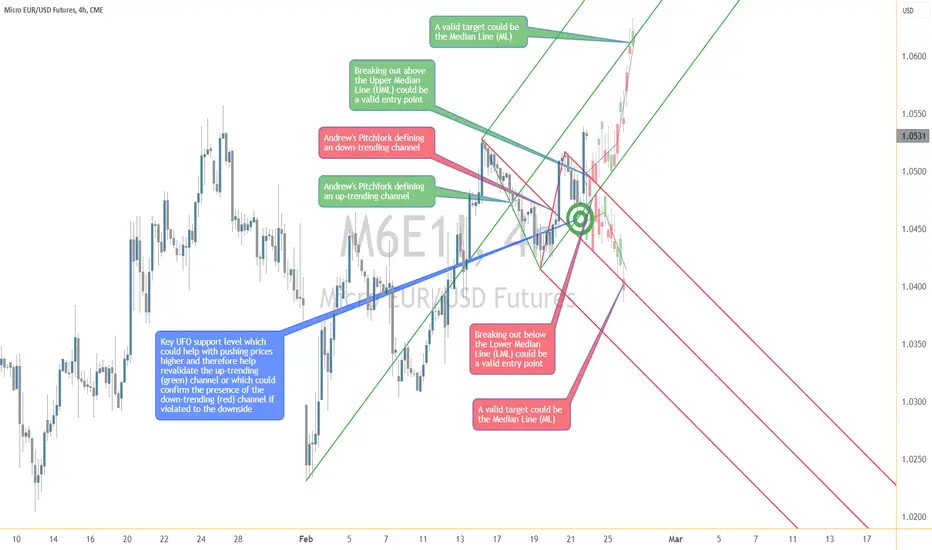
Leap Ahead with a Dynamic Setup: Trading with Andrew’s PitchforkThe Leap Trading Competition: A Chance to Trade Micro Euro Futures
TradingView’s "The Leap" Trading Competition provides an opportunity for traders to apply their futures trading strategies in a competitive environment. Participants can trade select CME Group futures contracts, including Micro Euro Futures (M6E).
This article presents a structured trade setup using Andrew’s Pitchfork, a technical tool that helps define potential trend direction and breakout levels. The setup involves two intersecting pitchforks near a key UFO support level, signaling the possibility of either an uptrend continuation or a confirmation of a new downtrend.
Understanding Andrew’s Pitchfork and Market Structure
Andrew’s Pitchfork is a technical analysis tool used to identify trend channels by plotting three parallel lines from a major price swing. The tool helps traders anticipate support, resistance, and breakout levels based on median lines.
In this setup, two pitchforks define opposing market structures. The green pitchfork represents an uptrend, suggesting that price could continue higher. The red pitchfork represents a developing downtrend, indicating a possible reversal. The intersection of these pitchforks at a key UFO support level marks an important decision point for the market.
The Dynamic Trade Setup: Long and Short Scenarios
In a long trade scenario, entry is confirmed if price breaks above the Upper Median Line (UML) of the red pitchfork. The target for the trade is the Median Line (ML) of the green pitchfork, representing trend continuation. A stop loss is placed below entry at a distance that ensures a minimum 3:1 reward-to-risk ratio.
In a short trade scenario, entry is confirmed if price breaks below the Lower Median Line (LML) of the green pitchfork. The target for the trade is the Median Line (ML) of the red pitchfork, confirming further downside movement. A stop loss is placed above entry at a distance that maintains a minimum 3:1 reward-to-risk ratio.
Because the UML, LML, and ML levels change dynamically with each bar, breakout levels and targets must be adjusted accordingly. If price remains inside the pitchfork structure, the setup remains neutral until confirmation occurs.
Contract Specifications and Margin Requirements
Euro FX Futures (6E) details:
Full contract specs: 6E Contract Specifications – CME Group
Contract size: €125,000
Tick size: 0.00005 per EUR/USD ($6.25 per tick)
Margin requirements depend on broker conditions and market volatility, currently around $2,600 per contract.
Micro EUR/USD Futures (M6E) details:
Full contract specs: M6E Contract Specifications – CME Group
Contract size: €12,500 (1/10th of 6E)
Tick size: 0.0001 per EUR/USD ($1.25 per tick)
Lower margin requirements provide access to traders with smaller accounts, currently around $260 per contract.
M6E offers a lower-cost alternative to 6E, making it a useful instrument for adjusting position sizes and managing risk effectively. Traders should consider market conditions and leverage when determining position sizes.
Execution and Trade Management
Before executing a trade, price must confirm a breakout by fully breaking above UML for long trades or below LML for short trades. Additional confirmation through volume trends, momentum indicators, or candlestick patterns may help validate the move.
If price does not confirm the breakout, the setup remains invalid. If price re-enters the pitchfork channel, traders should reassess market structure before taking a new position. Stop losses should be maintained at levels that align with a structured risk-reward plan.
Conclusion
Andrew’s Pitchfork provides a structured approach for trading trend continuation and reversals. This setup allows for both long and short breakout opportunities, depending on how price reacts at key pitchfork levels.
For traders in The Leap Trading Competition, this setup highlights the importance of disciplined execution, waiting for confirmation, and managing risk effectively when trading futures.
When charting futures, the data provided could be delayed. Traders working with the ticker symbols discussed in this idea may prefer to use CME Group real-time data plan on TradingView: tradingview.sweetlogin.com - This consideration is particularly important for shorter-term traders, whereas it may be less critical for those focused on longer-term trading strategies.
General Disclaimer:
The trade ideas presented herein are solely for illustrative purposes forming a part of a case study intended to demonstrate key principles in risk management within the context of the specific market scenarios discussed. These ideas are not to be interpreted as investment recommendations or financial advice. They do not endorse or promote any specific trading strategies, financial products, or services. The information provided is based on data believed to be reliable; however, its accuracy or completeness cannot be guaranteed. Trading in financial markets involves risks, including the potential loss of principal. Each individual should conduct their own research and consult with professional financial advisors before making any investment decisions. The author or publisher of this content bears no responsibility for any actions taken based on the information provided or for any resultant financial or other losses.
Equity Markets Lagging the Precious Metals
Equity indices slipped today as they are looking to retest all time high levels for the ES and the NQ. Traders saw economic data released today including a higher than expected initial jobless claims number along with a lower than expected Philadelphia Fed Manufacturing number. As the equity markets slipped, the precious metals complex saw gains today with Gold, Silver, and Copper all in positive territory.
As the week wraps up, traders can look ahead to the existing home sales number along with the S&P Global Manufacturing PMI tomorrow to add some volatility to the market. The CME Fed Watch Tool is currently indicating that rates will again be unchanged for the March meeting, and then a 43.6% chance of a rate cut of 25 basis points at the June meeting. These expectations can change as the year progresses based on different employment and inflation data and will help give a better indication of the strength of the equity and precious metal markets.
If you have futures in your trading portfolio, you can check out on CME Group data plans available that suit your trading needs tradingview.com/cme/
*CME Group futures are not suitable for all investors and involve the risk of loss. Copyright © 2023 CME Group Inc.
**All examples in this report are hypothetical interpretations of situations and are used for explanation purposes only. The views in this report reflect solely those of the author and not necessarily those of CME Group or its affiliated institutions. This report and the information herein should not be considered investment advice or the results of actual market experience.

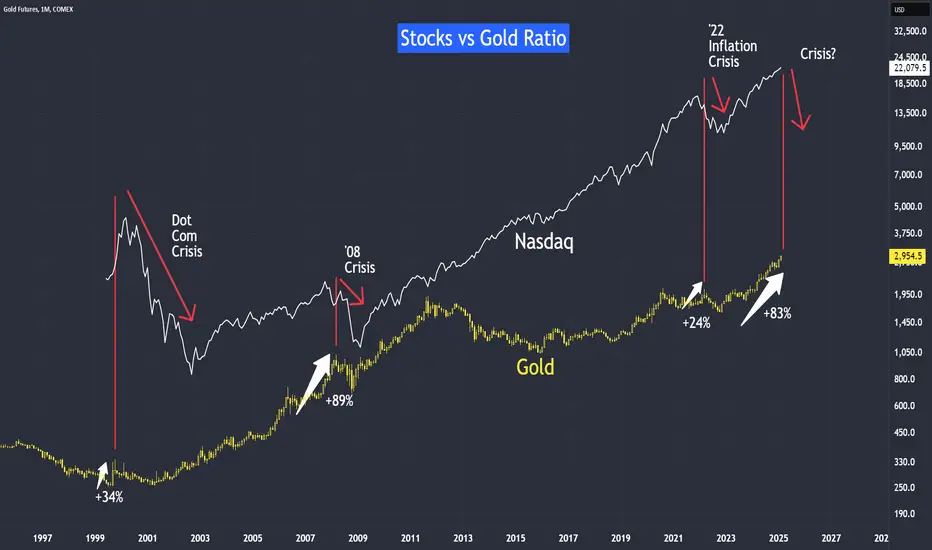
Tracking Crisis with Stocks/Gold RatioGold Surges with Three Major Crises
Over the past 25 years, we have witnessed three significant financial crises: the Dot-Com Bubble, the 2008 Financial Crisis, and the recent 9% inflation crisis. In each of these events, a distinct pattern emerged—gold surged before the crisis reached its full intensity.
Historically, gold's price has experienced notable gains before economic downturns:
• Dot-Com Bubble: +34% surge
• 2008 Financial Crisis: +89% surge
• Inflation Crisis (2022): +24% surge
Currently, gold has surged 83% from its trough in November 2022. Given this historical correlation, could we be on the verge of another financial crisis?
Why Are Central Banks Stockpiling Gold?
This current gold rally bears similarities to past surges but also has a crucial distinction. While demand for gold remains strong, this time around, central banks are leading the charge in purchasing gold at an unprecedented rate since 2022.
Gold serves a dual function:
1. Inflation Hedge – A safeguard against inflation.
2. Currency Hedge – Protection against currency devaluation.
Central banks' aggressive gold acquisitions suggest expectations of prolonged inflation and currency instability. As fiat currencies weaken, inflationary pressures mount, reinforcing gold’s attractiveness as a safe haven asset.
Fundamental Indicators Paint a Cautionary Picture
A deeper dive into key economic indicators suggests a challenging outlook. Here are some red flags:
• Treasury Bonds in a Downtrend – Indicating a loss of confidence in long-term debt
securities.
• Interest Rates Remain High – Despite inflation cooling from 9% to 3%, borrowing
costs remain significantly higher than pre-2022 levels. Elevated interest rates place
pressure on businesses and, eventually, stock prices.
• Inflation Remains Stubborn – The lowest recorded inflation since the peak was 2.4%,
but it has now ticked back up to 3%. With ongoing tariff escalations, inflation could
reignite.
These fundamental factors indicate that financial markets remain vulnerable to shocks, reinforcing the case for cautious positioning.
The Technical Outlook: A Bullish Trend Still Holds
Despite fundamental concerns, technical analysis suggests that the current AI-driven market rally, which began after the introduction of ChatGPT, remains intact. A strong uptrend line connecting all major troughs continues to act as a support level.
Timing the Bear with the Crisis
The bond market is already signaling distress. If equity markets break below this well-established uptrend line, my strategy will shift dramatically. Instead of looking for buying opportunities on dips, I will pivot to selling on strengths, anticipating a market downturn.
My Trading Strategy: Still Buying on Dips
I have provided a daily chart with updated trendlines, marking key support and resistance levels. My trading approach will be guided by these levels to manage risk effectively.
Preferred Instruments: Outright futures and call options.
Market Outlook: Cautiously bullish.
While economic conditions warrant vigilance, technical indicators suggest that the bullish trend remains intact—until proven otherwise. Happy trading!
Please see the following disclaimer and information that you may find useful:
E-mini Nasdaq Futures & Options
Ticker: NQ
Minimum fluctuation:
0.25 index points = $5.00
Micro E-mini Nasdaq Futures & Options
Ticker: MNQ
Minimum fluctuation:
0.25 index points = $0.50
Disclaimer:
• What presented here is not a recommendation, please consult your licensed broker.
• My mission is to create lateral thinking skills for every investor and trader, knowing when to take a calculated risk with market uncertainty and a bolder risk when opportunity arises.
Trading competition: tradingview.sweetlogin.com
Trading the Micro: www.cmegroup.com
CME Real-time Market Data help identify trading set-ups in real-time and express my market views. If you have futures in your trading portfolio, you can check out on CME Group data plans available that suit your trading needs tradingview.sweetlogin.com