Artificial Intelligence Altcoins will explode imo$GRT $FET $OCEAN
AI narrative is picking up - 3 majors showing promise for the next bull cycle.
However, one seems to be lagging.
AI industry is about to explode and these alts with it imo.
Thegraph

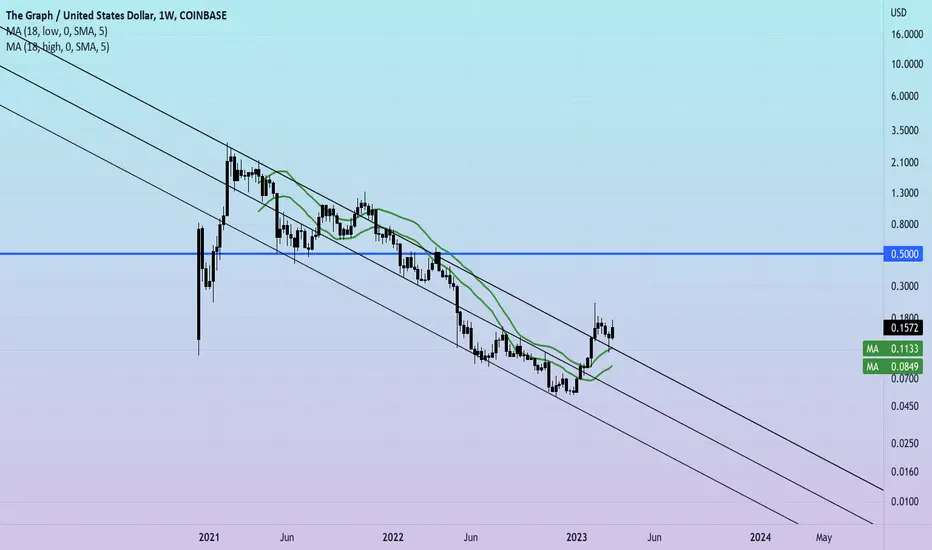
$GRT TREND CHANGEa change of trend has been confirmed on the following metrics
price above and supported by the 18 week high/low channel (one of my personal favorites)
adherence to channel fib retracement levels
long term horizontal fib shows amazing potential

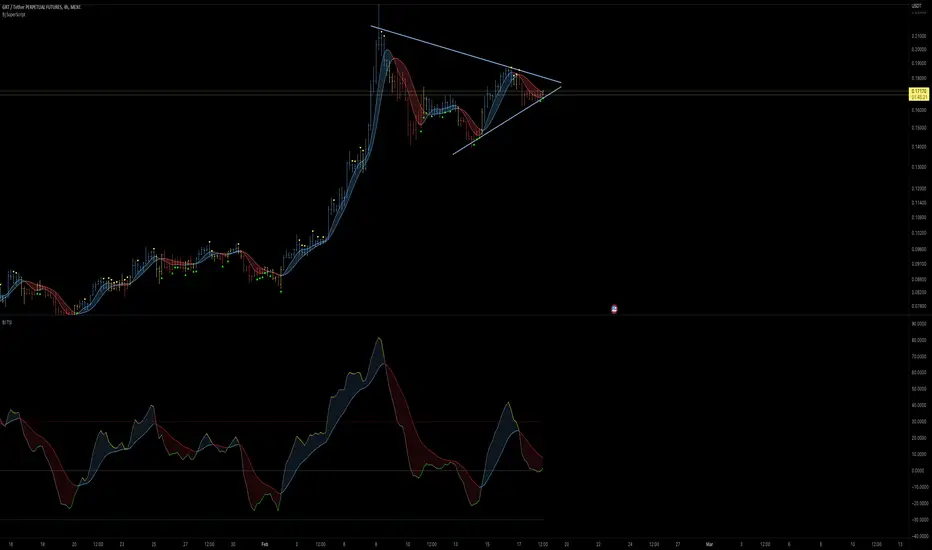
GRT Triangle bigger than originally thought.After several candle close outside of the original yellow triangle, it is clear that the more valid triangle is now this bigger tan triangle. We can see the top trendline of the tan triangles trajectory angle also matches the angle of the purple descending channels as well for added confluence. While that means we haven’t yet actually broken up out of the triangle just yet, the good news is when we do the breakout target will be higher than original expected. I arbitrarily placed the breakout measured move target line here for a rough estimate. opefully it breaks out of the triangle somewhere close to this region. *not financial advice*

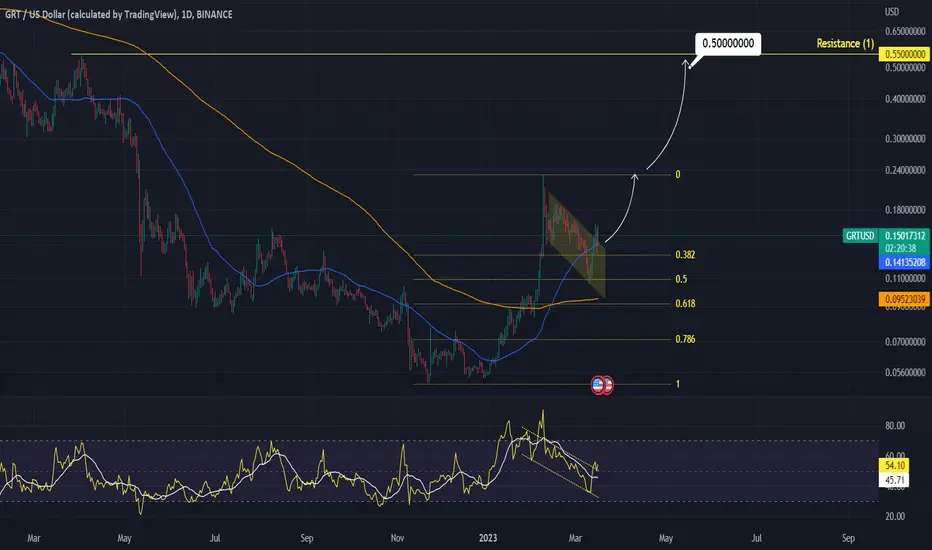
GRTUSD breaking up from symmetrical triangleShown here in yellow. If price action holds the 1 day 50ma (in orange) as solid support. The triangle should break up and take us above the horizontal green channel trendline. *not financial advice*

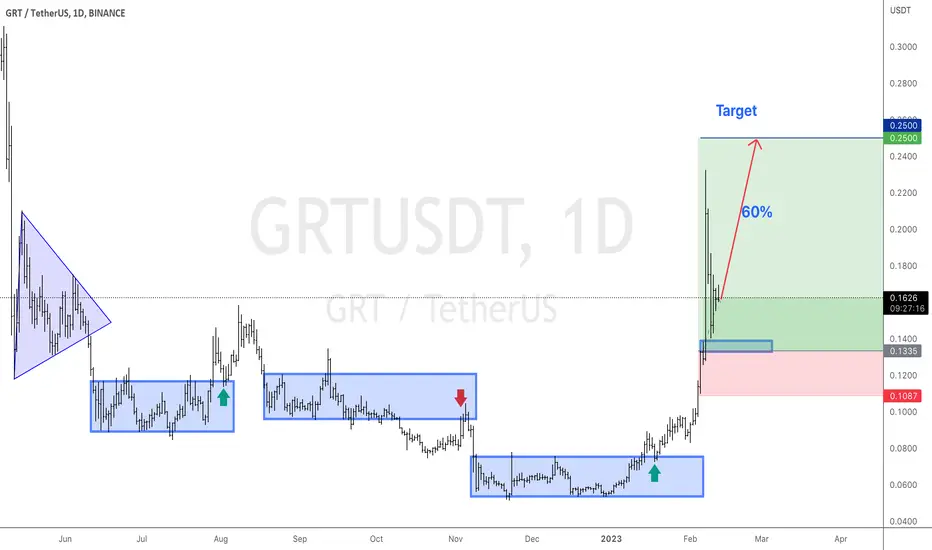
$GRT 1ST LOOKgraph breaking out and heading to .50 IMO
tested the downtrend line
currently using 18 week high/low channel as support
GRTUSD Bull Flag completed. Huge rally ahead.GRTUSD just broke above its Bull Flag pattern as well as the MA50 (1d).
With the MA200 (1d) supporting on Fibonacci 0.618, we see this as a solid long-term buy opportunity.
Trading Plan:
1. Buy on the current market price.
Targets:
1. 0.5000 (right under Resistance 1).
Tips:
1. The RSI (1d) has also broken above its own Bull Flag.
Please like, follow and comment!!
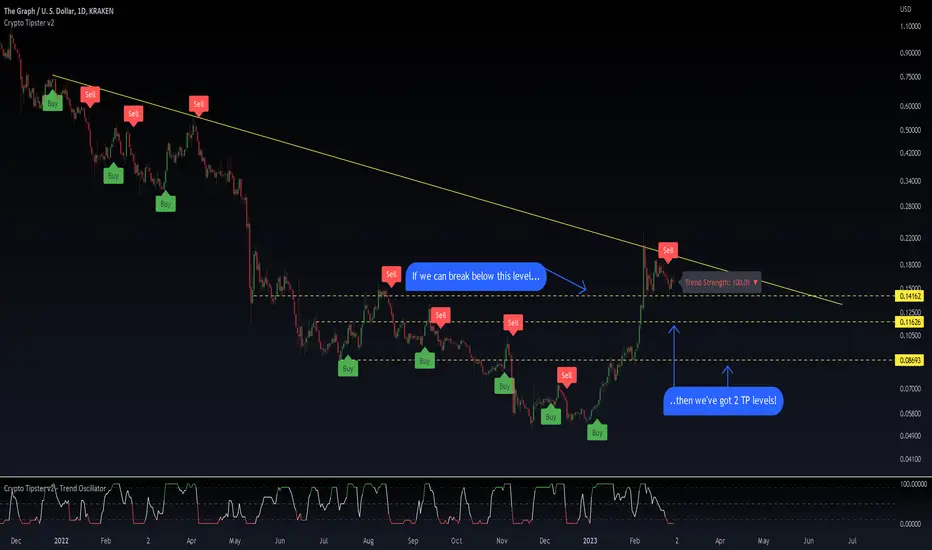
#GRTUSD - 25-50% Drop Incoming#THEGRAPH is showing signs of turning relatively bearish sometime very soon. We've had a big pump up and now support is spread thin.
If price was to drop under the nearest level of support we can see losses of at least 25% initially, with potential for twice that.
What Do You Think?
If you enjoyed or agree with this idea - drop us a comment, like & follow! 😀
Ideas by theCrypster meet the guidance notes and disclaimer as mentioned below and within our website. See Signature for more info! ✌️
🔥🔥🔥
Crypto Tipster v2
theCrypster
🔥🔥🔥
GRT two waysWhat's more likely? I believe these are two scenario's we need to be looking at in the coming days.

THE GRAPH/GRTUSD
Not FOMOING anymore, we wait until this Pump goes back. Not a financial Advice.
Spot traders DCA is the key here!..

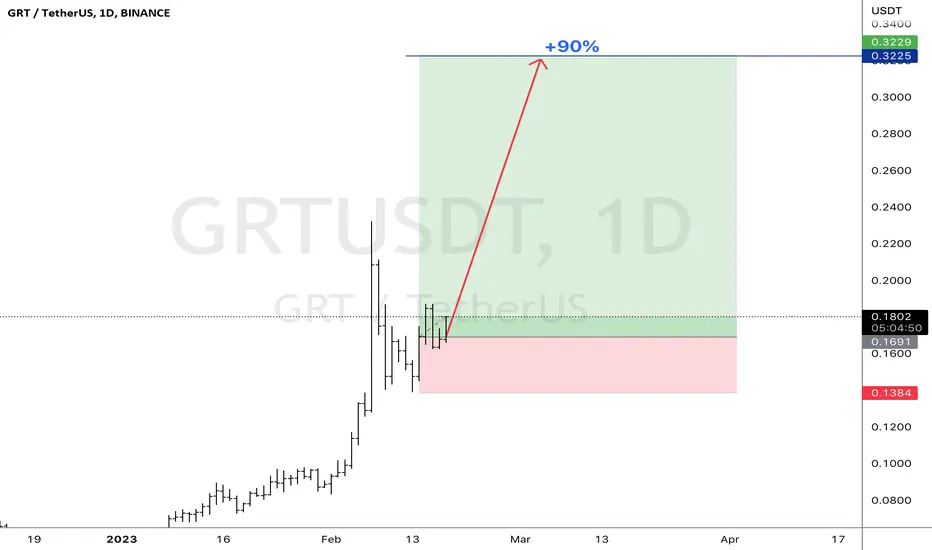
GRTUSD BullishGRT The Graph has very strong uptrend, SL zone is $0.1384 TP 0.3225 risk reward 1/5. All indicators and price action shows that big players entered long ...
THE GRAPH/GRTUSD UPDATES
If you hold this, we hit TP2. Not financial advice.
Im looking for short.
Congrats and check me out for more free ideas crypto and forex
Thank you.
Follow for more.
.
GRT The Graph LONG 20230214Signal:
Red -> Green
Context: Green * N
GRT, The Graph, GRTUSD , GRTUSDT, GRTUSDTPERP , CRYPTOS, CRYPTOCURRENCY
DISCLAIMER
This is only a personal opinion and does NOT serve as investing NOR trading advice.
Please make your own decisions and be responsible for your own investing and trading Activities.

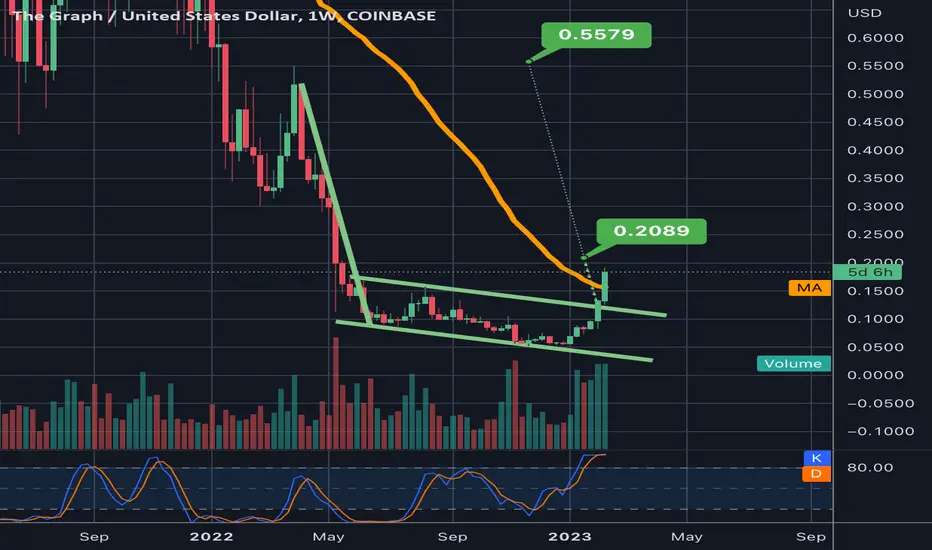
GRT (the graph) Is confirming breakout from descending channelWe can see here on the weekly chart that GRT (aka The Graph) has broken up from its descending channel and price action is currently very close to the descending channel’s breakout target. Much like many other crypto assets at the moment, we can also see that that descending channel has a large flag pole attached to it as well forming a bear flag. While the descending channel has validated its breakout, it is as of now still uncertain whether or not the bearflag will confirm a bullish breakout as well and pull an inverted Bart pattern. However, CoinMarketCap’s rankings of the “most valuable AI and big data crypto projects and tokens” currently has The Graph as the leading platform in market capitalization. According to Pablo Jodar, a crypto analyst at GenTwo, “I think it is linked to the rally on AI stocks, due to the ChatGPT effect.” Consider all the hype behind AI focused cryptos at the moment this greatly increases the probability that GRT will also confirm the bullish breakout up from the bearflag and reach the higher bearflag target as well. I have posted both targets here on the chart and will update this post once each target is hit. GRT is an indexing protocol that is setting itself up to be the decentralized google for searching blockchains.

GRT/THE GRAPH FUTURES LONG/SHORTLong wait is over, lets try this analysis..
Trade base on your own decissions..
COme and check me out for more.

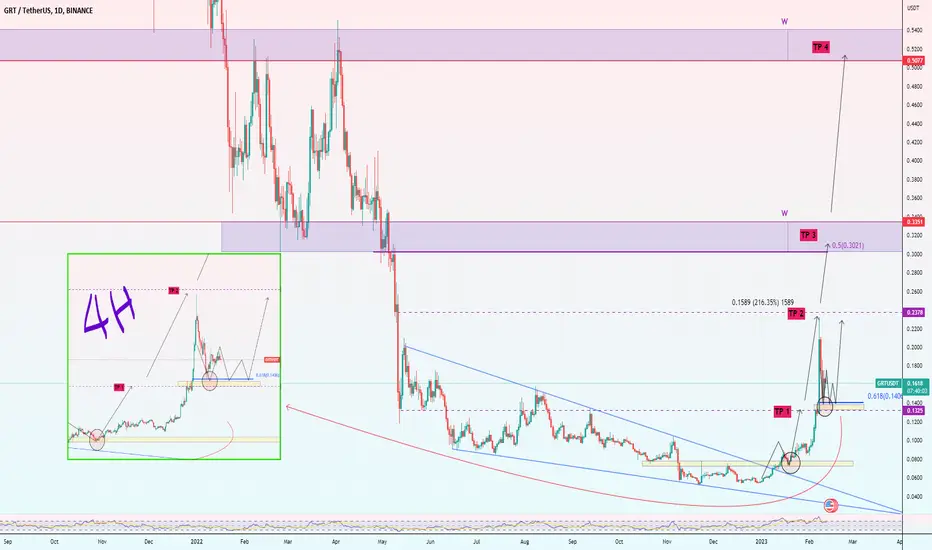
GRTUSDT, new opportunity to growth, THE GRAPH. Update2Hello guys. This is an update of previous analysis (blow link), As you can see on the chart the first and second targets with 216% reached, and then the price corrected to fib 61 and needs some rest here and has a good support base on TP1, for now I expect the price fill the weekly candle shadow and new ascending is on If the whole market follows. So I expect growth to the other targets. The targets will be 13 - 23 - 30 - 50.
Good luck.
If you like the idea, do not forget to support with a like and follow me for next analysis :)
Write your comment and opinion below for me
✴️ The Graph | Warning! ... Can Do More (Name Your Altcoin #33)Even though The Graph (GRTUSDT) has grown massively it can do more...
Let me make my usual disclaimer... I/We do not recommend buying here nor trading already moving pairs.
We have a trade idea for GRT way before it started to grow and we like to catch the bottom/low/support and get the full move to the upside. This way we get low risk with high potential for reward.
With that said, even though this one already has strong growth it can do more.
A correction can happen anytime.
Shakeouts can happen anytime...
If you jump-in now it becomes very complex on how to trade.
If it drops... Will it recover?
Or will it continue lower?
If it continues higher... How far up will it go?
Should I sell? How much?
Anxiety, stress....
See my chart for GRTBTC for example, before it grows.
5-Feb |
This is just one example but you get the idea.
Back to GRTUSDT.
Based on the hundreds of charts that I read on a weekly basis, this one has more to give.
We have the highest volume ever by far.
The strongest RSI ever by far... So even if you see a retrace it should be temporary before additional growth.
The next target/more details on the chart.
Remember to boost, follow, like, share, tweet, video, call, print, promote, drink, party, relax, meditate... Oops!
Remember to show your support.
Namaste.

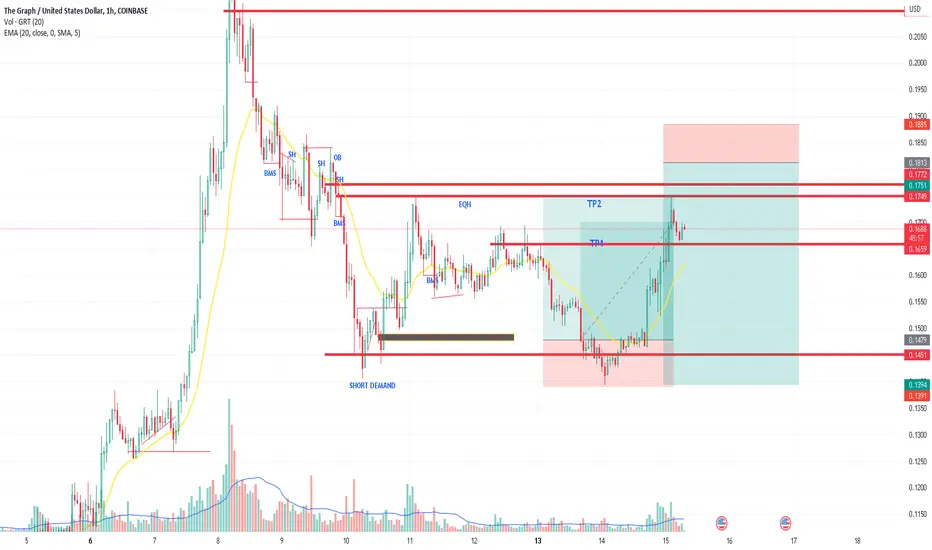
The Graph ($GRT) - demand zone and range $GRT The Graph
-> Continuation on a break above .1680
-> holding range eq atm
-> ideal long zone below in green (.618)
Either current level holds or green for a long setup. I prefer green but if this pushes we may have already got our chance to buy there with the local low.
Below green I think the major move is over on a macro level.
Vatsik

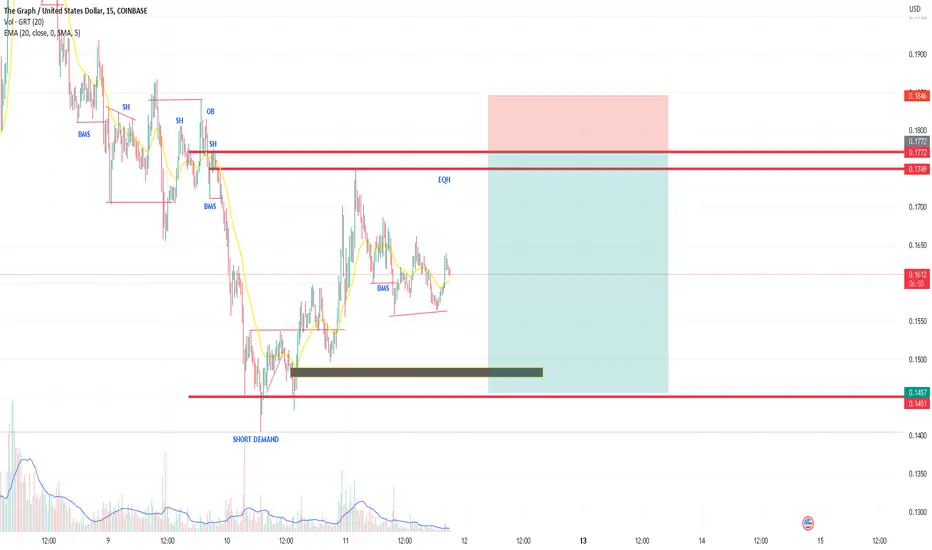
THE GRAPH FUTURESI see forming short demand mitigations for bearish liquidity here.
Trade base on your own decissions.
COme and check me out for more Futures Ideas.
Currently focus on AI coins.. keep updated for more
GRT (Y23.P1.Video2) continuing the TA storyHI Traders,
An update that gives the context of price action up til now... Finding a lot of things lining up well with MA and Fibonacci.
Lets hope it continues this predicable path.
We also look at the possible short term scenarios.
Please give me a like and share,
Regards,
S.SAri

GRT The Graph LONG OPPORTUNITY 20230210Signal: Red -> Green
Context: Green * N
GRT , The Graph, GRTUSD , GRTUSDT, GRTUSDTPERP , CRYPTOS, CRYPTOCURRENCY
DISCLAIMER
This is only a personal opinion and does NOT serve as investing NOR trading advice.
Please make your own decisions and be responsible for your own investing and trading Activities.
