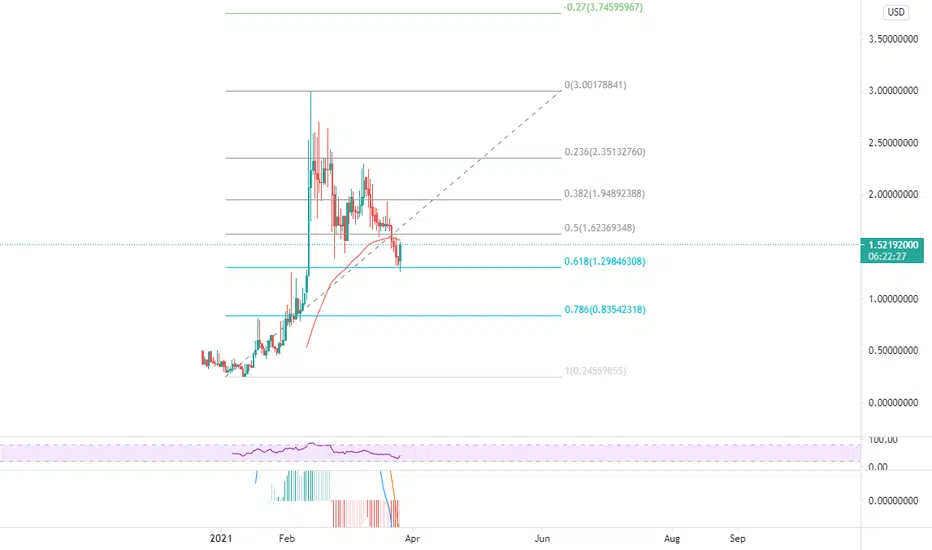
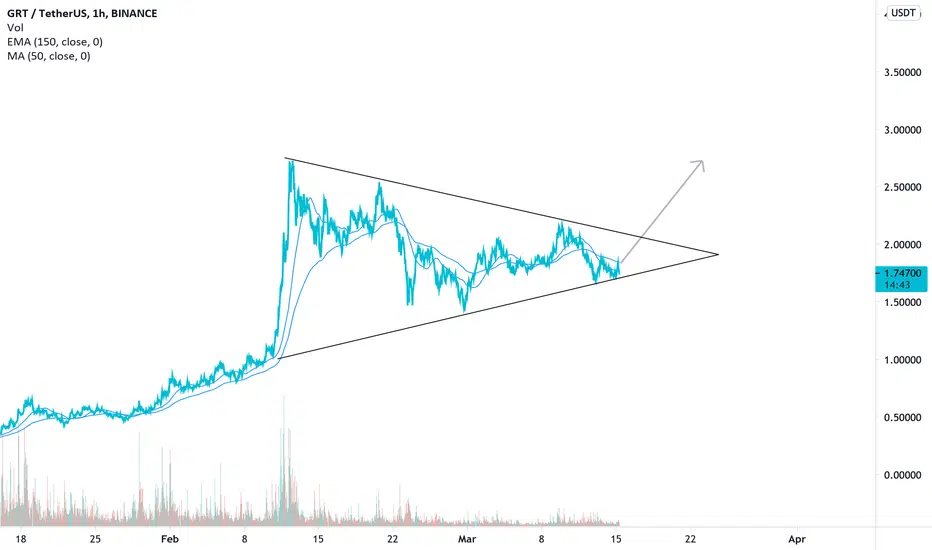
GRT wants to moon!GRT has been rallying tremendously since its launch in Dec 2020 and has been consolidating since its ATH on Feb 12.
The correction and consolidation has been ongoing for almost 2 (!) months now and since GRT shows these bullish signs:
- MACD cross
- MA cross
- Just set lowest low on RSI (similar to DOT before its recent run-up)
- Cup and handle with neckline in the golden pocket and (still early) seems like a solid bounce from the neckline!
Other factors to take in mind:
- trending on Coingecko
- immensely popular with retail, especially in the USA; with holidays this weekend, I expect the popular coins to surge
- did I say alt season? alt season!
Short term target (next 3 - 7 days): +30%
Mid term target (by mid June): +90%
I expect GRT to outperform BTC in the coming weeks / months, ofcourse; its alt season. :)
Check the links below for more alt coins with huge potential, happy days!
Long term: Given its use case will be increasingly important in the new blockchain based economy, I see huge potential long term for GRT.
But of course you dont care because we are all here for the short term gains; so trade the breakout, if you agree, good luck!
IMPORTANT: this is not financial advice, trade or invest at your own risk and research.
Thegraph

The graph grand master deep insight by matin taherzadeh-Hello everyone
GRT (the graph) looks pretty through its consolidation. So let’s make an deep insight on it.
Between March 23th-28th grt/usdt pair made inverse head and shoulder pattern on 4H time frame not shown on analysis sheet but is obvious, the token completed and confirmed the pattern with the long thick 28th March daily candle. Moreover, in confluence with this, grt broke above the moving average showing us it’s possible too make it bullish.
RSI trendline has broked and the money flow index create bullish scene on Daily time frame.
Another interesting factor about the token is a HVN zone followed by decreasing bar length shown in the analysis sheet.
If the bulls can hold the price above moving average, they will plan an powerful attack to the red zone and then to the last line of defense of bears in 2.2877$ and if can break it, the price of this token retest the high of the swing in 2.89$ and rally to the 3.82$ Will be in the instruction.
Please do your own research before any trade and just believe in your decision for risk management requirements.
The recommended stop loss for this analysis is a rectangle with the high of 1.39$ And the low of 1.35$ and if price broke below the stop loss’s zone low, the analysis become invalid.
Hope you joy from this analysis and with that: happy trading ;)

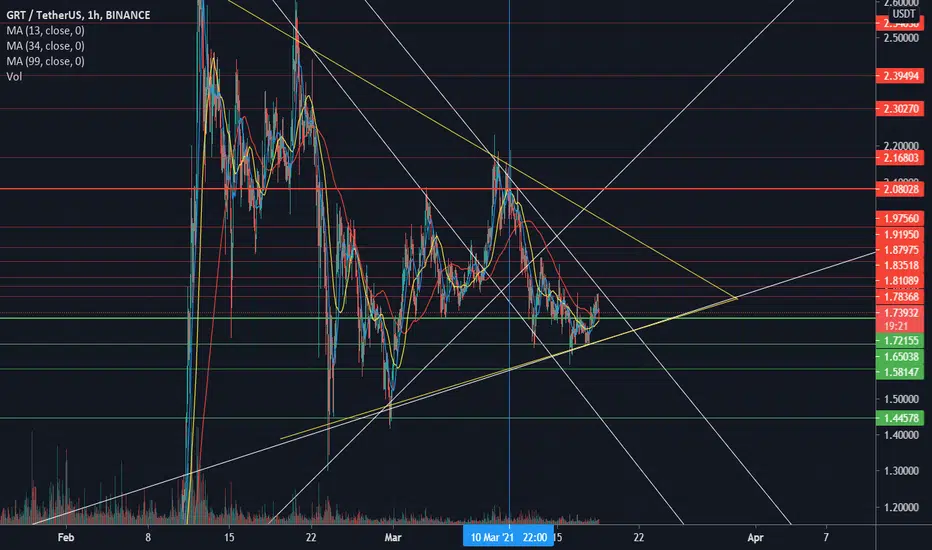
GRT Intended Channel and Next Leg UpI believe we could see GRT trade sideways until the end of the month. I think between the blue lines was GRT's intended movement but when it went parabolic it broke too far out of that channel. Its movement over the last couple of weeks tells me that it could continue like this until one of three possibilities.
1: GRT moves up to $1.86 in the next day or 2 then falling back to its strongest support at $1.68 then breaking out of the flag to test $2.45 on March 27th returning to its intended channel.
2: GRT continues to trade sideways for the rest of the month and explodes to $2.55 on April Fools Day again returning to its intended channel
3: GRT RSI is so cooled off that by the end of the month it just explodes from boredom back out of its intended channel to $3.00-$3.20 which would mean another huge fall and log period of consolidation.
Personally I'd prefer healthy price action with less consolidation time and an eventual 200%-300% gain in less time than it would take to get that with a quick 100% gain explosion out of the intended channel again with another very long consolidation time following it.

GRT Looking great keeping an eye for key daily close!The graph is showing lots of life the past couple days and currently is looking great sitting in the 0.3 FIB level. Im looking for a very key daily close in aprx. 1 hour from now above the 0.3 we are currently at. In my mind this shows lots of strength and momentum to keep going up.The stoch RSI and the RSI are both looking great pointing up and the MACD is actually showing some real signs off flipping to bullish! GRT has been among the top market leaders the past couple days and i think we definitely can keep it up. Remember if BTC keeps showing some strength and heading up almost all the market will aswell. NFA just my opinion!

The Graph [GRT] support & directionHi everyone,
Looking at the 4H timeframe, after a strong bearish move when hitting its ATH $2.88 in Mid. February, GRT seems to found support at its 0.618 Fib. retracement (~$1.25).
In case we can hold the grey trend line as support, other important levels can be tested as highlighted in the chart.
As these corrections are normal market cycles, I am still bullish on The Graph in the long run!
Strong fundamentals:
> Migration path to Mainnet starting in April 2021
> Team expansion
> Integration Clover Finance
In case we fall below the lower grey trendline that acts as support, above set-up will be invald
🌜 Please like and leave a comment 🌜
This is not financial advice

GRT usdt - Pullback from resistance levelsThe Graph saw a push the past few days.
But the resistance levels proved too much.
Interesting formation right now.
Pricing below slight falling EMA.

GRTUSD LONGGRT did a pullback to 618 and rejected nicely. Expecting it to pump to -68 extension when altseason starts. (we are still in bitcoin season FYI)
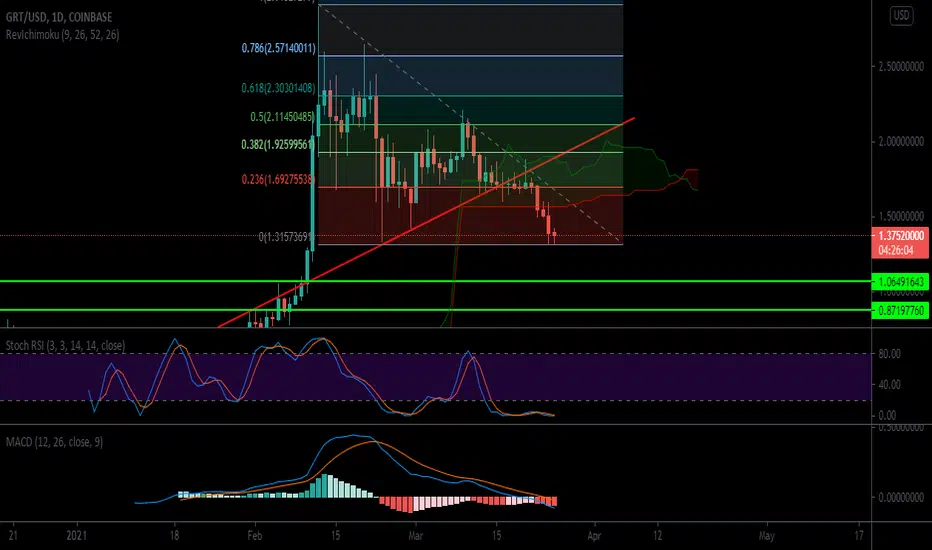
Crucial Level For GRT to hold!GRT has been dumping for awhile now but i do believe some of this is due to market conditions as of right now, we are looking to hold the 0 FIB for the second day in a row and i think we definitely can. we have lots of room for a runup to the 0.2 FIB ultimately creating new support on the way up. If we do breakthrough the zero fib and drop we are looking at weak supports at the 1.06$ mark and 0.87$ (USD) i think we are going to really count on BTC reversing in the short term to start seeing some upwards action. we see our Stoch Rsi is just going sideways in the oversold zone. I expect April is going to be a lot better for the markets as March is one of the most "bearish" months. Not financial advice just my opinion!

GRT getting ready for a big move!GRT has been trying to regain our long term resistance level but has been getting rejected multiple times, but i think grt is loading up for a big move we see the bollinger bands starting to squeeze and the stoch RSI has flipped as of right now to bullish and looking to explode out of the oversold zone. Aswell our wave trend oscillator is looking like we could see a reversal soon! definitely going to watching this one! we could see a really nice breakout here after recent downside and accumulation! NFA just my opinion

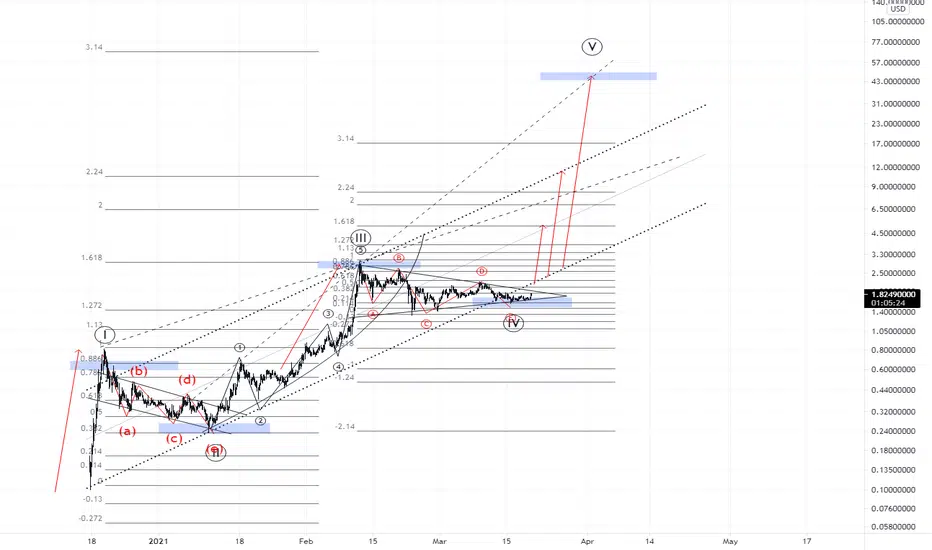
GRT to THE MOON! Elliot's wavesI'm GRT's holder from 0.4$
We can sell at 10-13$ zone as next targets.
We're at the end of the 4th wave.
5th wave must be 10-17 zone, extensive 40-50$ Then, is not a good idea to buy again, at least we have enough geometrical confirmations.
See you!

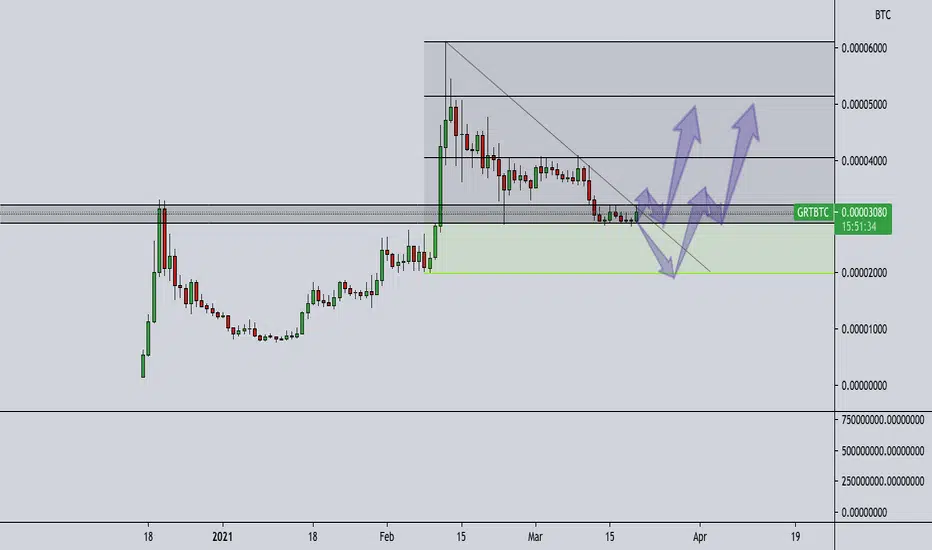
GRTBTCPrice came down to the low of the Weekly control candle, which is also a nice support/resistance flip area. I will wait for price to give more clues, before looking to enter a trade.
The Graph to BreakoutSince All time highs we have seen a 618 fib retracement, the MACD is now looking to turn around and push to the upside. A break up from here is now looking favourable IMO.
Targeting $2 is the first big hurdle to conquer
If GRT closes below this level expect good buy opportunitiesGRT has broken below "long" term resistance and currently the 0.2 FIB level. If we do see a close below the 0.2 today we could expect to see a dip, the ichimoku cloud has begun to turn downwards and our stoch RSI is actually oversold so it'll be interesting to see what the close will look like. potentially could get bought up quickly to shoot the price above the 0.2 fib but is probably unlikely but who knows! Either way we will see a very sweet buying opportunity or continue on the accumulation track! not financial advice just my opinion

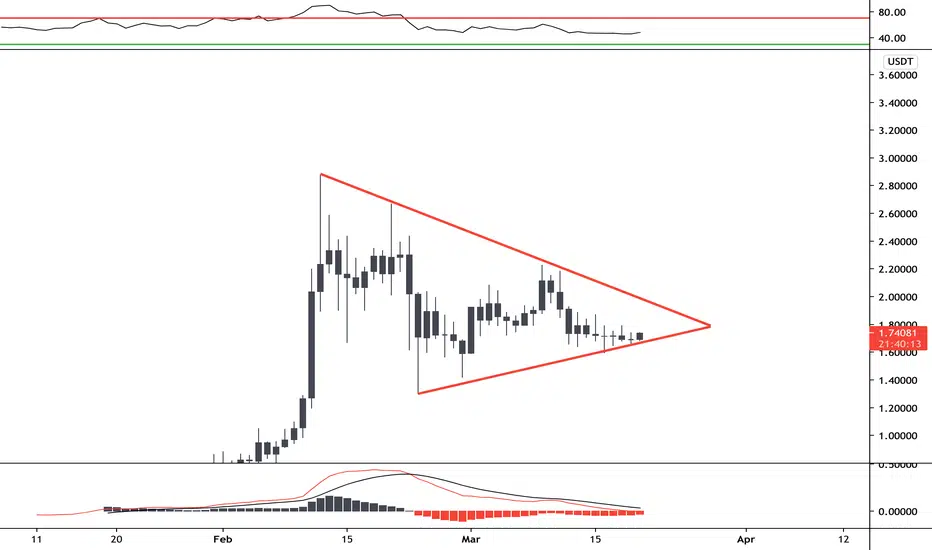
GRT/USDT Chart 18/03I'm not following GRT that much, but it looks weird that in this market condition it has been this still.
On the daily, volumes have been declining over the past weeks, except for a few spikes.
However, 13 and 34 MAs look like they may be set for crossing, which could bring some attention on GRT and push it to at least retest the 2.1 area.
Is there a triangle pattern going on? What do you think?
GRT Technical Analysis GRT has been forming this massive symmetrical wedge for a while.
Price tested the support level and held strong.
MACD looks bullish.
Price consolidation above 100MA level would indicate further uptrend. Right now it is acting as a strong resistance.
---
ARK invest and a few other institutions are HOLDING GRT. Any institutional buying of a coin gives it even more bullish potential.

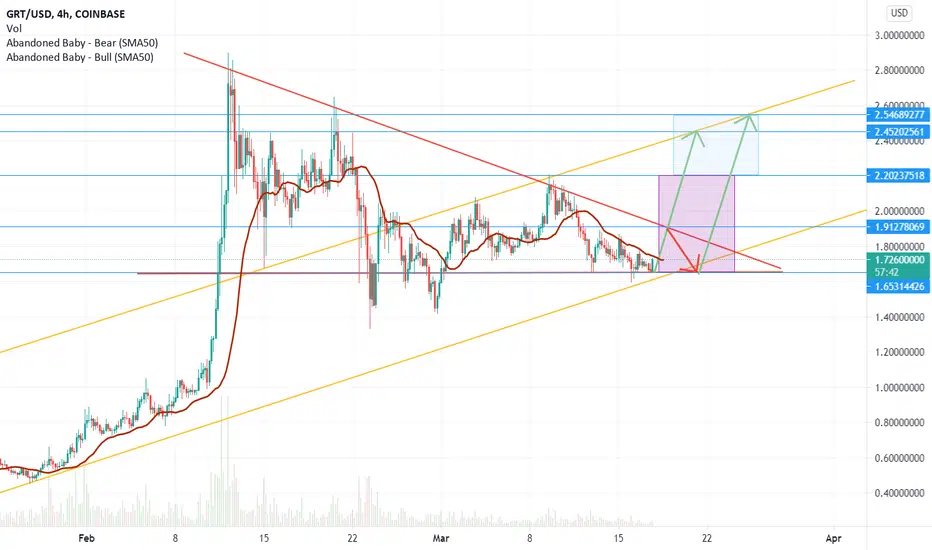
GRT dying to bust outThe graph has been consolidating in this bullish flag for almost an entire month. Two possible scenarios could playout:
First: GRT could bounce off the top trendline of the flag at $1.91 descending back to $1.65 price range, which has shown very strong support, before breaking out and uptrending to $2.54 price
Second: It bust through the top trend line passing $1.91 then on to retest $2.20 before ending up at the $2.45 TP
GRT due for a big moveGRT has gone through a cool off correction after hitting its ATH in beginning of Feb. we have been seeing recent pushes up in our candles and then coming backdown throughout the days, I am looking for a golden cross on the MACD hinting at upcoming big movement for grt, also tomorrow i think we could see price come back up as our Stoch RSI is coming back up from the oversold zone. Ema ribbons slightly up but for the most part pointing sideways. I expect us to see some nice movement in GRT soon. Worst case if we do break into the 0.2 FIB which the bulls have so far been holding we could see a little more of a drop somewhere in the 0.2 level, i think this is the more unlikely scenario but if it does happen i will be buying the dip! Not financial advice just my opinion.

Triangle pattern support levels still holding Unlike NuCypher, GRT has held its support levels. For this reason I think we will eventually break out, and trade a previous all time high. Beware of a potential downside breakout. In that case I will open a short position, although I don't think this will be the case. Its very dependent of bitcoin unfortunately, so keep a close eye on BTC. Not financial advice and cheers✌️💫🚀
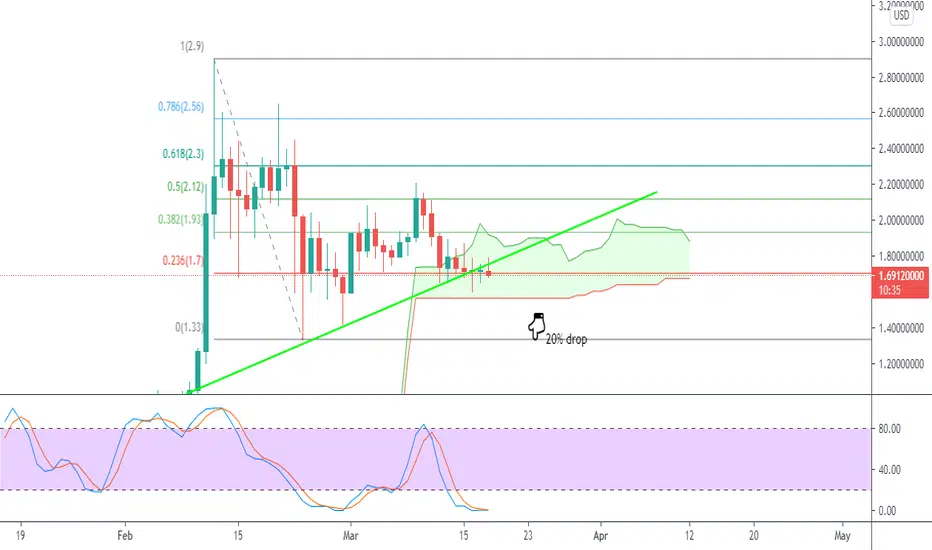
Update on The GRT Buy Potential 70% Gain back to ATHScript Buy signal triggered 02/03/21, 13 EMA crossing up 50 SMA signalling strong buy sentiment back in the market. The GRT reached its ATH on 12/02/21 at $2.88, and has since retraced back down after a very parabolic move up to the $2.88 level, down to $1.32. During the downward move The GRT has shown resistance at key Fibonacci levels, testing the 200 SMA on the 23/02/21 just 11 days after this huge move to the upside. From the current price levels, there are 2 possible scenarios I can see playing out here after the 200 SMA level was tested.
1. We could see a push phase back to the ATH levels of $2.88914 or..
2. The more likely scenario of another test of the 200 SMA which would form a double bottom , further signalling and confirming our bullish bias back to the ATH levels.
*Update 03/03/21* The Graph did test the 200 SMA Again and has since triggered a strong BUY signal with the 13 EMA Crossing Up 50 SMA . New Fresh Highs Insight!!
Update 15/03/21
Currently The GRT is below the 200 SMA, we expect some downward pressure in the short term but expect the Bulls to be back in the market, If the 13 EMA crosses up this would be another strong buy signal back to the upside.
Note that the move back to the upside may be faced with some resistance specifically at the 0.382 and 0.7862 Fib retracement levels.
Overall The GRT is still in a bullish outlook long-term. Use the Buy Zone as a guide for the perfect sniper entry.

GRT - The Graph Is Headed DownThe Graph!
Target 1: 0.9967 ---- 0.9452
I have laid out a projection based off current price action
My projection is based off a few factors including order block analysis
Once we reach the price zone I will re-analyze for the next move
The Graph like many other alt coins are preparing for their next bull run
Hope you are getting your bags ready!
