[Deep Dive] SEI – Edition 2: From Pain to Power: A Bull Cycle?SEIUSDT may have just flipped the script.
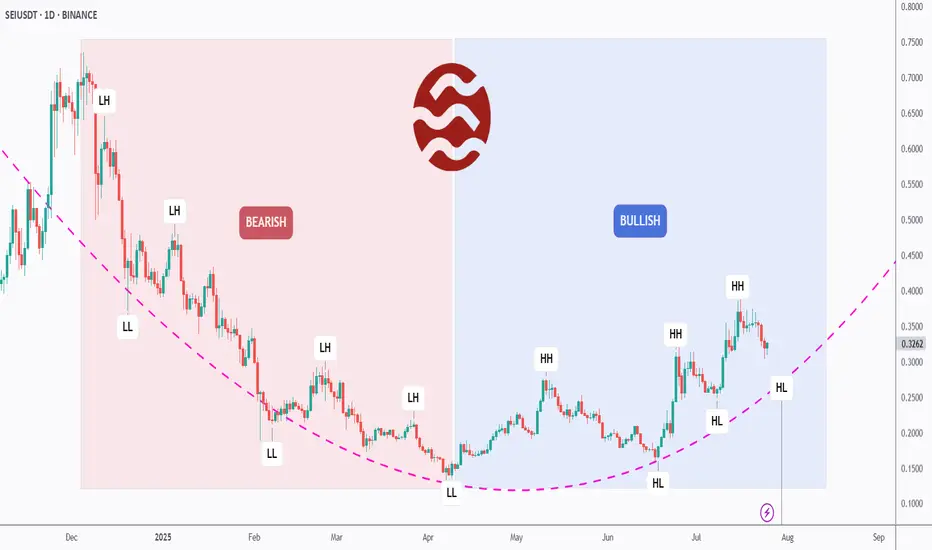
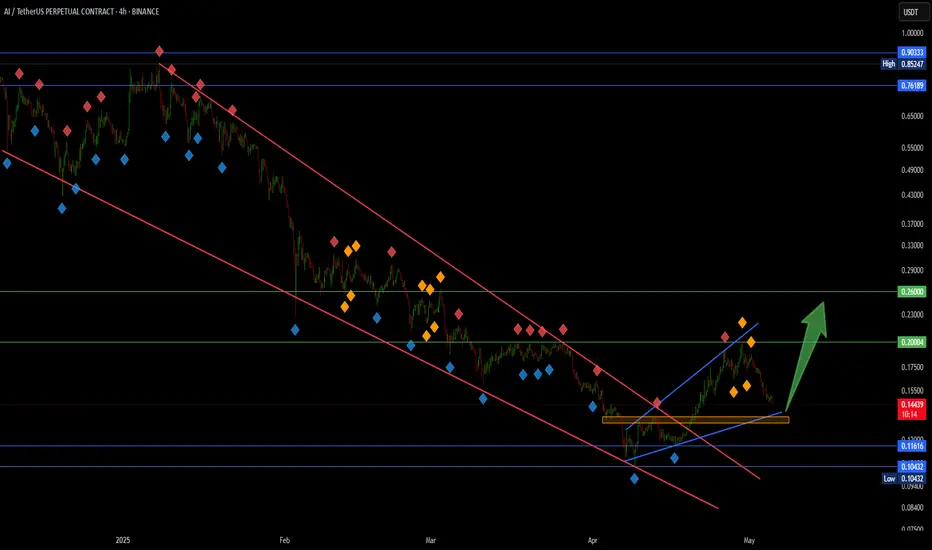
After months of consistent lower highs and lower lows, SEI has officially broken its bearish structure and is now printing clear higher highs (HH) and higher lows (HL) — a textbook sign of a trend reversal.
📉 Left Side: Bearish Breakdown
From late 2023 to Q2 2025, SEI was stuck in a painful macro downtrend. The structure was brutally clean: LH → LL → LH → LL. Each bounce was weaker than the last, reflecting exhausted buyers and relentless supply.
But something changed in late Q2…
📈 Right Side: Bullish Rebuild
Since its final low around April, SEI began to carve a new path. What started as a subtle accumulation quickly morphed into a solid structure of higher highs and higher lows.
The arc-shaped pink trendline tracks this momentum shift — and we’re now watching a potential continuation of the bullish cycle.
The most recent HL is forming exactly on that curve — a critical moment where bulls may step in for the next impulsive move.
🔥 What’s Fueling the Shift?
SEI is gaining traction as a high-performance Layer 1 designed for trading apps, with native parallelization and a focus on speed and throughput.
Its recent ecosystem growth — including projects in DeFi, gaming, and infrastructure — has started to attract both retail and VC attention.
On-chain metrics are showing increased activity, and whispers of upcoming protocol incentives could be the spark that pushes SEI toward the $0.45–$0.50 range.
🧠 What We’re Watching
- The current HL zone — will bulls defend this level?
- If SEI can break above the previous HH, the bullish structure strengthens.
- A failure to hold this HL would suggest a range or even deeper correction — so risk management is key.
Let’s recap:
- Structure has flipped bullish ✅
- SEI is riding a fresh higher low ✅
- Fundamental momentum is building behind the scenes ✅
It’s now up to the market to decide if this was just a bounce — or the beginning of a much bigger move.
💬 What do YOU think: Is SEI building steam for a breakout, or just teasing us with a fakeout?
🔔 Disclaimer: This analysis is for educational and informational purposes only. It does not constitute financial advice or a recommendation to buy or sell any asset. Always do your own research and manage your risk accordingly.
📚 Always follow your trading plan => including entry, risk management, and trade execution.
Good luck!
All strategies are good, if managed properly.
~ Richard Nasr
Thesignalyst
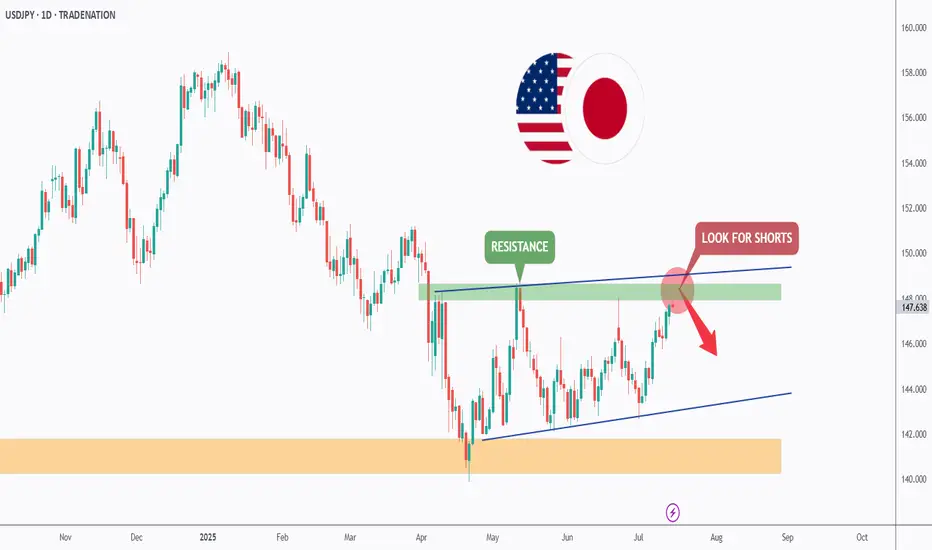
USDJPY - Trade The Range!Hello TradingView Family / Fellow Traders. This is Richard, also known as theSignalyst.
📈USDJPY has been trading within a range between $140 and $150 round numbers and it is currently retesting the upper bound of the range.
📚 As per my trading style:
As #USDJPY is around the red circle zone, I will be looking for bearish reversal setups (like a double top pattern, trendline break , and so on...)
📚 Always follow your trading plan regarding entry, risk management, and trade management.
Good luck!
All Strategies Are Good; If Managed Properly!
~Rich
Disclosure: I am part of Trade Nation's Influencer program and receive a monthly fee for using their TradingView charts in my analysis.
GOLD (Head and Shoulders) BEARISHHello all,
GOLD is about to break the neck support of the Head and Shoulders pattern.
And about to locate the up trend.
Enjoy
MIZ

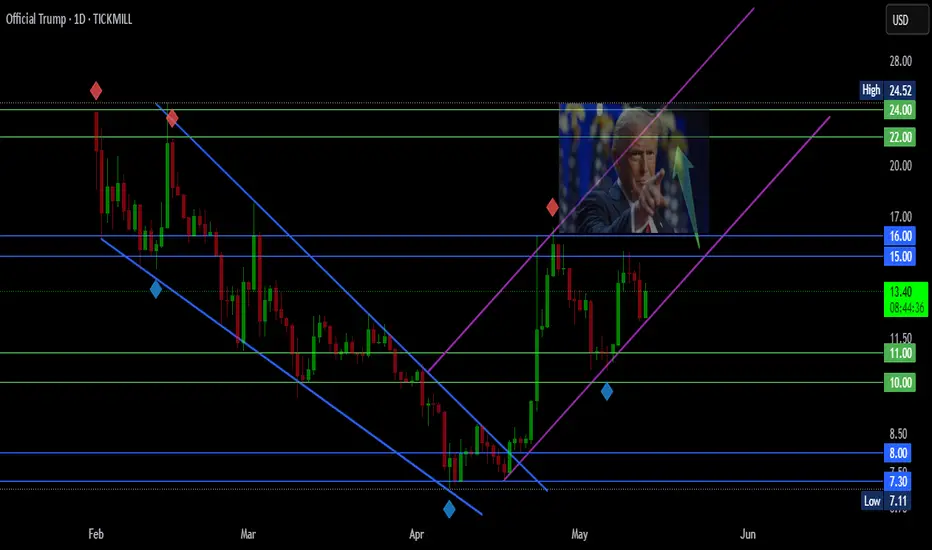
TRUMP is always the LEADER !!!!!!Hello all,
Again and again, Mr. President Donald TRUMP is the leader.
He is clever enough.
Enjoy
MIZ
Let us deliver the BANANA to the treeHello all,
We will see the BANANA back to the tree.
So let us help it !!!
Enjoy
MIZ

FLOKI to the MOON ????Hello all,
Let this grazy coin do some correction and take the rocket take off.
Enjoy
MIZ

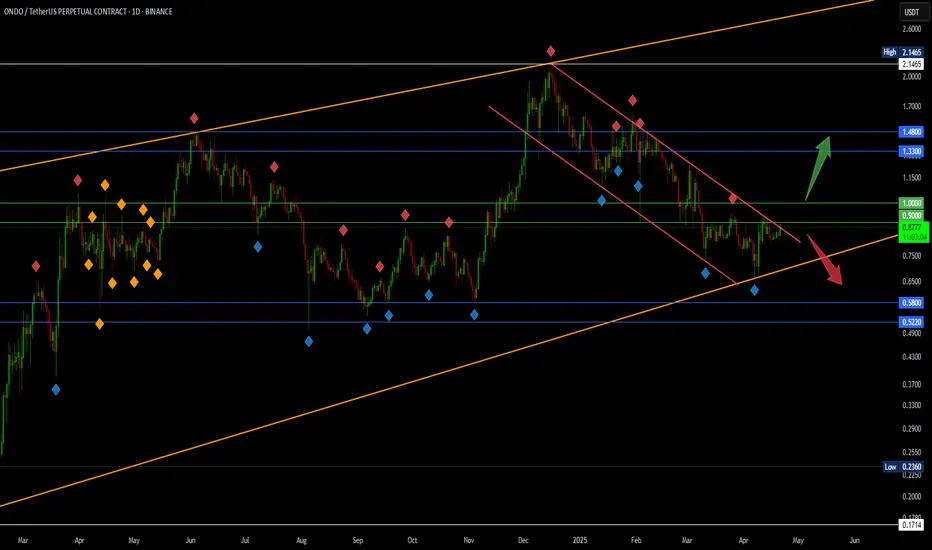
ONDO Let it decide Long or ShortHello all,
I think this coin finished the deep correction, and waiting the confirmation to take off.
Enjoy
MIZ

COPPER - Following Gold?Hello TradingView Family / Fellow Traders. This is Richard, also known as theSignalyst.
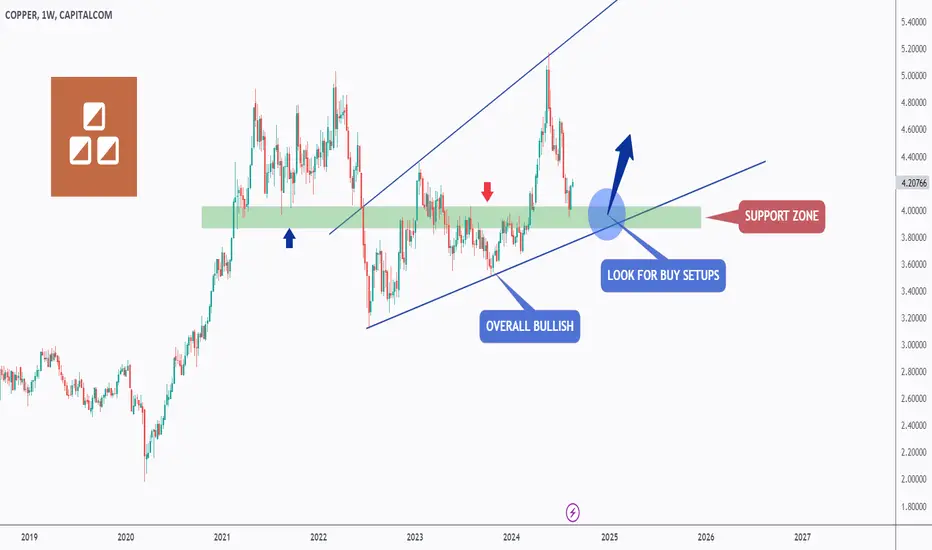
📈 COPPER has been overall bullish, trading inside the rising wedge pattern in blue.
At present, COPPER is undergoing a correction phase and it is hovering around the lower bound of the wedge.
Moreover, it is retesting a massive support zone marked in green.
🏹 Thus, the highlighted blue circle is a strong area to look for buy setups as it is the intersection of the green support and lower blue trendline acting as a non-horizontal support.
📚 As per my trading style:
As #COPPER approaches the blue circle zone, I will be looking for bullish reversal setups (like a double bottom pattern, trendline break , and so on...)
📚 Always follow your trading plan regarding entry, risk management, and trade management.
Good luck!
All Strategies Are Good; If Managed Properly!
~Rich
GOOGL - After every Storm, there is a Rainbow 🌈Hello TradingView Family / Fellow Traders. This is Richard, also known as theSignalyst.
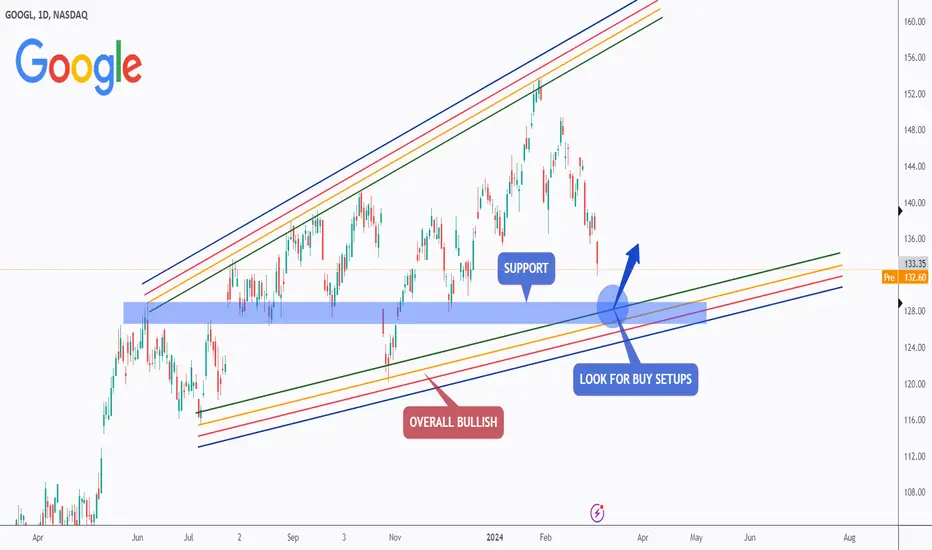
📈 GOOGL has been overall bullish, trading within the rising rainbow wedge pattern.
Currently, GOOGL is in a storm 🌪/ correction phase and it is approaching the lower bound of the wedge acting as a non-horizontal support.
Moreover, it is retesting a strong support zone at $128 marked in blue.
🏹 Thus, the highlighted blue circle is a strong area to look for buy setups as it is the intersection of the blue support and lower rainbow trendline.
📚 As per my trading style:
As #GOOGL is around the blue circle zone, I will be looking for bullish reversal setups (like a double bottom pattern, trendline break , and so on...)
📚 Always follow your trading plan regarding entry, risk management, and trade management.
Good luck!
All Strategies Are Good; If Managed Properly!
~Rich
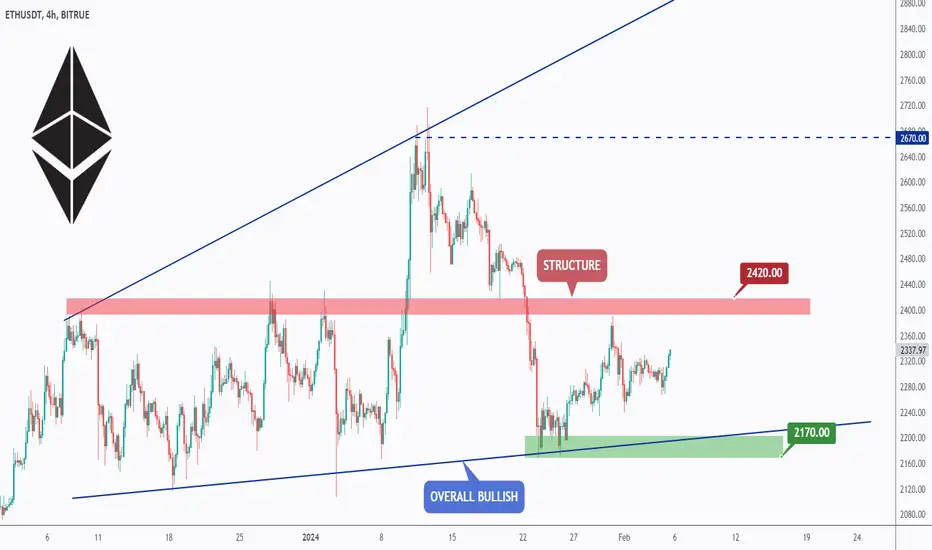
ETH - Patience Is Key⏱Hello TradingView Family / Fellow Traders. This is Richard, also known as theSignalyst.
ETH has been stuck inside a narrow range between 2200 and 2400.
📈 For the bulls to take over, we need a break above the 2420 structure marked in red.
In this case, a movement till the 2670 would be expected.
📉 In parallel, if the lower blue and trendline and the last major low at 2170 marked in green are broken downward, we will expecting further bearish movement till the 2000 support.
For now, we wait ⏱
Which scenario do you think is more likely to happen? and why?.
📚 Always follow your trading plan regarding entry, risk management, and trade management.
Good luck!
All Strategies Are Good; If Managed Properly!
~Rich
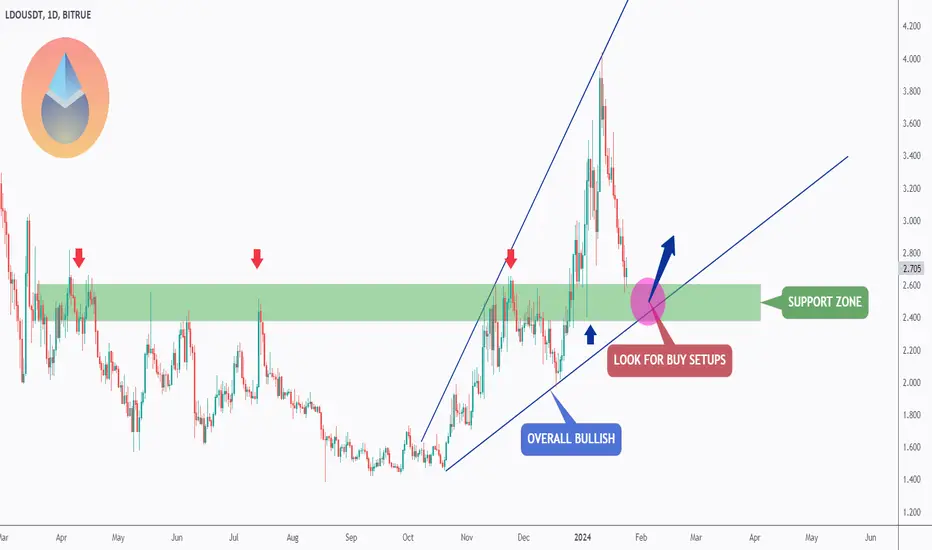
LDO - Following The Wedge 🌙Hello TradingView Family / Fellow Traders. This is Richard, also known as theSignalyst.
📈 LDO has been overall bullish, trading within the rising broadening wedge in blue.
At present, LDO is undergoing a correction phase and it is currently approaching the lower blue trendline acting as a non-horizontal support.
Moreover, it is retesting a strong support zone marked in green.
🏹 Thus, the highlighted purple circle is a strong area to look for buy setups as it is the intersection of the green support and lower blue trendline acting as a non-horizontal support.
📚 As per my trading style:
As #LDO approaches the lower purple circle zone, I will be looking for bullish reversal setups (like a double bottom pattern, trendline break , and so on...)
📚 Always follow your trading plan regarding entry, risk management, and trade management.
Good luck!
All Strategies Are Good; If Managed Properly!
~Rich
XRP - Wait For It 🏹Hello TradingView Family / Fellow Traders,
XRP has been overall bearish trading inside the falling channel in red.
However it is currently approaching the lower bound of the channel and a strong support at 0.54.
📈 As long as the support holds, we will be looking for short-term buy setups on lower timeframes.
🏹 For the bulls to take over from a medium-term perspective, we need a break above the last major high at 0.625.
📉 If the 0.54 support is broken downward, we will expect further bearish movement till the 0.5 support where we will be looking for new short-term buy setups.
📚 Always follow your trading plan regarding entry, risk management, and trade management.
Good luck!
All Strategies Are Good; If Managed Properly!
~Richard Nasr

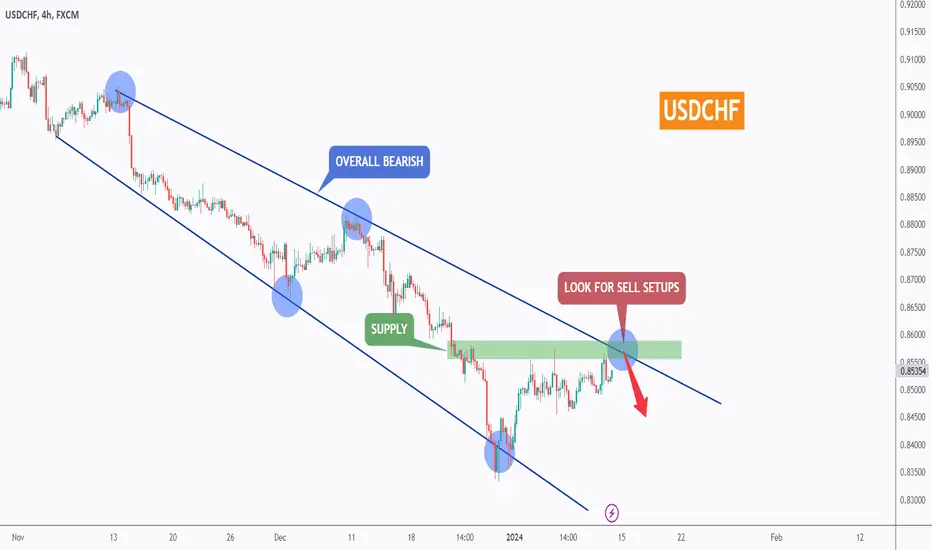
USDCHF - Follow The Trend 🐻Hello TradingView Family / Fellow Traders,
📈 USDCHF been overall bearish , trading inside the falling blue channel and it is currently approaching the upper blue trendline.
Moreover, the zone 0.86 is a robust supply zone.
🎯 Therefore, the highlighted red circle represents a significant area to consider for potential sell setups, as it marks the intersection of the green supply and upper blue trendline.
📚 As per my trading style:
As USDCHF approaches the blue circle zone, I will be actively searching for bearish reversal setups to capture the next bearish impulse movement.
📚 Always follow your trading plan regarding entry, risk management, and trade management.
Good luck!
All Strategies Are Good; If Managed Properly!
~Richard Nasr
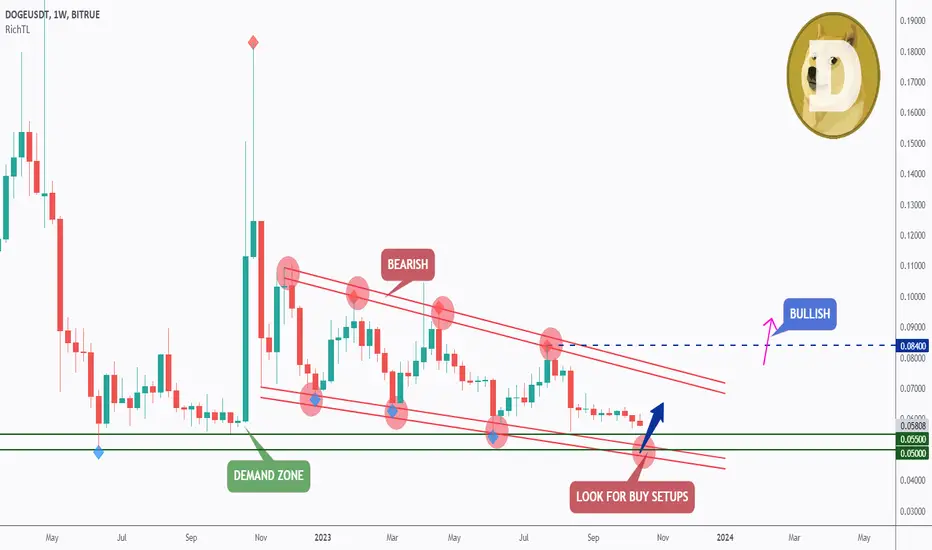
DOGEyyy-Doo, Where Are You🐕Hello TradingView Family / Fellow Traders. This is Richard, also known as theSignalyst.
📉 DOGE has been overall bearish trading inside the falling red channel and it is currently approaching the lower bound / red trendline.
Moreover, the 0.05 - 0.055 is a strong demand zone.
🏹 So the highlighted red circle is a strong area to look for buy setups as it is the intersection of the green demand and lower red trendline acting as a non-horizontal support.
📚 As per my trading style:
As DOGE approaches the lower red circle zone, I will be looking for bullish reversal setups (like a double bottom pattern, trendline break , and so on...)
🔎 From a long-term perspective, for the bulls to take over, we need a break above the last major high around 0.084 highlighted in blue.
📚 Always follow your trading plan regarding entry, risk management, and trade management.
Good luck!
All Strategies Are Good; If Managed Properly!
~Rich
EURCHF - Now OverBought ↘️Hello TradingView Family / Fellow Traders. This is Richard, also known as theSignalyst.
As per my last analysis, attached on the chart, we have been looking for buy setups around the lower bound of the red channel.
EURCHF traded higher and it is now approaching the upper bound of the channel again.
Moreover, the zone 0.97 is a strong resistance.
🏹 So the highlighted red circle is a strong area to look for sell setups as it is the intersection of the blue resistance and upper red trendline acting as a non-horizontal resistance.
As per my trading style:
As EURCHF is sitting around the upper red circle zone, I will be looking for bearish reversal setups (like a double top pattern, trendline break , and so on...)
Knowing that EURCHF can still test the 0.97 resistance before going down.
📚 Always follow your trading plan regarding entry, risk management, and trade management.
Good luck!
All Strategies Are Good; If Managed Properly!
~Rich

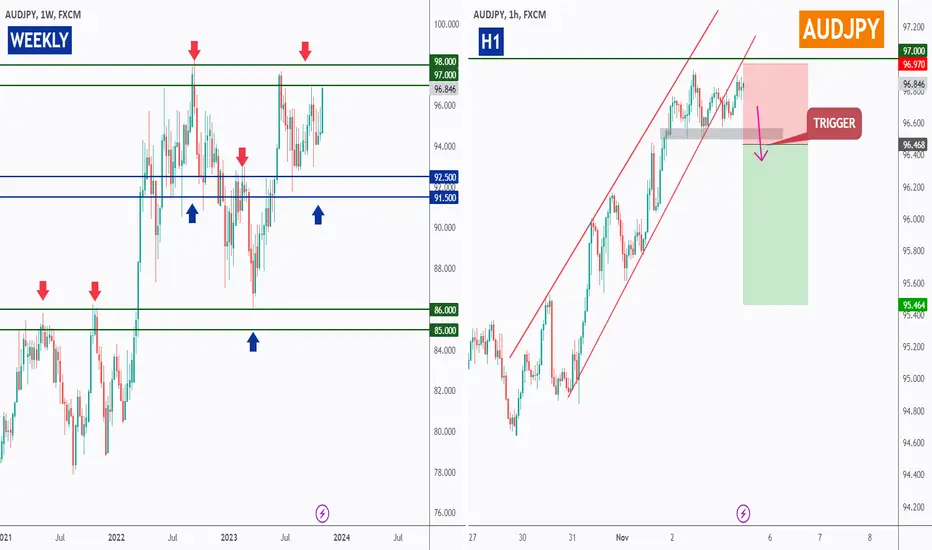
AUDJPY - Long Story SHORT !Hello TradingView Family / Fellow Traders. This is Richard, also known as theSignalyst.
on Weekly: Left Chart
AUDJPY has been stuck inside a big range and it is currently hovering around the upper bound / resistance zone in green.
on H1: Right Chart
For the bears to take over, and activate our sell setup, we need a break below the last low highlighted in gray.
Meanwhile, AUDJPY would be bullish and can still trade higher inside the weekly resistance 97.0 - 98.0
📚 Always follow your trading plan regarding entry, risk management, and trade management.
Good luck!
All Strategies Are Good; If Managed Properly!
~Rich
GBPCHF - Detailed Video Analysis 📹 From Daily To H1Hello TradingView Family / Fellow Traders. This is Richard, also known as theSignalyst.
📈 Here is a detailed update top-down analysis for #GBPCHF.
Which scenario do you think is more likely to happen? and Why?
📚 Always follow your trading plan regarding entry, risk management, and trade management.
Good Luck!.
All Strategies Are Good; If Managed Properly!
~Rich

GBPCHF - Following The Trend 🏄♀️Hello TradingView Family / Fellow Traders. This is Richard, also known as theSignalyst.
📉GBPCHF has been overall bearish trading inside the falling blue channel, and it is currently approaching around the upper trendline.
Moreover, the zone 1.11 is a strong resistance.
🏹 So the highlighted blue circle is a strong area to look for sell setups as it is the intersection of the red resistance and upper blue trendline acting as a non-horizontal resistance.
As per my trading style:
As GBPCHF approaches the blue circle zone, I will be looking for bearish reversal setups (like a double top pattern, trendline break , and so on...)
📚 Always follow your trading plan regarding entry, risk management, and trade management.
Good luck!
All Strategies Are Good; If Managed Properly!
~Rich

BTC - The party has just Started 🎊📹Hello TradingView Family / Fellow Traders. This is Richard, also known as theSignalyst.
📈 Here is a detailed update top-down analysis for #BTC.
Which scenario do you think is more likely to happen? and Why?
📚 Always follow your trading plan regarding entry, risk management, and trade management.
Good Luck!.
All Strategies Are Good; If Managed Properly!
~Rich

EURJPY - Detailed Video Analysis 📹 From Daily To H1Hello TradingView Family / Fellow Traders. This is Richard, also known as theSignalyst.
📈 Here is a detailed update top-down analysis for #EURJPY.
Which scenario do you think is more likely to happen? and Why?
📚 Always follow your trading plan regarding entry, risk management, and trade management.
Good Luck!.
All Strategies Are Good; If Managed Properly!
~Rich

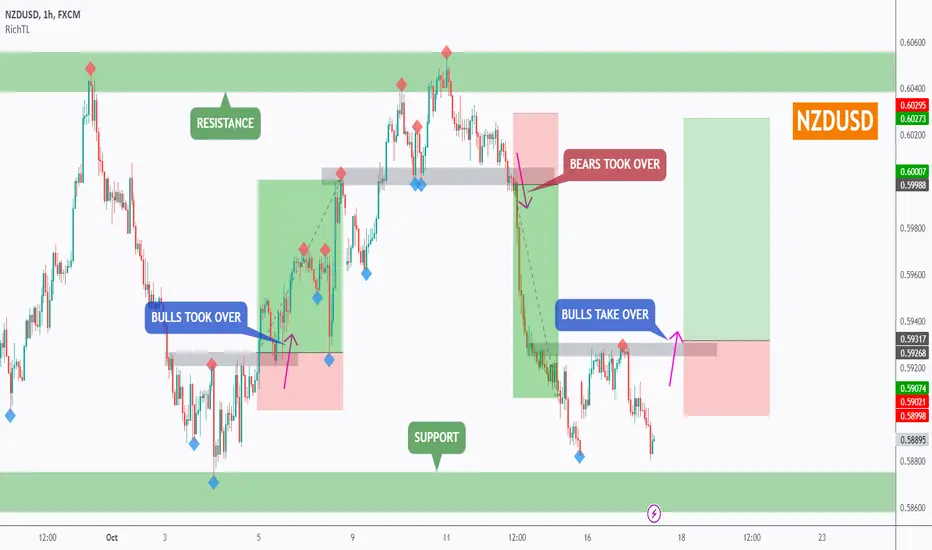
NZDUSD - Trading The Range 🌊Hello TradingView Family / Fellow Traders. This is Richard, also known as theSignalyst.
NZDUSD has been trading inside a big range between 0.587 and 0.605 and it is currently sitting around the lower bound so we will be looking for buy setups.
NZDUSD is in the making of a potential double bottom pattern, but it is not ready to go yet.
🏹 For the bulls to take over, we need a break above the gray neckline at 0.5932
Meanwhile, until the buy is activated, NZDUSD can still trade lower.
📚 Always follow your trading plan regarding entry, risk management, and trade management.
Good luck!
All Strategies Are Good; If Managed Properly!
~Rich