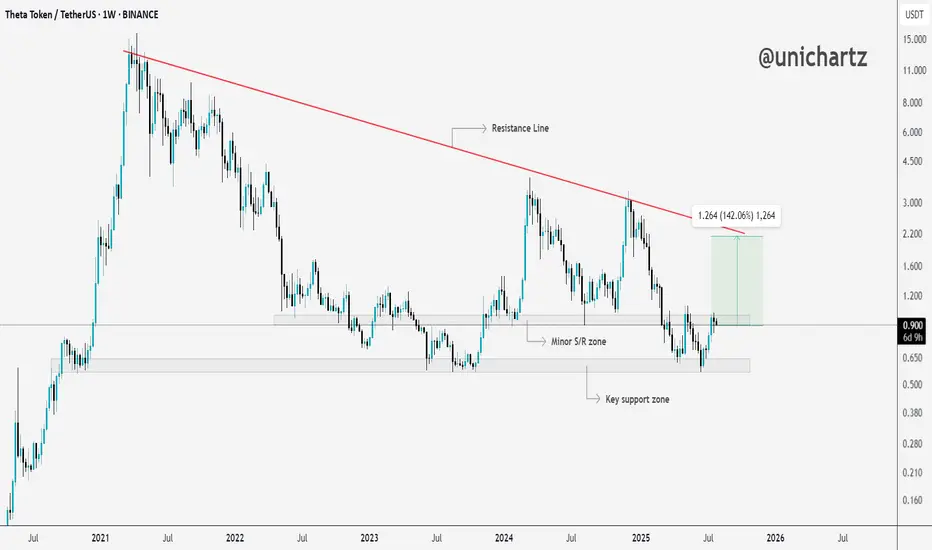
THETA Bounces Off Key Support – Eyes on Resistance!After months of holding above the key support zone, MYX:THETA is finally showing some strength.
Price is bouncing off the lows and heading toward a minor S/R zone.
If the bulls can break through this level, there’s a good chance we’ll see a move all the way up to the upper resistance line.
DYOR, NFA
Theta
THETA Long Swing Setup – Accumulation Phase Near BreakoutTHETA is still consolidating in a range, but momentum is quietly building. A break above $1.07 followed by a higher low would confirm structural reversal. We’re eyeing the $0.95–$1.00 zone for a clean entry on retest, offering solid risk-reward if support holds.
📌 Trade Setup:
• Entry Zone: $0.95 – $1.00
• Take Profit Targets:
o 🥇 $1.60 – $1.70
o 🥈 $2.10 – $2.20
• Stop Loss: Daily close below $0.90

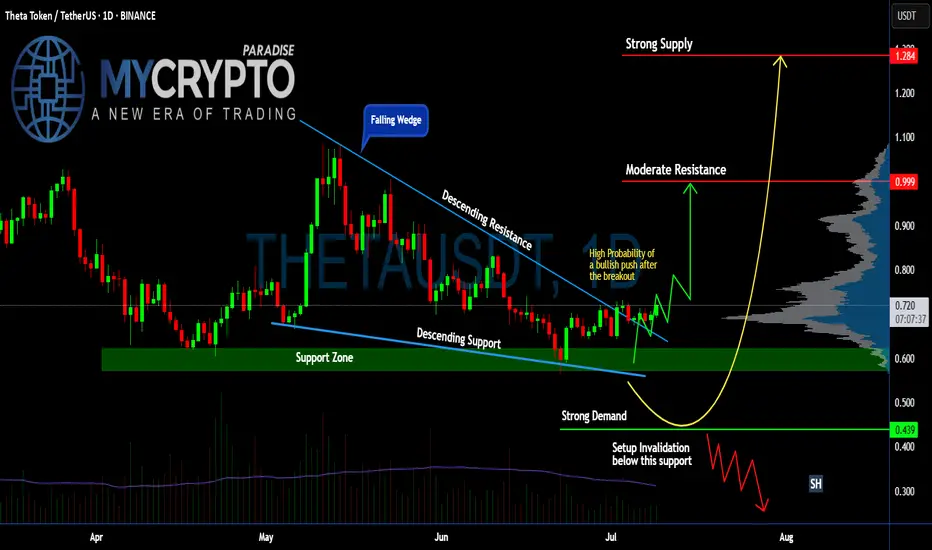
Is #THETA Ready For a Major Reversal or Another Fakeout ahead?Yello, Paradisers! Is this breakout the beginning of a bullish reversal for #THETA or just a setup to trap the herd before a sharp dump? Let’s break down the setup of #ThetaNetwork:
💎After weeks of slow bleeding inside a falling wedge, #THETAUSDT has broken out of this pattern. The price is currently hovering around $0.718, and it’s the first time in weeks we’re seeing real bullish momentum starting to build. The volume is slowly picking up, so the probability of a bullish push is higher.
💎A clean breakout above the descending resistance now opens the door toward moderate resistance at $0.999. That’s the next key hurdle where we expect sellers to show up. If bulls are strong enough to clear that zone, we’re targeting the strong supply level at $1.284, where significant distribution will likely begin.
💎Why this setup matters: The support zone between $0.60 and $0.66 has acted as strong demand for multiple weeks now for #THETAUSD. Price wicked into it again recently and got bought up quickly, forming a potential higher low. This kind of accumulation behavior often precedes a strong leg up if volume confirms the move.
💎However, if price loses the key support at $0.60, and more importantly breaks below the setup invalidation level at $0.439, we’ll treat this as a failed breakout and expect a deeper correction. That would bring us back into the lower demand zones, and we’ll sit on our hands until the next proper high-probability entry appears.
Stay patient, Paradisers. Let the breakout confirm, and only then do we strike with conviction.
MyCryptoParadise
iFeel the success🌴
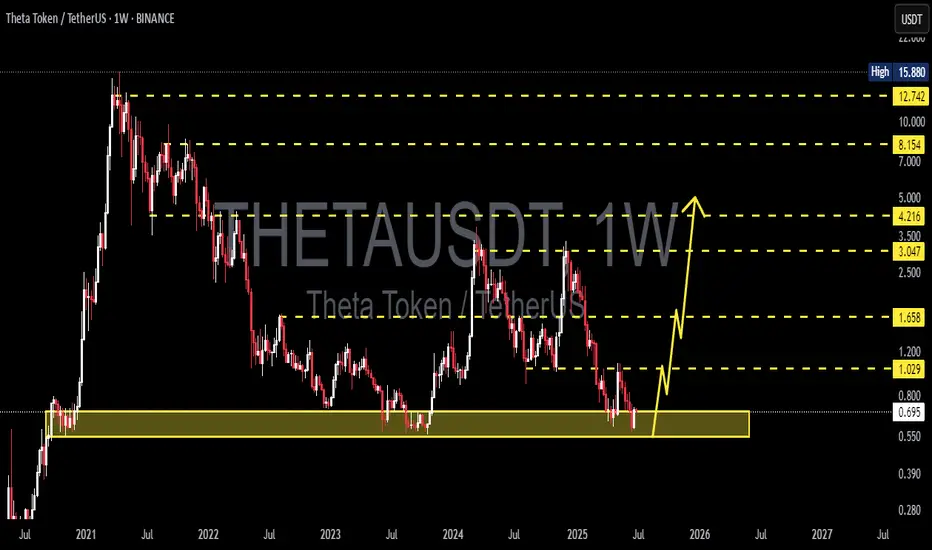
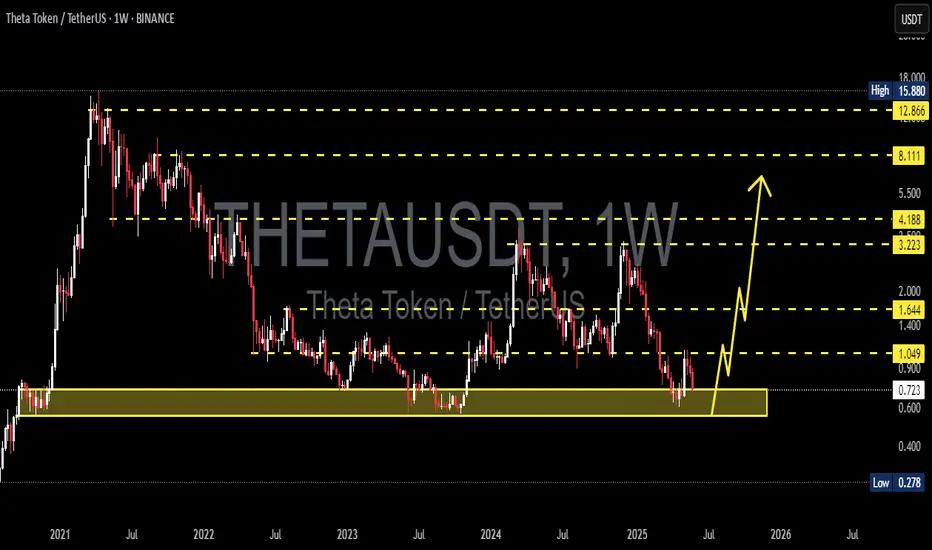
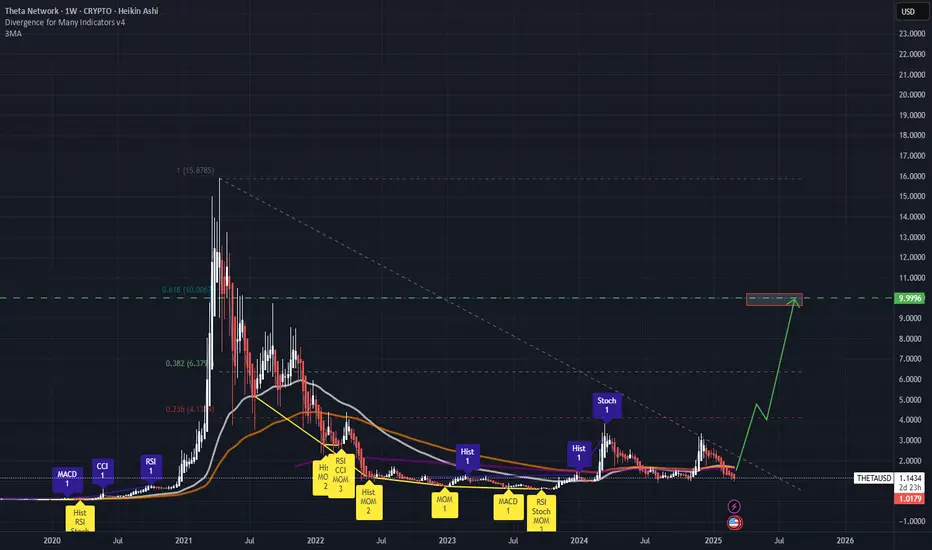
THETA Holding the Line – A Hidden Gem Before the Next Altseason?
🔍 Chart Structure and Key Zones:
Timeframe: 1W (Weekly)
Major Historical Support: The yellow zone between $0.55 - $0.70 has been tested multiple times since 2021.
The current price is once again retesting this strong support area, showing signs of a potential bullish bounce.
📈 Bullish Scenario:
If the support at $0.696 holds and triggers a reversal:
Potential short-term targets are:
$1.029 as the first minor resistance
Breakout above $1.658 could lead to a rally toward:
$3.047
$3.50
$4.216
If bullish momentum sustains, long-term targets include:
$8.154
$12.742
And possibly a retest of the all-time high at $15.880
> This price action suggests the formation of a potential Double Bottom pattern — a classic bullish reversal signal on higher timeframes.
📉 Bearish Scenario:
If price breaks below the support zone of $0.696 – $0.55:
The bullish setup becomes invalidated.
There is little significant support below $0.55, which could lead to an aggressive selloff.
This would indicate a possible final capitulation phase before a true macro bottom is formed.
📊 Chart Pattern Insight:
Potential Double Bottom forming in a high-confluence support zone
Signs of accumulation structure with long lower wicks (indicating buyers stepping in)
Bullish impulse projection is marked if a breakout confirms
🔖 Conclusion:
The $0.55 - $0.70 zone is a critical turning point for THETA.
If held, this could mark the beginning of a long-term trend reversal.
The current setup offers a favorable risk-reward ratio for swing and long-term traders, though caution is needed if the support fails.
#THETAUSDT #THETA #CryptoAnalysis #TechnicalAnalysis #CryptoBreakout #BullishReversal #AltcoinSeason #SupportAndResistance #DoubleBottom #SwingTrade
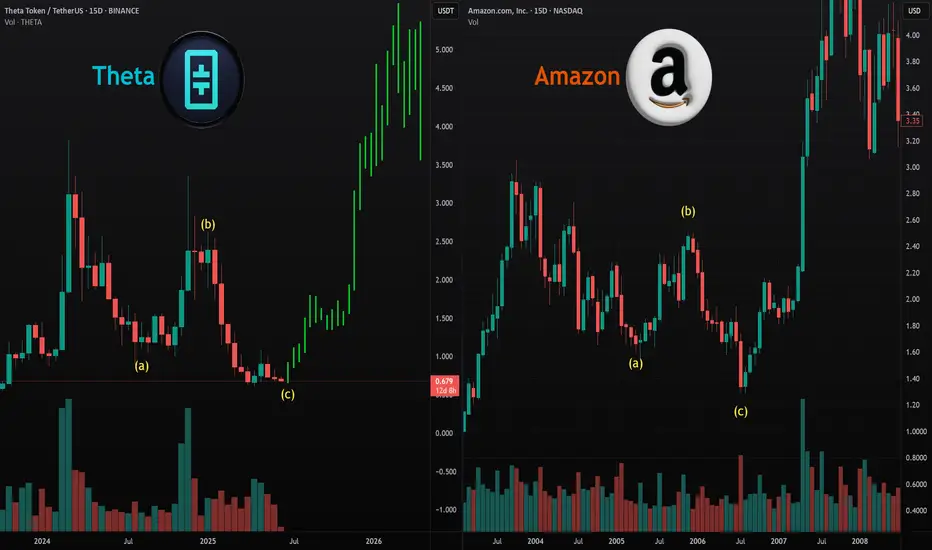
Theta Is Ready for a Strong Recovery Soon!Looking at Theta, I see strong potential for a recovery very soon. We just completed a classic ABC correction, very similar to what Amazon experienced back in the day. I expect a big bullish move on this coin shortly. We are primed for a strong reversal here.
Theta is undervalued on both the higher and lower time frames, and with such strong project fundamentals, I see this as a major mover in the upcoming altcoin bull market. There’s potential for insane gains on the larger time frames and a strong recovery on the smaller ones.
Don’t focus on the news or media—crypto is ready for big things. As always, stay profitable.
— Dalin Anderson
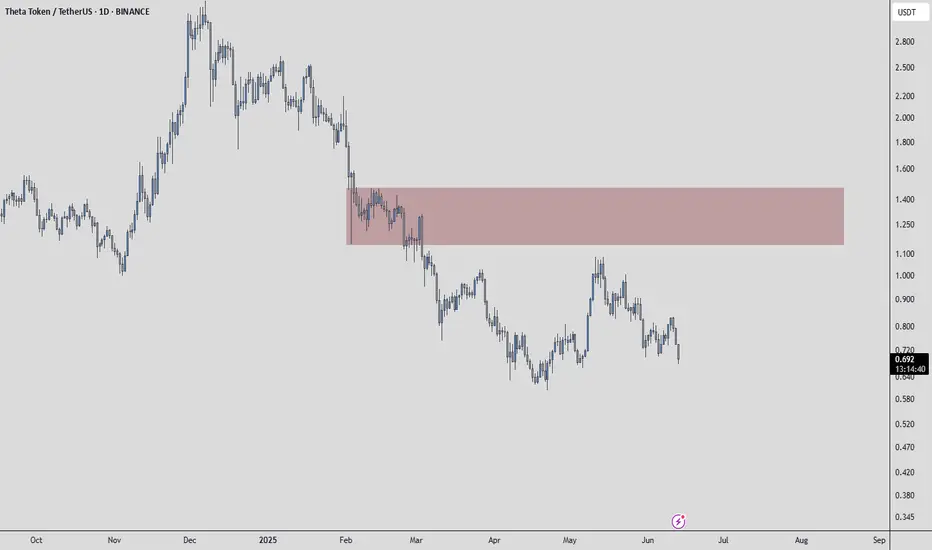
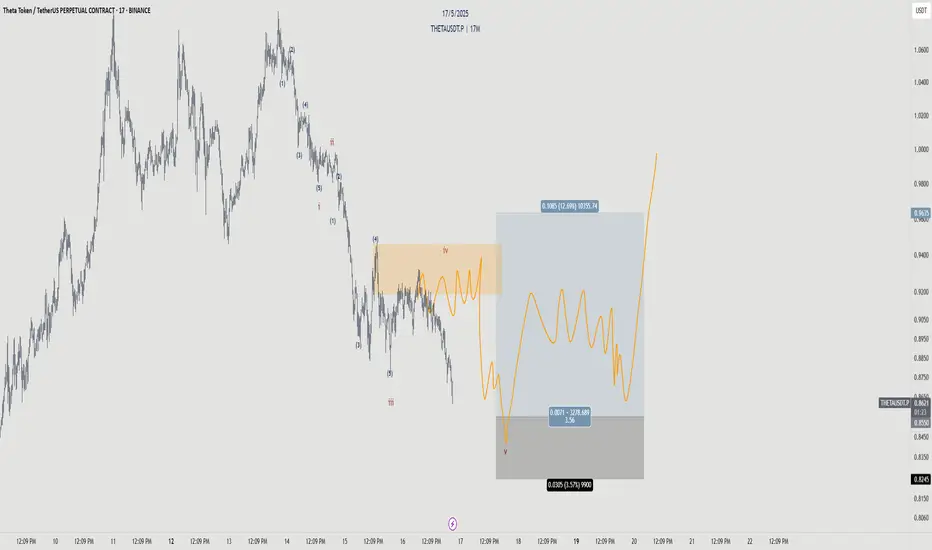
THETAUSDT: Weak Buyers & Your Short Opportunity in the Red BoxAlright everyone, with a critical update on THETAUSDT. Here’s the stark truth: buyers, in general, are weak. This isn't a market signaling strong demand, and it's a mistake to think otherwise.
Most traders get trapped by false signals. But you? You need a clear, confirmed path to profit. My strategy for THETAUSDT is precise: I absolutely will not take a short without clear confirmation from the red box. This isn't about guessing; it's about making calculated moves where the market reveals its true intent.
Look at the chart. That red box I've identified? That's your critical zone for potential short entries. When price engages with this area, we're not just watching; we're hunting for specific signals:
Volume Footprint: I'll be meticulously checking the volume footprint within that red box. Are sellers truly overwhelming buyers? Is there genuine distribution happening, not just a momentary pause?
CDV (Cumulative Delta Volume): Watch for CDV to turn definitively negative or show strong bearish divergences. This tells you the sellers are gaining true control, not just a fleeting advantage.
LTF Breakdowns: On the low timeframes (LTF), I need to see clear, decisive breakdowns. We're looking for price to fail, retest the red box as new resistance, and then continue its move lower. This is your confirmation.
Why does this matter? My focus is exclusively on assets showing a sudden and significant increase in volume. While THETAUSDT might not be seeing a bullish volume surge, understanding the volume dynamics within its weakness is how we pinpoint high-probability short setups.
Keep a very close eye on that red box. If the bearish confirmations line up, you'll uncover a clear, strategic short entry. Don't be surprised if THETAUSDT's price action confounds the masses; this is where smart, confirmed decisions are made.
📌I keep my charts clean and simple because I believe clarity leads to better decisions.
📌My approach is built on years of experience and a solid track record. I don’t claim to know it all but I’m confident in my ability to spot high-probability setups.
📌If you would like to learn how to use the heatmap, cumulative volume delta and volume footprint techniques that I use below to determine very accurate demand regions, you can send me a private message. I help anyone who wants it completely free of charge.
🔑I have a long list of my proven technique below:
🎯 ZENUSDT.P: Patience & Profitability | %230 Reaction from the Sniper Entry
🐶 DOGEUSDT.P: Next Move
🎨 RENDERUSDT.P: Opportunity of the Month
💎 ETHUSDT.P: Where to Retrace
🟢 BNBUSDT.P: Potential Surge
📊 BTC Dominance: Reaction Zone
🌊 WAVESUSDT.P: Demand Zone Potential
🟣 UNIUSDT.P: Long-Term Trade
🔵 XRPUSDT.P: Entry Zones
🔗 LINKUSDT.P: Follow The River
📈 BTCUSDT.P: Two Key Demand Zones
🟩 POLUSDT: Bullish Momentum
🌟 PENDLEUSDT.P: Where Opportunity Meets Precision
🔥 BTCUSDT.P: Liquidation of Highly Leveraged Longs
🌊 SOLUSDT.P: SOL's Dip - Your Opportunity
🐸 1000PEPEUSDT.P: Prime Bounce Zone Unlocked
🚀 ETHUSDT.P: Set to Explode - Don't Miss This Game Changer
🤖 IQUSDT: Smart Plan
⚡️ PONDUSDT: A Trade Not Taken Is Better Than a Losing One
💼 STMXUSDT: 2 Buying Areas
🐢 TURBOUSDT: Buy Zones and Buyer Presence
🌍 ICPUSDT.P: Massive Upside Potential | Check the Trade Update For Seeing Results
🟠 IDEXUSDT: Spot Buy Area | %26 Profit if You Trade with MSB
📌 USUALUSDT: Buyers Are Active + %70 Profit in Total
🌟 FORTHUSDT: Sniper Entry +%26 Reaction
🐳 QKCUSDT: Sniper Entry +%57 Reaction
📊 BTC.D: Retest of Key Area Highly Likely
📊 XNOUSDT %80 Reaction with a Simple Blue Box!
📊 BELUSDT Amazing %120 Reaction!
📊 Simple Red Box, Extraordinary Results
📊 TIAUSDT | Still No Buyers—Maintaining a Bearish Outlook
📊 OGNUSDT | One of Today’s Highest Volume Gainers – +32.44%
📊 TRXUSDT - I Do My Thing Again
📊 FLOKIUSDT - +%100 From Blue Box!
📊 SFP/USDT - Perfect Entry %80 Profit!
📊 AAVEUSDT - WE DID IT AGAIN!
I stopped adding to the list because it's kinda tiring to add 5-10 charts in every move but you can check my profile and see that it goes on..
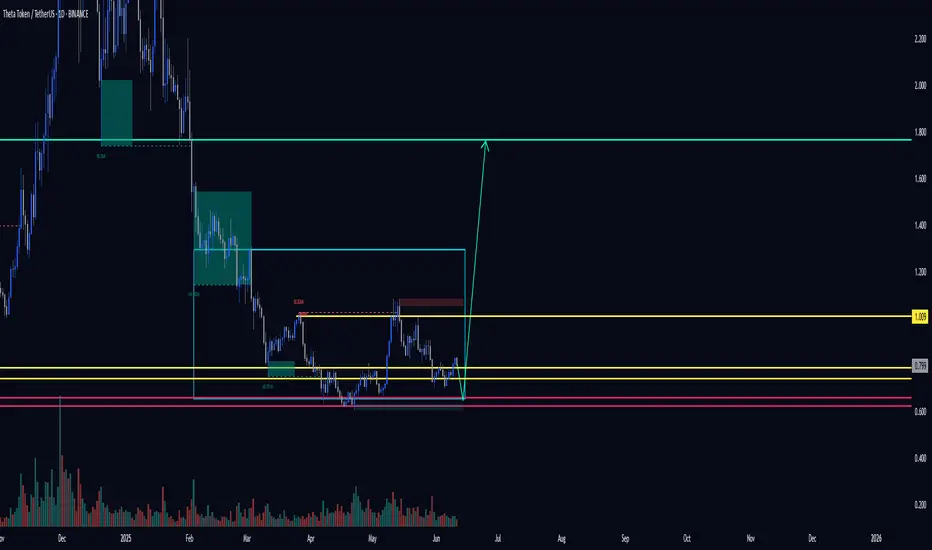
#THETA 1D. Swing High Rejected – What's Next? 06/11/25We are currently in a consolidation range. After updating the swing high, price immediately faced seller pressure from the top of the structure.
Why did this happen?
Many participants were stuck in losses for a long time and decided to exit at breakeven as soon as price gave them the chance — totally understandable.
Key levels for the setup:
Yellow lines – potential entry points.
Red lines – stop-loss levels, depending on your risk appetite (marked two options).
Green lines – target areas.
Whether you go with spot or futures — the setup is there. Choose your strategy accordingly.
DYOR.
THETAUSDT 1D Analysis THETA ~ 1D Analysis
#THETA Buy after successfully breaking this resistance line with large volume. Minimum target 10%+, Long term target $3
THETAUSDT 1W AnalysisTHETA ~ 1W Analysis
#THETA Buy gradually from here if you still have confidence in this coin with a short term target of at least 20%+ from here.
THETA - Incoming ReversalSaw a rejection on the wave 4 level. Looking to gain a 5th wave reversal here.
THETAUSDT 1D Analysis THETA ~ 1D Analysis
#THETA Buy after successfully breaking this resistance line with a short term target of at least 10%+ from here.

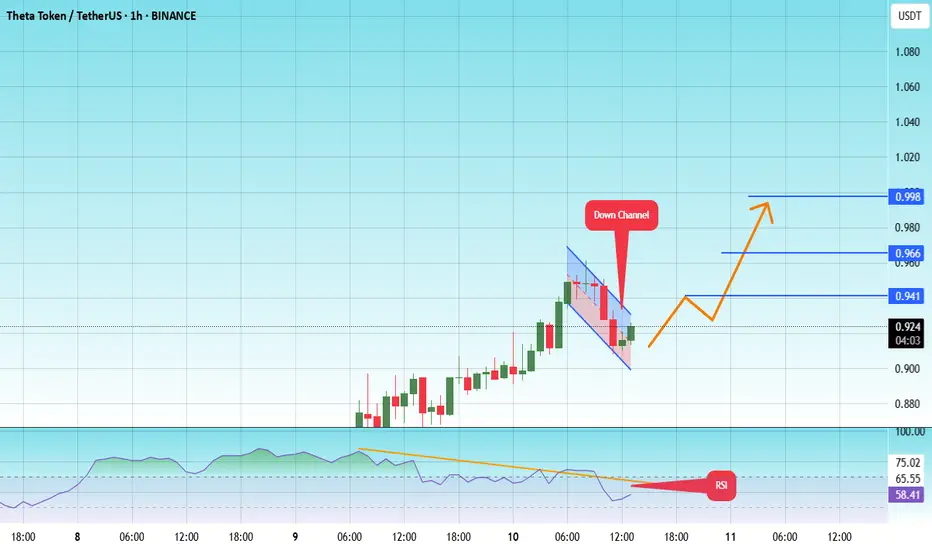
#THETA/USDT#THETA
The price is moving within a descending channel on the 1-hour frame and is expected to break and continue upward.
We have a trend to stabilize above the 100 moving average once again.
We have a downtrend on the RSI indicator that supports the upward move with a breakout.
We have a support area at the lower limit of the channel at 0.899, which acts as strong support from which the price can rebound.
Entry price: 0.903
First target: 0.941
Second target: 0.966
Third target: 0.998
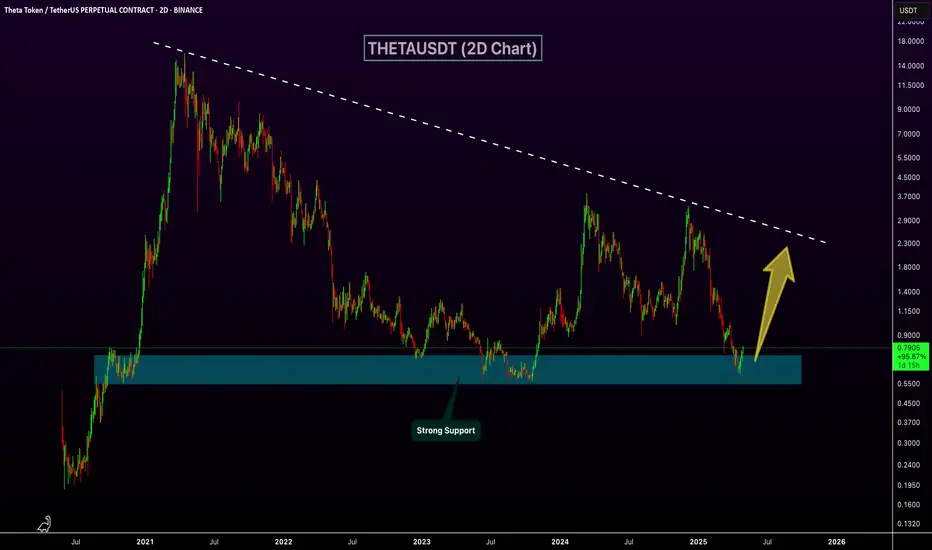
THETAUSDT Bounce from Demand ZoneTHETAUSDT has once again respected its long-term support zone, . This area has acted as a reliable demand zone multiple times in the past, leading to strong upward moves. The recent bounce from this level indicates continued buyer interest and potential for a bullish reversal.
If the current momentum sustains, we could see a move toward the $2.00–$2.50 range in the coming months. As long as THETA holds above the support zone, the bias remains bullish.
THETA at Rock Bottom? The Bounce Could Be LegendaryFor the past 136 days, THETA has been in a strong downtrend, shedding an incredible -82% from its high at $3.351. Recently, it tapped into a major support level at $0.617, interesting that it's like the golden ratio 0.618. And it bounced off it beautifully. Over the last few days, we’ve seen a notable surge in volume, hinting at potential accumulation. Could this be one of the best times to scale in? It might just be. An 82% discount is no joke.
🔑 Key Levels to Watch
The $1 level is the key psychological and technical resistance everyone’s eyeing. Longing from current levels to $1 offers a solid +40% gain, not bad at all. But let’s zoom out and get the bigger picture with some Fibonacci levels.
Using Fib retracement on the full 136-day move down:
0.236 Fib = $1.252 → Approx. +75% from current price
0.382 Fib = $1.653 → Roughly +135% gain
These are solid mid- to long-term upside targets if bullish momentum builds.
📈 Trade Setup & R:R
Invalidation: Current low at $0.600
Monthly Open: $0.804. Reclaiming and flipping this level into support would be a bullish sign.
Current Resistance: Around $0.71, where the anchored VWAP (yellow line) aligns with a yearly level. This needs to be broken and ideally retested as support.
We might also be seeing the early formation of an inverse head and shoulders pattern. While the “head” is still developing, if this setup plays out, the target sits at $1.5.
And here’s the kicker:
That $1.5 region lines up with multiple higher timeframe moving averages, adding significant weight to the level:
Monthly 21 EMA: $1.52
Monthly 21 SMA: $1.47
Weekly 21 SMA: $1.514
This confluence makes $1.47–$1.52 a major magnet for price and a likely take-profit or reaction zone if momentum continues.
👉 Feel free to use this indicator—just head over to my profile and under the Scripts section, add it to your favorites. Enjoy.
🎯 Risk to Reward Potential
These setups have excellent R:R potentials, ranging from 3:1 to over 60:1, depending on entry, stop-loss placement, and target selection. These are the kinds of high-probability setups that traders dream of. Clean structure, strong support, major upside, and clear invalidation.
If we see a breakout above $1 with strong volume, it could act as a catalyst for an even faster move toward higher Fib levels and MA targets.
Didn’t want to go too deep, but this lays out a clear roadmap with levels to monitor and possibilities to consider. The rest depends on how new data unfolds in the coming weeks. As always... plan your trade, manage your risk, and let the market come to you. Keep monitoring volume, structure, and key levels. The opportunities are here, now it's about execution.
____________________________________
If you found this helpful, leave a like and comment below! Got requests for the next technical analysis? Let me know.

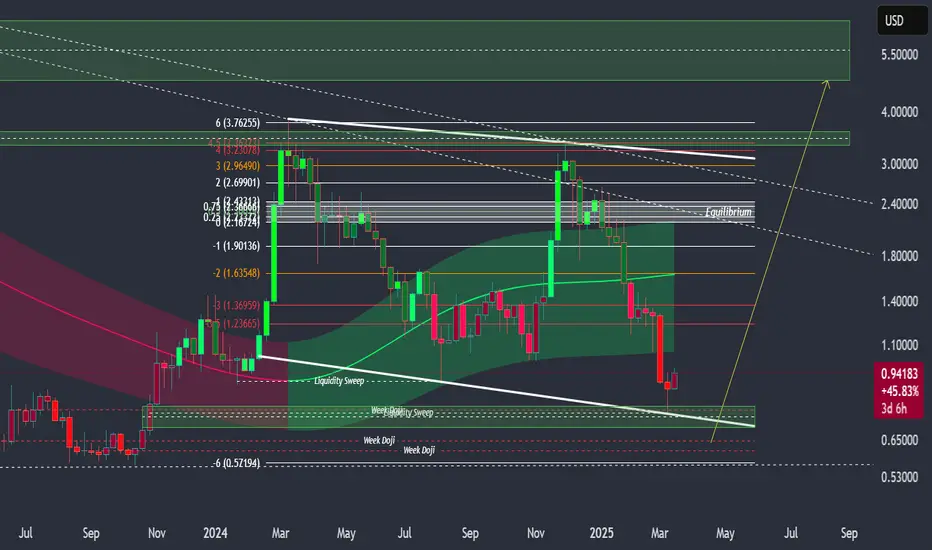
Theta Token: Your Altcoin ChoiceTheta Token has undergone a major correction, one that started in March 2024. Conditions are good for this chart based on the structure of this correction, it is reaching its end, but also a long-term higher low, really long.
THETAUSDT bottomed first in September 2023. The higher low comes in now, in April 2025. That's a year and seven months.
Easy target is a higher high compared to years of action, yielding a nice 590% potential for profits. But this would be mid-term but for the full bull market there should be more.
Super easy and short-term would be the 0.618 Fibonacci extension level around $2.31 for 216%. Both these targets are clearly mapped on the chart.
The correction higher low is now sitting within a long-term support, the buy zone. This is the space marked green on the chart. Each time THETAUSDT activates this level, a period of growth follows.
As seen in the past, once our long-term support and buy zone is activated growth doesn't necessarily start right away. Nothing happens within a single day. The pair/project can start growing producing higher highs and higher lows, but there can be a build up process that takes months. Think back of 2024. Many Altcoins bottomed in August and started to grow, but it took until November for the strong bullish jump. This time around it can be the same. Strong growth, but it takes time for bullish momentum to accumulate.
It is easy to wait with such a pair. The market can take as long as it needs because 500% profits is simply great. Imagine, or focus, or calculate based on 1-2 months of slow and steady growth, and then a strong bullish jump. Of course, there can be variations to this projection, but this is only the map, the map is not the territory.
Conclusion: Crypto is set to grow.
It doesn't matter if the next bullish wave shows up within weeks or days. The time to buy is now. Buy forever more and then just wait. Wait patiently. Books, read books and prepare. Be ready because this opportunity only presents itself every four years. We have to make the maximum of it. We have to accept what the market has to give. We have to secure profits at the right time. We have to extract some savings, pay our debts or do whatever it is we want to do once we achieve financial success.
When everything is green, do not fall sleep.
When everything is up, do not become complacent and continue to hold.
We hold now, when prices are low. When prices are high, that's the time to secure profits.
Thanks a lot for your support.
Namaste.

THETAUSD - Return to Strong Trend LineReturn to the blue trend line with a sharp bear move
I have shown this move in red, price forms a bottom along the blue line
White dotted lines show the overarching bear channel/trend
Daily chart
theta buy midterm "🌟 Welcome to Golden Candle! 🌟
We're a team of 📈 passionate traders 📉 who love sharing our 🔍 technical analysis insights 🔎 with the TradingView community. 🌎
Our goal is to provide 💡 valuable perspectives 💡 on market trends and patterns, but 🚫 please note that our analyses are not intended as buy or sell recommendations. 🚫
Instead, they reflect our own 💭 personal attitudes and thoughts. 💭
Follow along and 📚 learn 📚 from our analyses! 📊💡"

THETAUSDT 1WTHETA ~ 1W Analysis
#THETA Buy gradually from here with a short -term target of at least 20%+ from here.

The THETA chart sure has a story to tell!*"Here is a copy of my latest THETA chart, which I recently covered. There is a lot of information to be discovered simply by looking at it and drawing the proper conclusions. This will be one to watch as we move forward into the 'April flash crash' thesis I have been widely discussing.
Even if it doesn't materialize as I've theorized, there are still some interesting developments that could be coming regarding the future of this asset.
Good luck, and always use a stop loss!
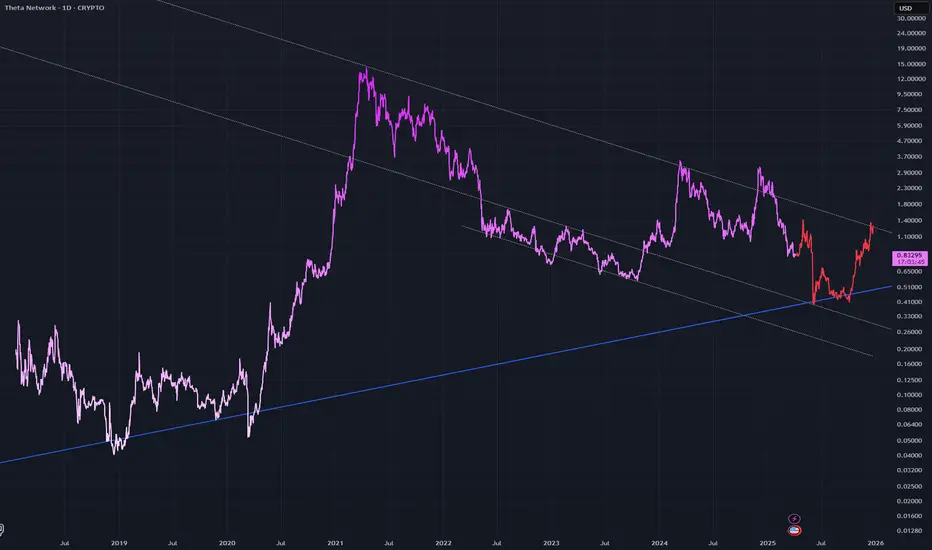
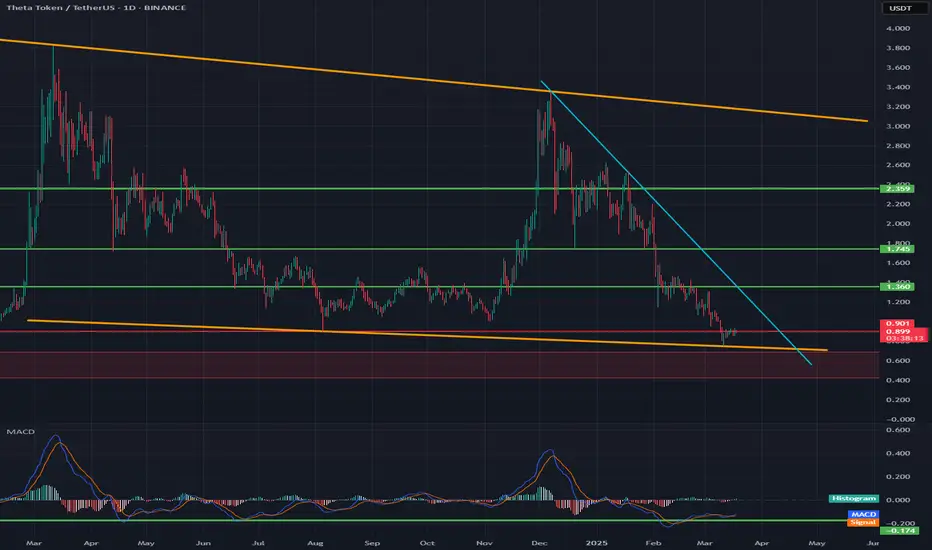
Will THETA return to an upward trend?Hello everyone, I invite you to review the current situation on Theta Token. When we enter the one-day interval, we can see how the price moved in the formed downtrend channel. What's more, we can see here the movement at the lower border of the channel and how the price maintains a strong support at the level of $ 0.90, however, if we go lower, just below the channel border, a very strong support zone for the price from $ 0.69 to $ 0.42 is visible.
We can also see how the price enters a slight sideways trend in which it can approach the downtrend line lasting inside the downtrend channel, such consolidation and gathering of energy can have a positive impact on the movement in the coming weeks, which can lead to growth. When such a scenario works, we can see a nice upward movement around $ 1.36, another significant resistance can be seen at $ 1.75, and then we have strong resistance around $ 2.36.
It is worth paying attention to the MACD indicator here, which shows how we are staying in the lower range and the ongoing movement is visible here, which may also indicate a potential attempt to rebound the price.
THETAUSD - Bullish PhaseTHETA is a good project with nice partners.
Tokenomics are great.
There are few chances that the project would reach again same ATH as last cycle but still it s ~ 7x
This is not a trading advice.
Thanks
St.Gex
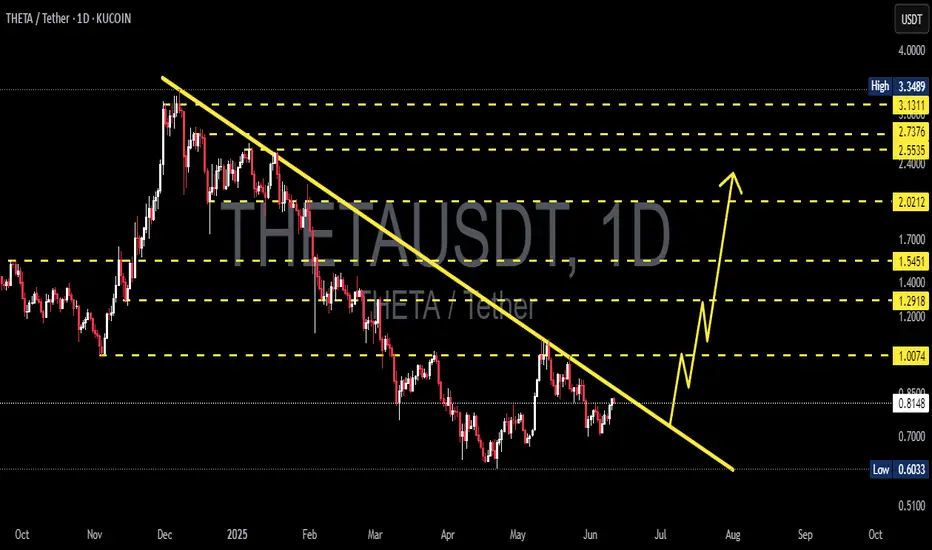
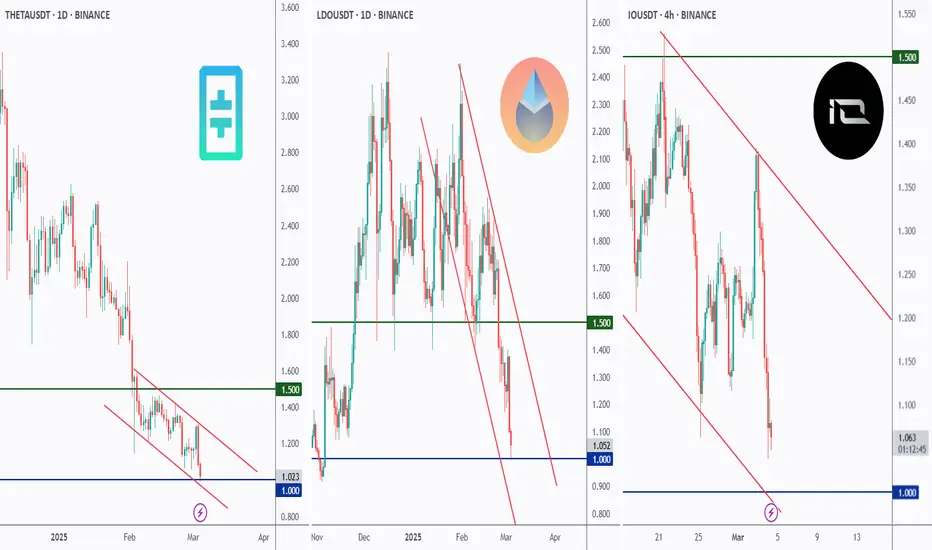
3 Altcoins Retesting the $1 Round Number!BINANCE:THETAUSDT
THETA has been overall bearish and it is currently approaching the lower bound of its red channel which intersects perfectly with the $1 round number.
BINANCE:LDOUSDT
LDO has been overall bearish and it is currently approaching the lower bound of its red channel which intersects perfectly with the $1 round number.
BINANCE:IOUSDT
IO has been overall bearish and it is currently approaching the lower bound of its red channel which intersects perfectly with the $1 round number.
Which altcoins would you like me to cover next?
All Strategies Are Good; If Managed Properly!
~Rich
theta sell midterm "🌟 Welcome to Golden Candle! 🌟
We're a team of 📈 passionate traders 📉 who love sharing our 🔍 technical analysis insights 🔎 with the TradingView community. 🌎
Our goal is to provide 💡 valuable perspectives 💡 on market trends and patterns, but 🚫 please note that our analyses are not intended as buy or sell recommendations. 🚫
Instead, they reflect our own 💭 personal attitudes and thoughts. 💭
Follow along and 📚 learn 📚 from our analyses! 📊💡"
