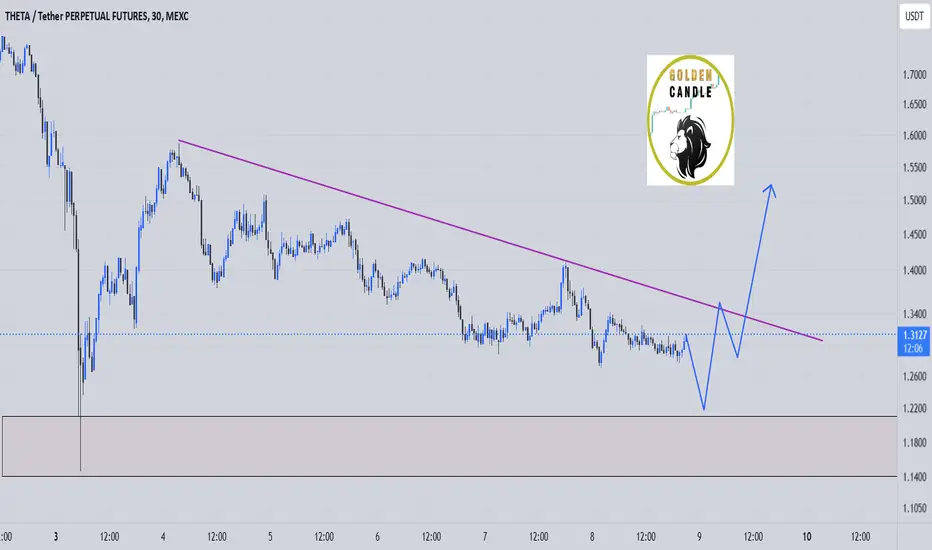
theta midterm buy "🌟 Welcome to Golden Candle! 🌟
We're a team of 📈 passionate traders 📉 who love sharing our 🔍 technical analysis insights 🔎 with the TradingView community. 🌎
Our goal is to provide 💡 valuable perspectives 💡 on market trends and patterns, but 🚫 please note that our analyses are not intended as buy or sell recommendations. 🚫
Instead, they reflect our own 💭 personal attitudes and thoughts. 💭
Follow along and 📚 learn 📚 from our analyses! 📊💡"
Theta
THETA Token Perspective and Potential Gains - Cup & HandleTheta token seems to be creating a bottoming pattern , compressed into a Cup & Handle shape . I’m looking for a breakout above the $3.7 resistance level to confirm this bullish setup.
Currently, Theta is trading around $2.0 , which acts as a temporary support zone . However, it’s important to stay cautious — if the price drops below $1.5 , it could lead to a structure failure , invalidating this perspective.
Key Levels to Watch:
Cup & Handle Breakout Level: $3.7
Targets: $5 - $7 - $8 - $10
Let’s see how this plays out — breakouts from these patterns often gives great opportunities.

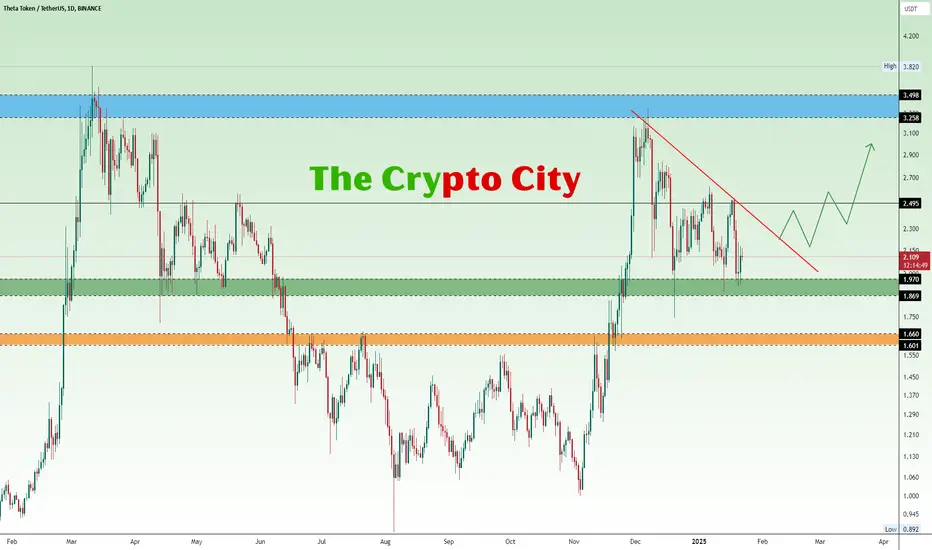
THETA Poised for a Major BreakoutTHETA is currently resting on a critical support zone (Green) at $1.869–$1.970, a level that has previously sparked significant bullish momentum. However, the price remains constrained by a descending trendline that has acted as stubborn resistance for weeks. The next move will be crucial in determining whether THETA continues its downtrend or reverses into a bullish rally.
If the Green support holds and the price breaks above the descending trendline, an upside move toward the $2.495 resistance level is likely. A break above this level could set the stage for a rally to the Blue resistance zone at $3.258–$3.498, especially if accompanied by strong volume and momentum.
On the downside, if the Green support fails, THETA could drop toward the Yellow support zone at $1.601–$1.660, where a pool of liquidity might trigger a bullish rebound.
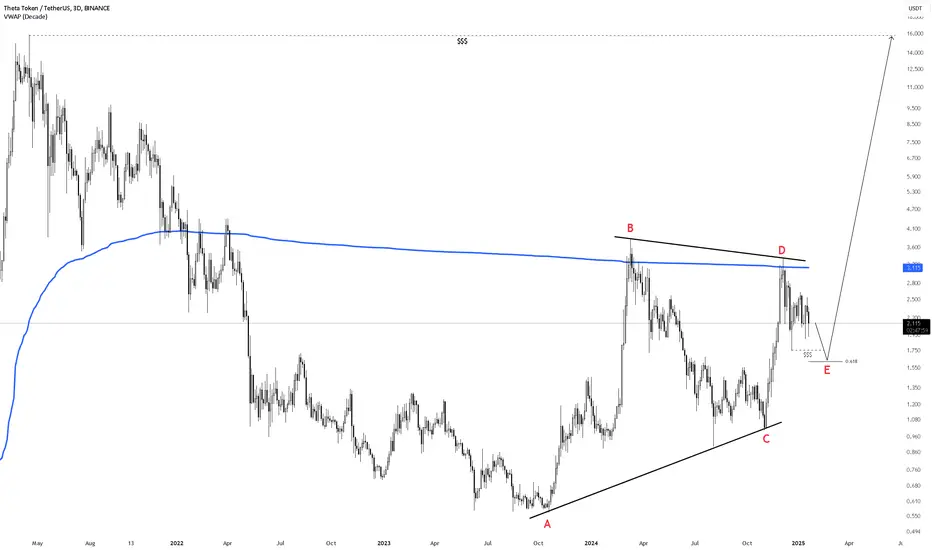
THETA long term analysis updatei made an analysis on this coin weeks ago the main pattern is not changed these is a selling pressure on this coin when it touches the VWAP indicator but it made a perfect pattern for rising we have to wait for the last drop and after that the market will insanely rise !
theta long sell limit"🌟 Welcome to Golden Candle! 🌟
We're a team of 📈 passionate traders 📉 who love sharing our 🔍 technical analysis insights 🔎 with the TradingView community. 🌎
Our goal is to provide 💡 valuable perspectives 💡 on market trends and patterns, but 🚫 please note that our analyses are not intended as buy or sell recommendations. 🚫
Instead, they reflect our own 💭 personal attitudes and thoughts. 💭
Follow along and 📚 learn 📚 from our analyses! 📊💡"
Massive Volume Spike This Blue Box Could Be the Game Changer!THETAUSDT: Massive Volume Spike—This Blue Box Could Be the Game Changer! 🚀
Ladies and gentlemen, we’re looking at a 229% daily volume spike . That’s big, really big. When you see numbers like this, you know there’s something brewing under the surface. The question is, are you ready to act?
Here’s the plan for THETAUSDT:
Blue Box Buy Zone: This is where the magic happens. It’s carefully identified as the area where buyers could step in aggressively.
Volume Surge Means Opportunity: A volume increase of this size doesn’t happen by accident. It’s a sign that the big players are getting involved, and we’re here to ride their wave.
Lower Timeframe Confirmation: I’ll wait for bullish market structure breaks on the 1H chart before entering. Tools like CDV, volume profile, and liquidity heatmaps will guide the final decision.
This is not just a trade—it’s a statement. The market doesn’t hand out opportunities like this every day. Take action, be decisive, and don’t let this slip by. Boost, comment, follow—and let’s crush it! 💥
Let me tell you, this is something special. These insights, these setups—they’re not just good; they’re game-changers. I've spent years refining my approach, and the results speak for themselves. People are always asking, "How do you spot these opportunities?" It’s simple: experience, clarity, and a focus on high-probability moves.
Want to know how I use heatmaps, cumulative volume delta, and volume footprint techniques to find demand zones with precision? I’m happy to share—just send me a message. No cost, no catch. I believe in helping people make smarter decisions.
Here are some of my recent analyses. Each one highlights key opportunities:
🚀 RENDERUSDT: Strategic Support Zones at the Blue Boxes +%45 Reaction
🎯 PUNDIXUSDT: Huge Opportunity | 250% Volume Spike - %60 Reaction Sniper Entry
🌐 CryptoMarkets TOTAL2: Support Zone
🚀 GMTUSDT: %35 FAST REJECTION FROM THE RED BOX
🎯 ZENUSDT.P: Patience & Profitability | %230 Reaction from the Sniper Entry
🐶 DOGEUSDT.P: Next Move
🎨 RENDERUSDT.P: Opportunity of the Month
💎 ETHUSDT.P: Where to Retrace
🟢 BNBUSDT.P: Potential Surge
📊 BTC Dominance: Reaction Zone
🌊 WAVESUSDT.P: Demand Zone Potential
🟣 UNIUSDT.P: Long-Term Trade
🔵 XRPUSDT.P: Entry Zones
🔗 LINKUSDT.P: Follow The River
📈 BTCUSDT.P: Two Key Demand Zones
🟩 POLUSDT: Bullish Momentum
🌟 PENDLEUSDT.P: Where Opportunity Meets Precision
🔥 BTCUSDT.P: Liquidation of Highly Leveraged Longs
🌊 SOLUSDT.P: SOL's Dip - Your Opportunity
🐸 1000PEPEUSDT.P: Prime Bounce Zone Unlocked
🚀 ETHUSDT.P: Set to Explode - Don't Miss This Game Changer
🤖 IQUSDT: Smart Plan
⚡️ PONDUSDT: A Trade Not Taken Is Better Than a Losing One
💼 STMXUSDT: 2 Buying Areas
🐢 TURBOUSDT: Buy Zones and Buyer Presence
🌍 ICPUSDT.P: Massive Upside Potential | Check the Trade Update For Seeing Results
🟠 IDEXUSDT: Spot Buy Area | %26 Profit if You Trade with MSB
📌 USUALUSDT: Buyers Are Active + %70 Profit in Total
🌟 FORTHUSDT: Sniper Entry +%26 Reaction
🐳 QKCUSDT: Sniper Entry +%57 Reaction
📊 BTC.D: Retest of Key Area Highly Likely
This list? It’s just a small piece of what I’ve been working on. There’s so much more. Go check my profile, see the results for yourself. My goal is simple: provide value and help you win. If you’ve got questions, I’ve got answers. Let’s get to work!
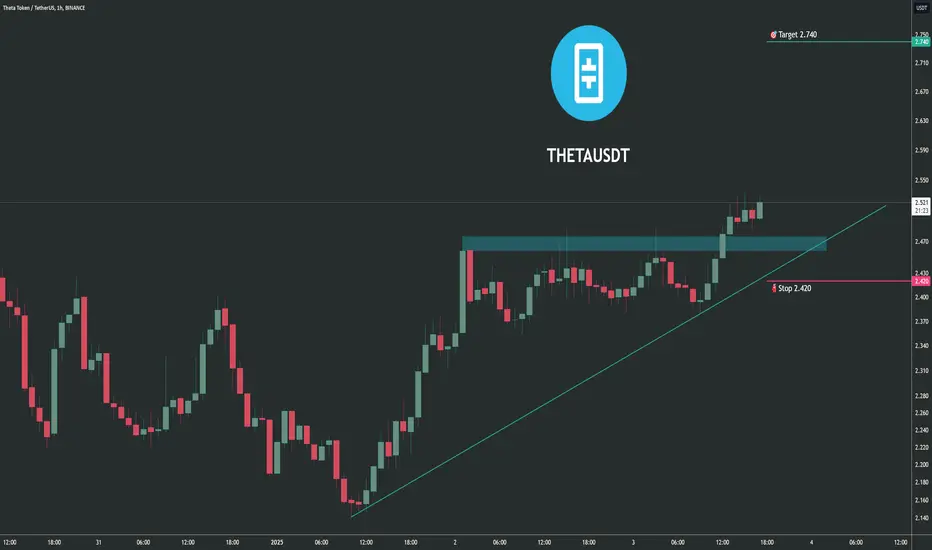
Trading opportunity for THETAUSDTBased on technical factors there is a Buy position in :
📊 THETAUSDT
🔵 Buy Now
🪫Stop loss 2.420
🔋Target 2.740
📏 R/R 2,2
💸RISK : 1%
We hope it is profitable for you ❤️
Please support our activity with your likes👍 and comments📝
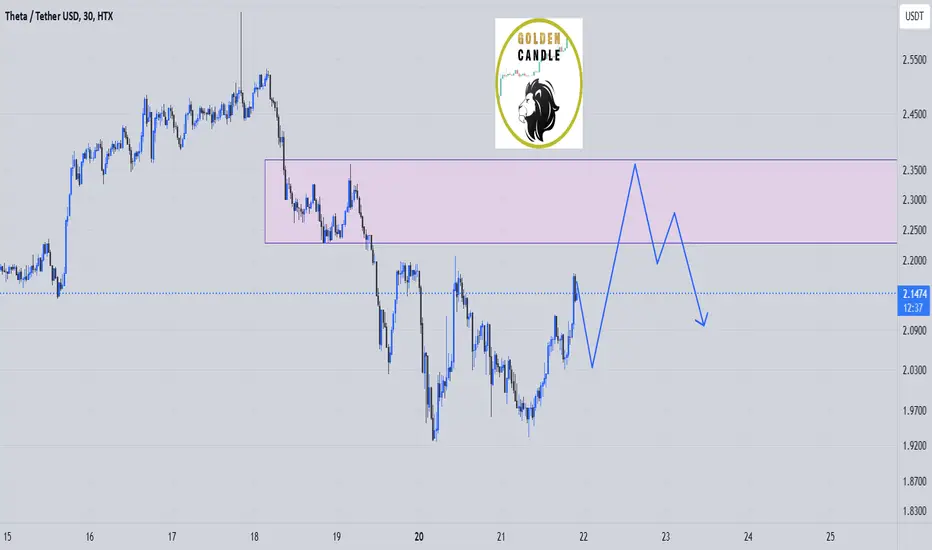
theta usdt Update"🌟 Welcome to Golden Candle! 🌟
We're a team of 📈 passionate traders 📉 who love sharing our 🔍 technical analysis insights 🔎 with the TradingView community. 🌎
Our goal is to provide 💡 valuable perspectives 💡 on market trends and patterns, but 🚫 please note that our analyses are not intended as buy or sell recommendations. 🚫
Instead, they reflect our own 💭 personal attitudes and thoughts. 💭
Follow along and 📚 learn 📚 from our analyses! 📊💡"

THETA - A Nice Pattern for a quick tradeBINANCE:THETAUSDT (1D CHART) Technical Analysis Update
THETA is currently trading at $2.33 and showing overall bearish sentiment
Price got rejected from the resistance within the channel and expected to crash further. There is a good short trade opportunity here.
Entry level: $ 2.33
Stop Loss Level: $ 2.58
TakeProfit 1: $ 2.1
TakeProfit 2: $ 2.0
TakeProfit 3: $ 1.9
TakeProfit 4: $ 1.78
Max Leverage: 5x
Position Size: 1% of capital
Remember to set your stop loss.
Follow our TradingView account for more technical analysis updates. | Like, share, and comment your thoughts.
Cheers
GreenCrypto

Breakout Watch: THETA Targets 30% RallyCurrently, THETA token is trading near the falling trendline resistance, and we anticipate a potential breakout above this level.
If the breakout occurs, the price could rally by over 30% from current levels. Additionally, the $2.00-$1.90 zone serves as a strong key support, providing a solid base for further upward momentum.
Keep an eye on this setup for confirmation!
DYOR, NFA

theta long midterm"🌟 Welcome to Golden Candle! 🌟
We're a team of 📈 passionate traders 📉 who love sharing our 🔍 technical analysis insights 🔎 with the TradingView community. 🌎
Our goal is to provide 💡 valuable perspectives 💡 on market trends and patterns, but 🚫 please note that our analyses are not intended as buy or sell recommendations. 🚫
Instead, they reflect our own 💭 personal attitudes and thoughts. 💭
Follow along and 📚 learn 📚 from our analyses! 📊💡"

theta midterm sell"🌟 Welcome to Golden Candle! 🌟
We're a team of 📈 passionate traders 📉 who love sharing our 🔍 technical analysis insights 🔎 with the TradingView community. 🌎
Our goal is to provide 💡 valuable perspectives 💡 on market trends and patterns, but 🚫 please note that our analyses are not intended as buy or sell recommendations. 🚫
Instead, they reflect our own 💭 personal attitudes and thoughts. 💭
Follow along and 📚 learn 📚 from our analyses! 📊💡"

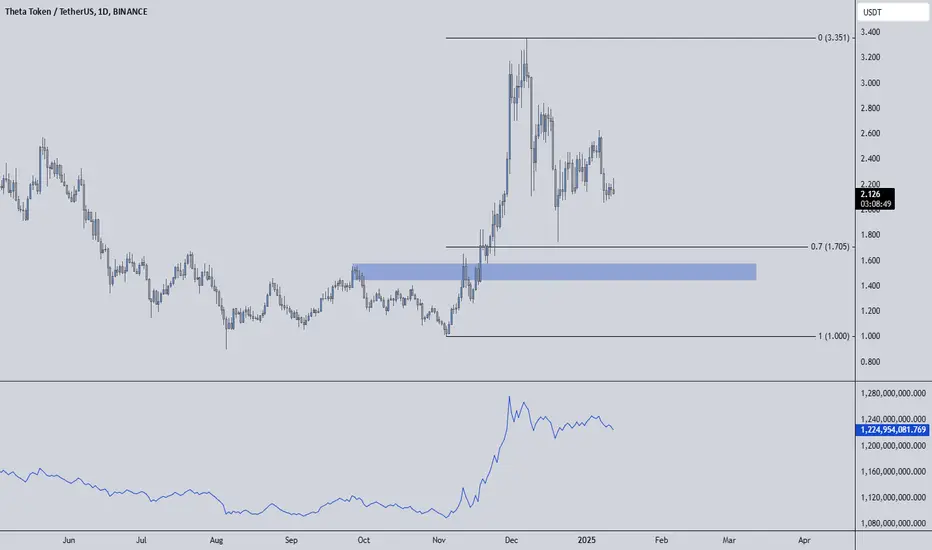
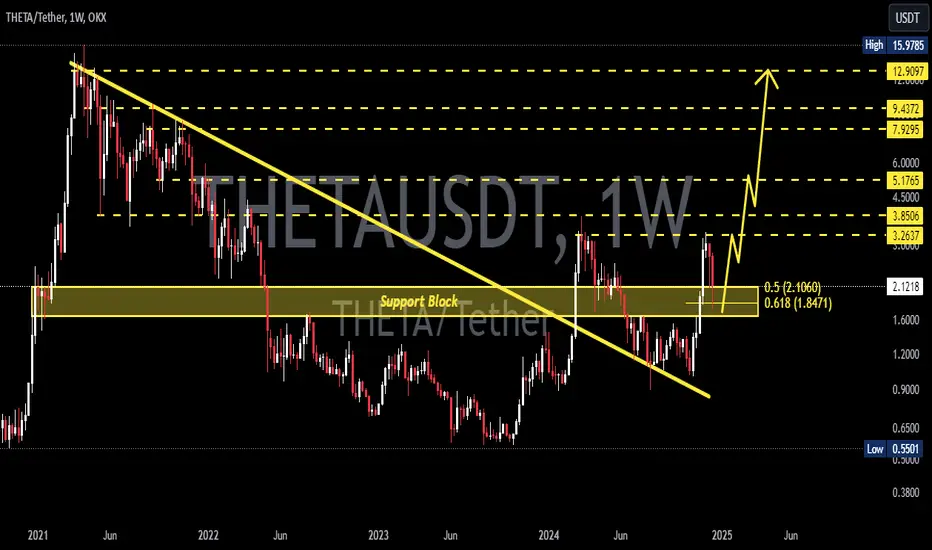
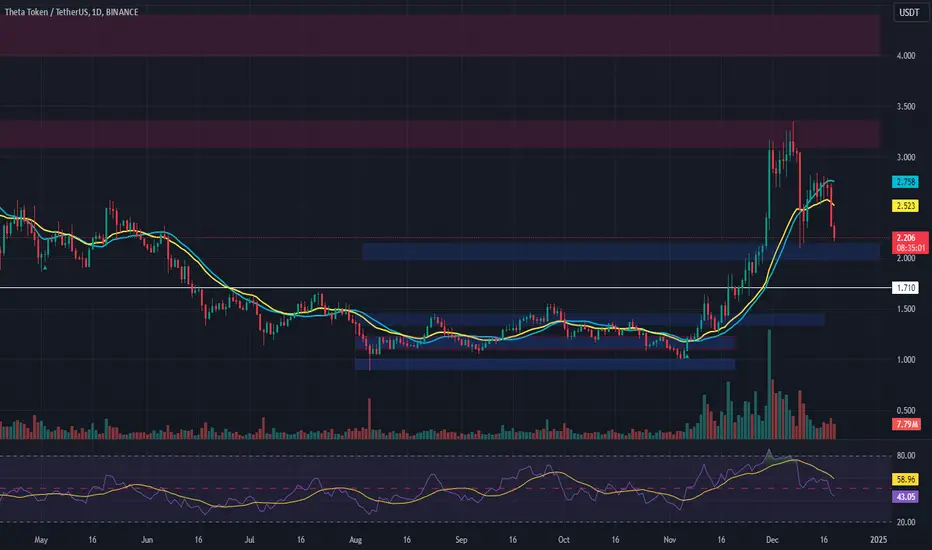
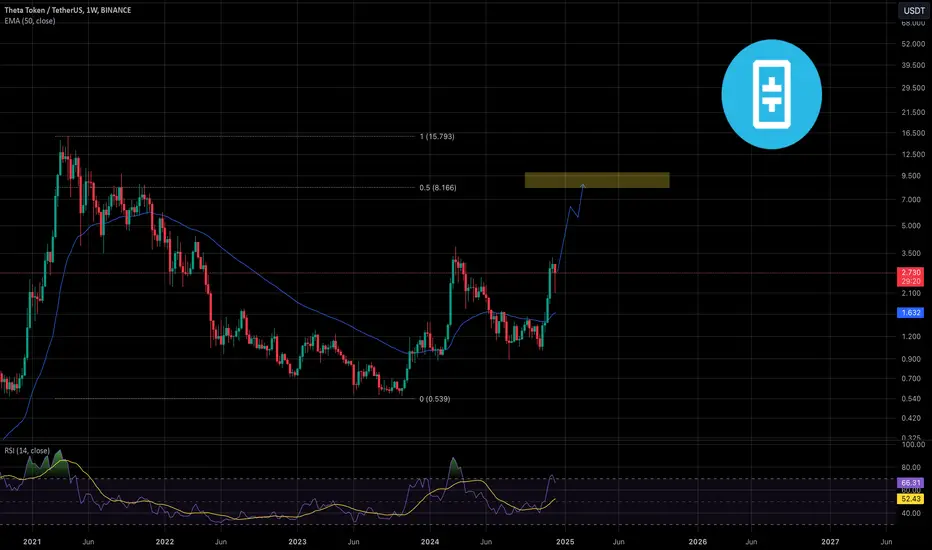
THETAUSDT 1WTHETA Update ~ 1W
#THETA still in a strong bullish trend. If you still have Conviction on this coin,. Buy gradually within this support block,. with a minimum target of 20%++
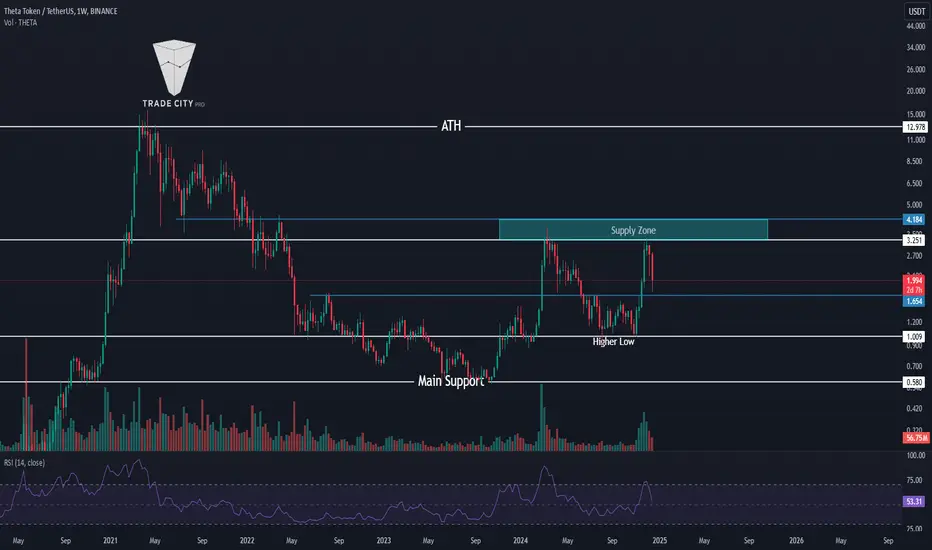
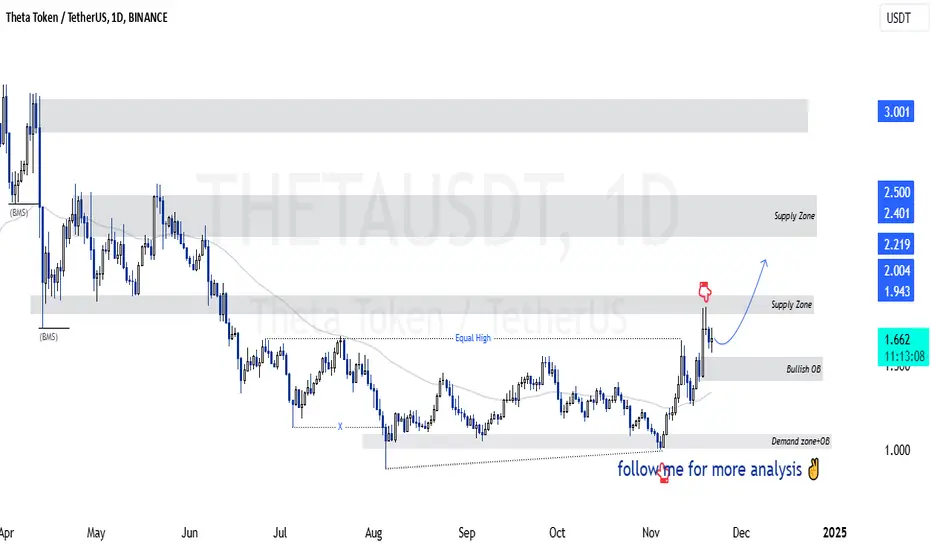
TradeCityPro | Theta : Navigating Deep Corrections👋 Welcome to TradeCityPro!
In this analysis, I will examine Theta in both the weekly and daily timeframes, providing a detailed breakdown of its market dynamics and critical levels.
📅 Weekly Timeframe: Price Reaches Supply Zone Again
In the weekly timeframe, after forming a bottom structure around the $0.58 level, Theta initiated its first bullish wave, reaching the supply zone between $3.251 and $4.184 for the first time in this uptrend cycle.
🔍 Following the initial test of this resistance, the price corrected and established a higher low at $1.009, reinforcing its support. With the breakout above $1.654, the next bullish wave towards the supply zone began.
🚀 Currently, the price has been rejected from this supply zone with significant selling volume and has pulled back to $1.654. Sustained bullish momentum, characterized by sharp upward movements and dominant green candles, will require a breakout and consolidation above the supply zone.
✅ Upon clearing this resistance, Theta could rally towards the ATH at $12.978, with potential for further targets and a new ATH if $12.978 is surpassed.
🔽 A break below RSI 50 may lead to continued corrections, potentially revisiting $1.009. Despite this, as long as the price holds above $1.009, the market outlook remains bullish. Confirmation of a trend reversal would occur with a breakdown of this level, targeting the key $0.58 support, which remains a critical demand zone.
📈 RSI support at 50 and renewed buying volume could propel the price back towards the supply zone with stronger momentum.
📅 Daily Timeframe: Deep Correction in Progress
On the daily chart, the most recent bullish wave is visible in greater detail. Applying a Fibonacci Retracement, the price initially corrected to the 0.382 level, followed by a deeper correction after breaking the $2.257 low, extending to the 0.618 Fibonacci level.
📉 If the correction continues, the final retracement level, 0.786 Fibonacci, aligns with the $1.628 support, forming a Potential Reversal Zone (PRZ). A failure to hold $1.628 could see the price drop to $1.009, as noted in the weekly analysis.
Currently, bearish volume is increasing, signaling potential challenges for a bullish recovery in the short term.
🔼 A bullish breakout would require strong buying volume, but opening long positions near the supply zone carries significant risk. Instead, consider entering positions at lower levels where price action provides a clear trigger to reduce stress as the price approaches the supply zone.
📝 Final Thoughts
This analysis reflects our opinions and is not financial advice.
Share your thoughts in the comments, and don’t forget to share this analysis with your friends! ❤️ above.
THETA Long OpportunityMarket Context:
Several altcoins, including THETA, have retraced to their horizontal support levels, presenting a prime opportunity for a long position with favorable risk-to-reward.
Trade Details:
Entry Zone: Between $1.99 – $2.14
Take Profit Targets:
$3.10 – $3.35
$4.00 – $4.40
Stop Loss: Just below $1.70
This setup leverages THETA’s strong support level, providing clear upside potential while managing risk effectively. 📈
theta sell midterm"🌟 Welcome to Golden Candle! 🌟
We're a team of 📈 passionate traders 📉 who love sharing our 🔍 technical analysis insights 🔎 with the TradingView community. 🌎
Our goal is to provide 💡 valuable perspectives 💡 on market trends and patterns, but 🚫 please note that our analyses are not intended as buy or sell recommendations. 🚫
Instead, they reflect our own 💭 personal attitudes and thoughts. 💭
Follow along and 📚 learn 📚 from our analyses! 📊💡"

$THETA On MidtermTHETA on weekly on top and had to correction
you can buy at bullish trendline
notice that we have in weekly time frame and take time to get near the trendlne
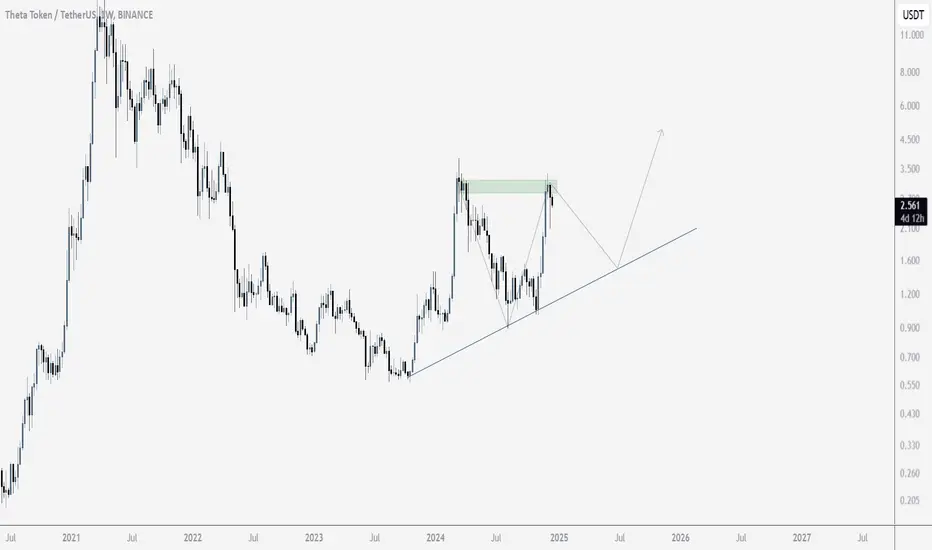
THETA is on its way to being a Tier-2 projectTheta is a rather large project in terms of capitalization and it is quite difficult to move its price. From the chart point of view everything looks bullish and is about to shoot. You could also draw a cup with a pen here, but I didn't want to clutter the chart. Fairly good buyback reaction this week, the RSI is in the overbought zone and I think the asset's potential is not as high as a number of altcoins. This is not a bad option for investors who take a conservative approach to the market and for traders who like to trade with high leverage.
Horban Brothers.
THETAUSDT- Continuation PennantBINANCE:THETAUSDT - Interesting chart pattern. Seems a continuation pennant to me. Also volume supports this cause and is seemingly in a good demand zone. All the best.

SasanSeifi| Can It Hit $2.50!? Hey there,By analyzing the daily chart of BINANCE:THETAUSDT , we can see that the price has made a significant move up from its low towards the supply zone. Currently, the price is reacting to the supply zone and we are witnessing a pullback. Based on the overall market conditions, my view remains bullish.
My Expectation:If the price holds the support level at $1.50, it could potentially rise to targets of $2.00, $2.20, and the supply zone around $2.50. If the price continues to rise, we need to observe its reactions to better understand the continuation of the trend. The key support level is $1.50.
💡 Keep in mind, this is just my personal perspective and shouldn't be considered as financial advice. I’d love to hear your thoughts and engage in a discussion!
Happy trading!✌😎
Feel free to reach out if you have any questions or need more clarification. I'm always here to assist!✌
If you want any further adjustments, just let me know!
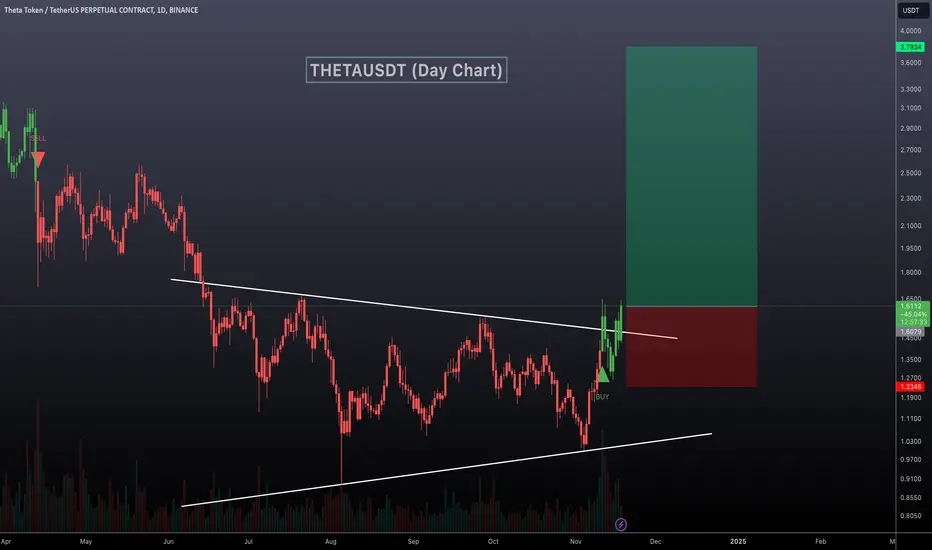
THETAUSDT Trend Reversal Confirmed !THETAUSDT TEchnical analysis update
BINANCE:THETAUSDT 's price broke out of a triangle pattern on the daily chart after 150 days of consolidation, accompanied by high volume. The price is now trading above the 100 and 200 EMAs, confirming a trend reversal. This breakout signals potential for further upward momentum, as buyers regain control.
Buy level: $1.60
Stop Loss:$1.25
THETA looking for 2 to 4 X in Short to MId TermWith BTC getting ready to tap 100k alts are looking primed for movement. Theta is no exception lining up for a breakout that could be a 2 to 4 x in the short term before potential price discovery starts. EMAs and momentum looking solid here. Math says up as of now

#THETA/USDT#THETA
The price is moving in a descending channel on the 4-hour frame and is sticking to it very well and is expected to break it upwards and it has already been broken
We have a bounce from a major support area in green at 0.1550
We have a downtrend on the RSI indicator that has been broken upwards which supports the rise
We have a trend to stabilize above the 100 moving average which supports the rise
Entry price 1.20
First target 1.36
Second target 1.50
Third target 1.66
