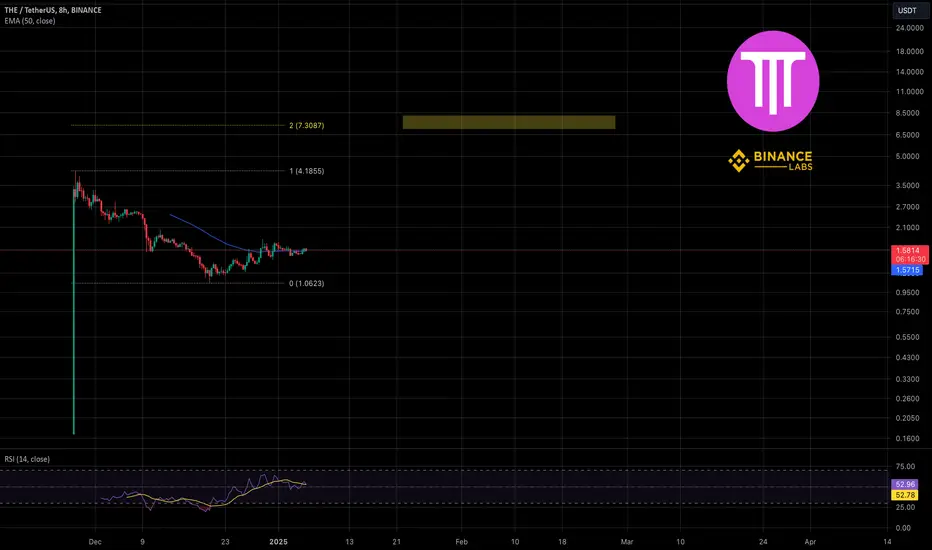
THEUSDT Analysis: Weak Buyers and Downside ConfirmationOn THEUSDT, my current observation is clear: buyers are extremely weak. This isn't just a hunch; the underlying order flow and volume dynamics point to a lack of conviction from the bullish side.
Because of this noticeable weakness, my focus will be squarely on the red box I've identified on the chart. This area is where I'll be actively seeking downward confirmations on lower timeframes. This means I'm looking for signs like:
Failed attempts to rally: Price pushing up into the red box but quickly getting rejected.
Increased selling volume: A spike in volume on bearish candles as price interacts with or breaks below this zone, especially on the volume footprint.
CDV (Cumulative Delta Volume) turning decisively negative: This would signal that sellers are genuinely taking control.
Low Timeframe (LTF) breakdowns: Clear bearish structures forming, like lower highs and lower lows, coupled with retests of broken support as new resistance.
Remember, my strategy dictates that I only analyze and consider trades on coins showing a sudden and significant increase in volume. While THEUSDT's current context may not be about a sudden bullish volume spike, the analysis of existing volume and order flow within this weakness is crucial.
The market rewards patience and confirmation. I will not be looking for long opportunities here. My attention is entirely focused on finding those bearish confirmations within the red box. If they materialize, it presents a clear directional bias for a downside move.
📌I keep my charts clean and simple because I believe clarity leads to better decisions.
📌My approach is built on years of experience and a solid track record. I don’t claim to know it all but I’m confident in my ability to spot high-probability setups.
📌If you would like to learn how to use the heatmap, cumulative volume delta and volume footprint techniques that I use below to determine very accurate demand regions, you can send me a private message. I help anyone who wants it completely free of charge.
🔑I have a long list of my proven technique below:
🎯 ZENUSDT.P: Patience & Profitability | %230 Reaction from the Sniper Entry
🐶 DOGEUSDT.P: Next Move
🎨 RENDERUSDT.P: Opportunity of the Month
💎 ETHUSDT.P: Where to Retrace
🟢 BNBUSDT.P: Potential Surge
📊 BTC Dominance: Reaction Zone
🌊 WAVESUSDT.P: Demand Zone Potential
🟣 UNIUSDT.P: Long-Term Trade
🔵 XRPUSDT.P: Entry Zones
🔗 LINKUSDT.P: Follow The River
📈 BTCUSDT.P: Two Key Demand Zones
🟩 POLUSDT: Bullish Momentum
🌟 PENDLEUSDT.P: Where Opportunity Meets Precision
🔥 BTCUSDT.P: Liquidation of Highly Leveraged Longs
🌊 SOLUSDT.P: SOL's Dip - Your Opportunity
🐸 1000PEPEUSDT.P: Prime Bounce Zone Unlocked
🚀 ETHUSDT.P: Set to Explode - Don't Miss This Game Changer
🤖 IQUSDT: Smart Plan
⚡️ PONDUSDT: A Trade Not Taken Is Better Than a Losing One
💼 STMXUSDT: 2 Buying Areas
🐢 TURBOUSDT: Buy Zones and Buyer Presence
🌍 ICPUSDT.P: Massive Upside Potential | Check the Trade Update For Seeing Results
🟠 IDEXUSDT: Spot Buy Area | %26 Profit if You Trade with MSB
📌 USUALUSDT: Buyers Are Active + %70 Profit in Total
🌟 FORTHUSDT: Sniper Entry +%26 Reaction
🐳 QKCUSDT: Sniper Entry +%57 Reaction
📊 BTC.D: Retest of Key Area Highly Likely
📊 XNOUSDT %80 Reaction with a Simple Blue Box!
📊 BELUSDT Amazing %120 Reaction!
📊 Simple Red Box, Extraordinary Results
📊 TIAUSDT | Still No Buyers—Maintaining a Bearish Outlook
📊 OGNUSDT | One of Today’s Highest Volume Gainers – +32.44%
📊 TRXUSDT - I Do My Thing Again
📊 FLOKIUSDT - +%100 From Blue Box!
📊 SFP/USDT - Perfect Entry %80 Profit!
📊 AAVEUSDT - WE DID IT AGAIN!
I stopped adding to the list because it's kinda tiring to add 5-10 charts in every move but you can check my profile and see that it goes on..
THEUSD
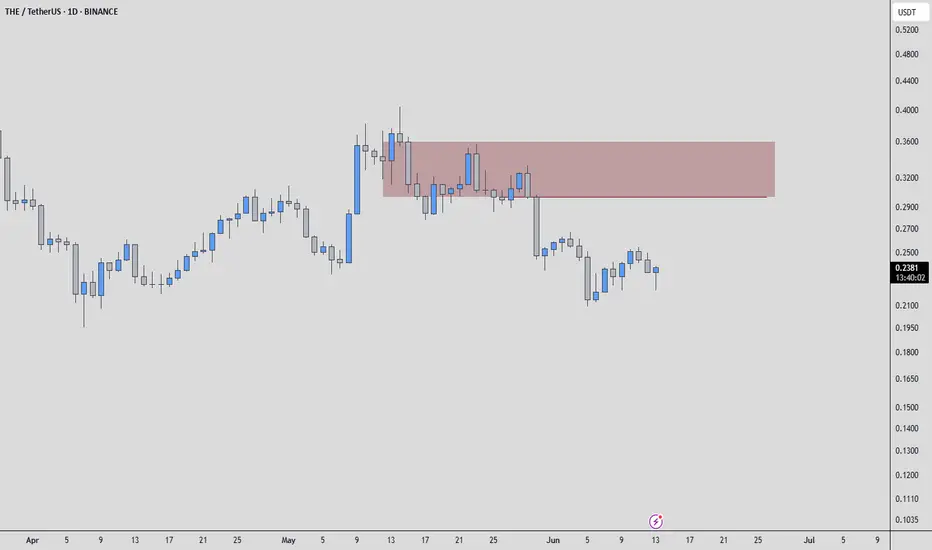
THEUSDT 1D AnalysisTHE ~ 1D Analysis
#THE This trade is very high risk
Buy from here if you still have confidence in this coin with a short term target of at least 15%+ from here.

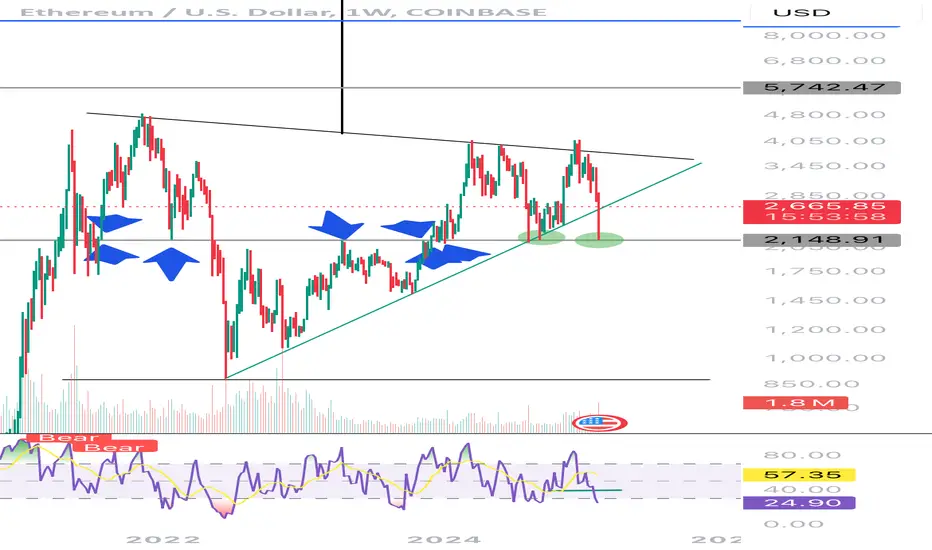
ETH—Time Has become CrucialETH has had 2 weekly closes below 3000
This is not too surprising nor should it be an end all be all indicator, that determines whether the bull run in BTC, Alts, or both, is coming to a halt or resuming
With that being said, time appears to be getting important, as 3 weekly closes should certainly be concerning.
Here we can see an intact trendline from multi-year lows all the way to more recent lows, until it just recently retested.
Additionally, most volatile, and aggressive moves from from a flase breakdown, which washes out week hands one last time.
-After hitting strong support at 2150, and dropping nearly 30% in hours, ETH QUICKLY recovered the entirety of its loses within a day.
-2150 has several levels of strong support and a further array of support/former resistance levels with 25-50$
-Time is important here—I expect for ETH to make a beeline to 3000 early next week and definitively close above 3000 on the weekly chart, signaling the resumption of the altcoin bull market in earnest.
-If this does not happen, I would say there is a cause for concern, and something is very wrong.
It is also important to note the Bollinger Band crash on the weekly chart when 2150 was tested. The last time this exact scenario occurred, ETH rallied back well above 3000 in a short period of time.
Comments appreciated thanks
New Thena project from Binance!Thena reminds me of Lista, which was also made for pumping Binance bags. So far it's only 130 million capitalization, but knowing Binance, it will easily grow into 1 billion! I expect a Thena partnership with one of the market makers soon. So far, I haven't detected any MM presence... TVL is also good, I would expect a price around 7$ per coin, this just correlates with the thought of 1 billion, and also technically fits well with the chart technicals.
Horban Brothers.