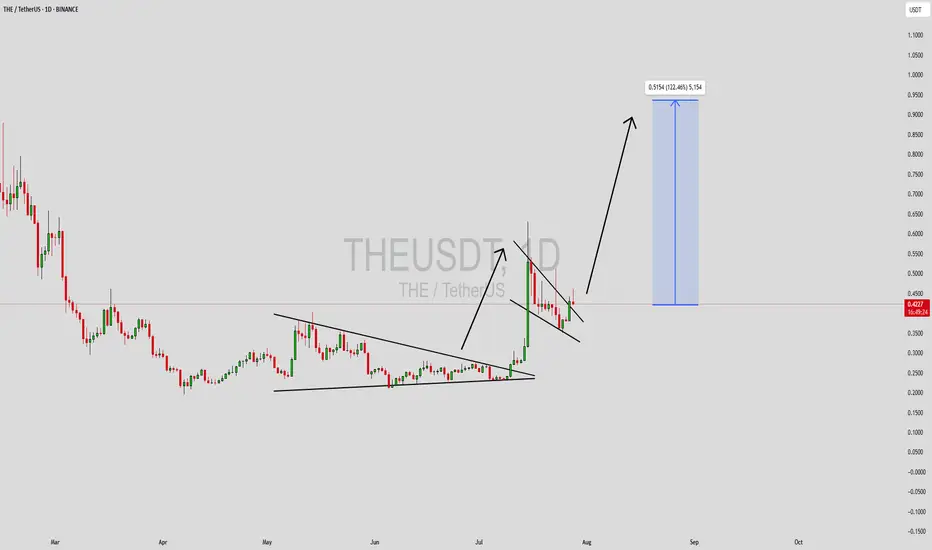
THEUSDT Forming Bullish PennantTHEUSDT is showing a highly promising structure, currently consolidating within a classic bullish pennant pattern. This type of formation typically follows a strong upward impulse, where price enters a phase of tight consolidation before potentially continuing its move higher. With strong volume observed throughout the recent price action and a well-defined pennant forming, the setup is aligning for a high-probability breakout to the upside.
Technical traders are paying close attention to this chart due to the textbook nature of the pattern and the potential for an explosive move. Bullish pennants are continuation patterns, and when combined with increasing volume and market interest, they often lead to powerful rallies. With the current market momentum and rising interest from investors, a breakout from this consolidation zone could trigger a 90% to 100% surge in the coming sessions.
Fundamentally, THE token has been attracting attention from both retail and institutional participants, thanks to its unique position in the Web3 and AI ecosystem. This renewed focus is not just technical but also driven by growing community engagement and strategic developments that hint at long-term sustainability. Investors looking for altcoins with strong upside potential are beginning to position early.
With the breakout point approaching, THEUSDT could soon confirm its bullish bias. Keep an eye on volume spikes and clean breaks above resistance lines to validate the move. If confirmed, this could be one of the top-performing setups in the current market cycle.
✅ Show your support by hitting the like button and
✅ Leaving a comment below! (What is You opinion about this Coin)
Your feedback and engagement keep me inspired to share more insightful market analysis with you!
Theusdt
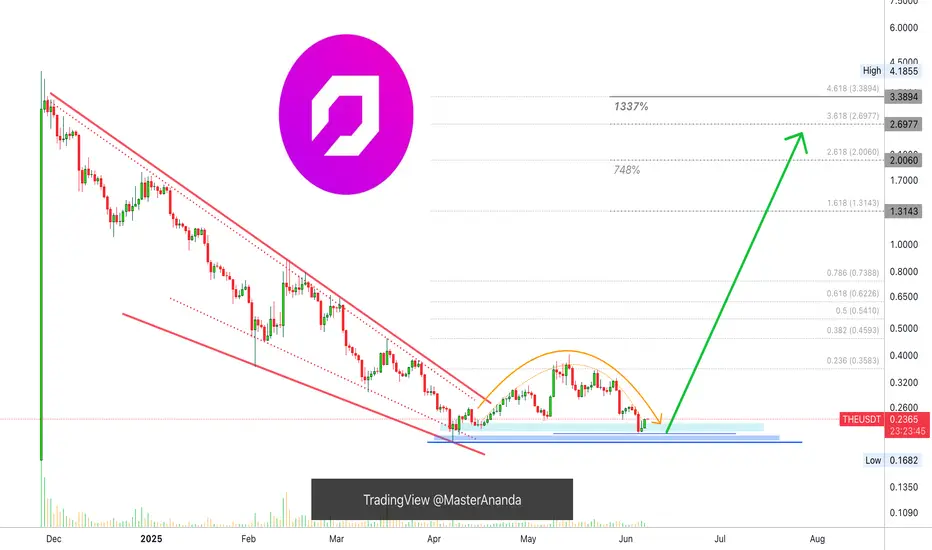
Thena: Hold Until The End (1,337% Profits Potential)Which one will you take? Endless opportunities the Cryptocurrency market has to offer; which one will you take?
Doesn't need to be just one can be many. You can choose many pairs to trade.
Countless opportunities are available now and these will be generating huge profits in the coming days.
The first burst forward will produce 100%, in 1-3 days. And this will be followed by sustained long-term growth. It will grow so much and for so long, that you will become bored. It won't be exciting anymore... Until the correction of course.
Thena here has more than 1,000% potential for growth. Right now this pair, THEUSDT, is sitting on a higher low or double-bottom, in this case it is the same.
This is the same pattern produced by Ravencoin, remember?
That project that grew more than 150% in a single day. "Altcoins Market Bull Market Confirmed, Ravencoin." And it is true, watch everything grow.
This same pattern is present on so many altcoins, not all of them but many and we know exactly what will happen next because what one does, the rest follows.
THEUSDT is about to go bullish, can take a few weeks or less, a few days.
When the bullish wave starts it will go for months, months of sustained growth. You simply hold until the end.
Thank you for reading.
Namaste.
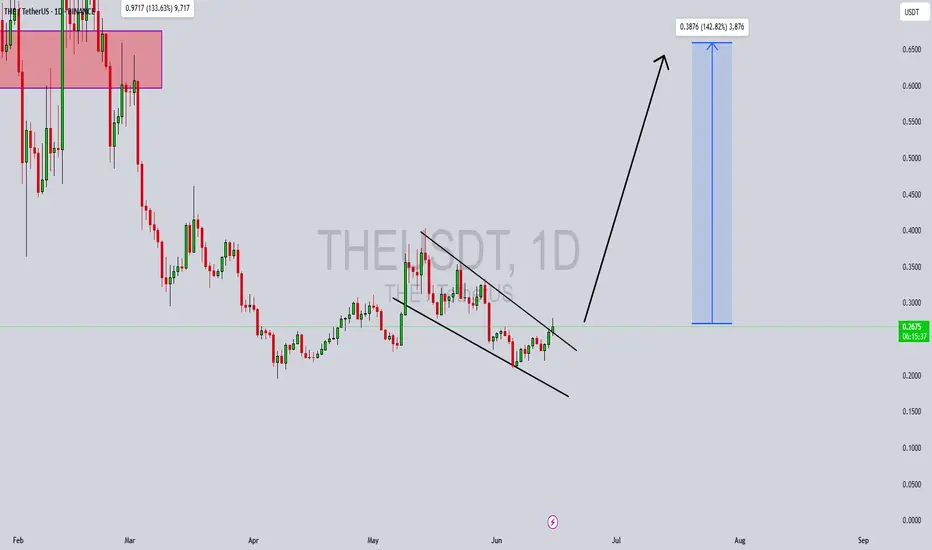
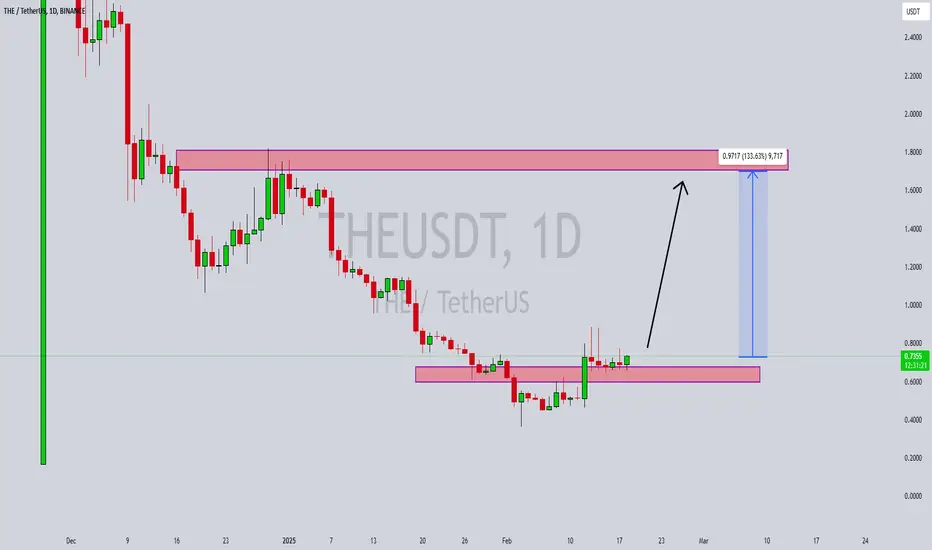
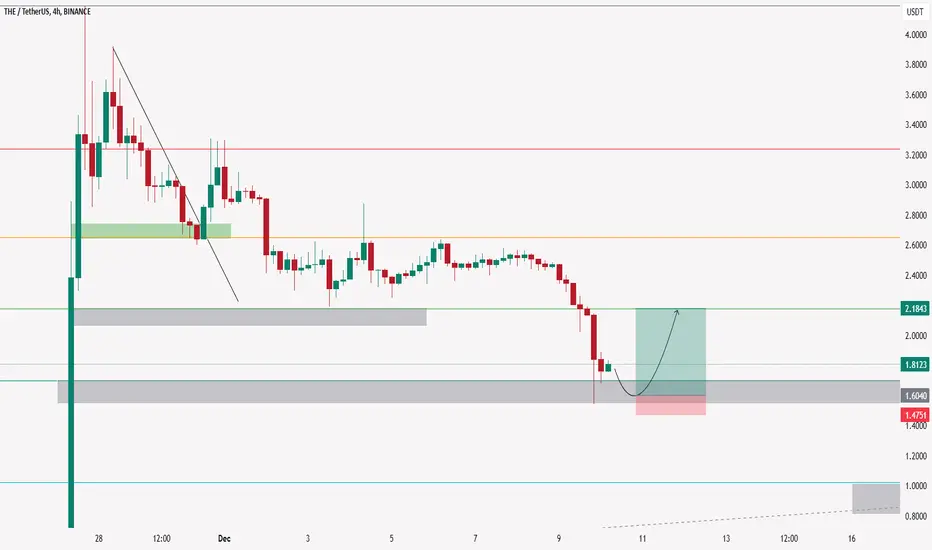
THEUSDT Forming Falling Wedge BullishTHEUSDT is showcasing a strong technical breakout from a falling wedge pattern, a formation widely regarded as bullish in the world of crypto trading. This structure typically signals the end of a downtrend and the potential start of a strong upward movement. With price action now breaching the wedge’s upper resistance line and confirming bullish momentum, this breakout opens up the possibility for an explosive rally. Current projections point to a potential gain of 90% to 100%+, making it one of the more attractive setups among altcoins.
The volume is also confirming the breakout, suggesting that traders and investors are actively entering positions. This increase in participation often fuels further upward movement, especially when combined with a technically significant chart pattern like this. THEUSDT is not only displaying strength on the technical side, but also showing promising signals from investor sentiment, with more eyes turning toward this project across social platforms.
Price targets for this setup are derived from the height of the wedge and historical resistance zones. As seen in the chart, the upside potential could push THEUSDT toward the $0.50–$0.65 range, where previous liquidity zones may come into play. With altcoins heating up and capital rotating into high-upside plays, THEUSDT’s setup offers an excellent risk-to-reward profile at this stage.
Traders should monitor volume continuation and possible retests of the breakout zone as confirmation. With the broader market recovering and interest returning to promising altcoins, THEUSDT stands out as a potential leader in the next bullish wave.
✅ Show your support by hitting the like button and
✅ Leaving a comment below! (What is You opinion about this Coin)
Your feedback and engagement keep me inspired to share more insightful market analysis with you!
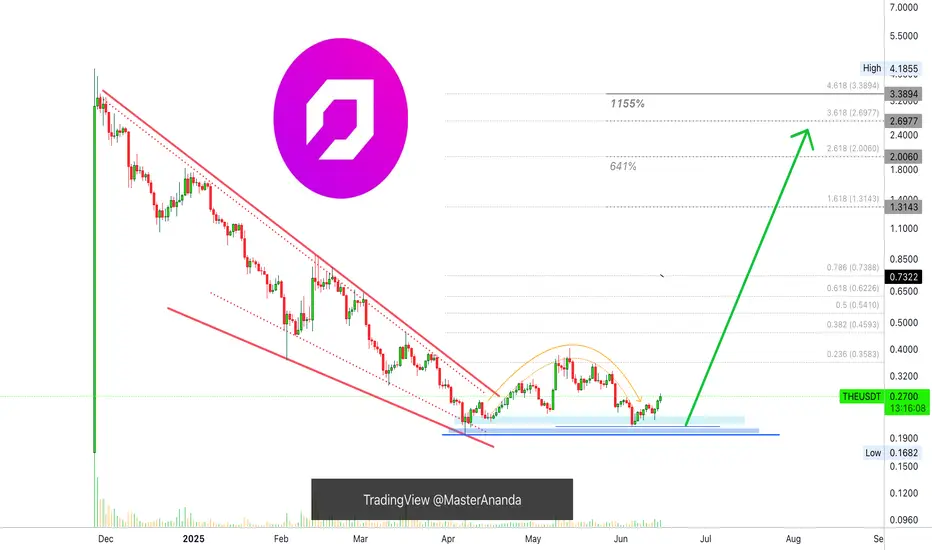
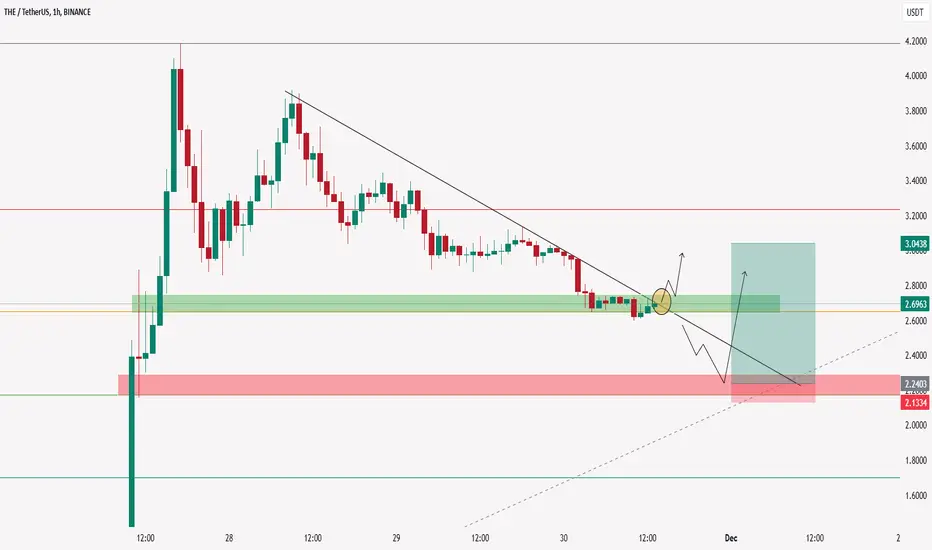
Thena Ready To Move Now! Strong Short- & Long-Term (1,155% PP)I don't like to post the same charts because there are just too many options and we cannot even get close to looking at all those, specially with a limit of only ten post per day. But, with that said, here we have Thena again, THEUSDT, why? Because it is ready to move and a great time-based opportunity only comes around so often.
When it comes to Cryptocurrencies opportunities are endless is true, but some tend to move faster than others and this one looks good. It looks good short-term and has huge potential also long-term. So good on all sides. Risk is very low. We have a classic local higher low and the stage is set, the world is ready; watch it grow.
Nothing is pointing down. Everything is pointing up.
No plan, no strategy, no complexities... Just buy and hold.
Namaste.
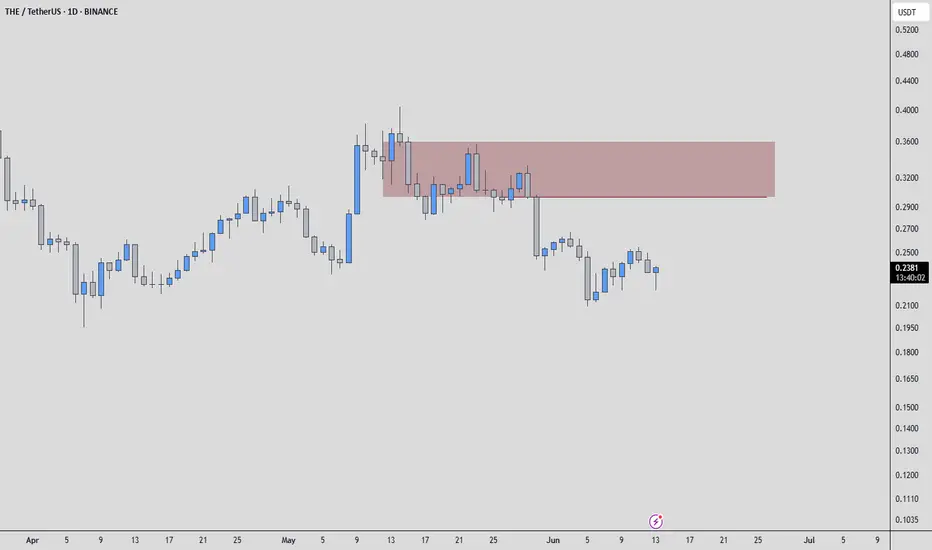
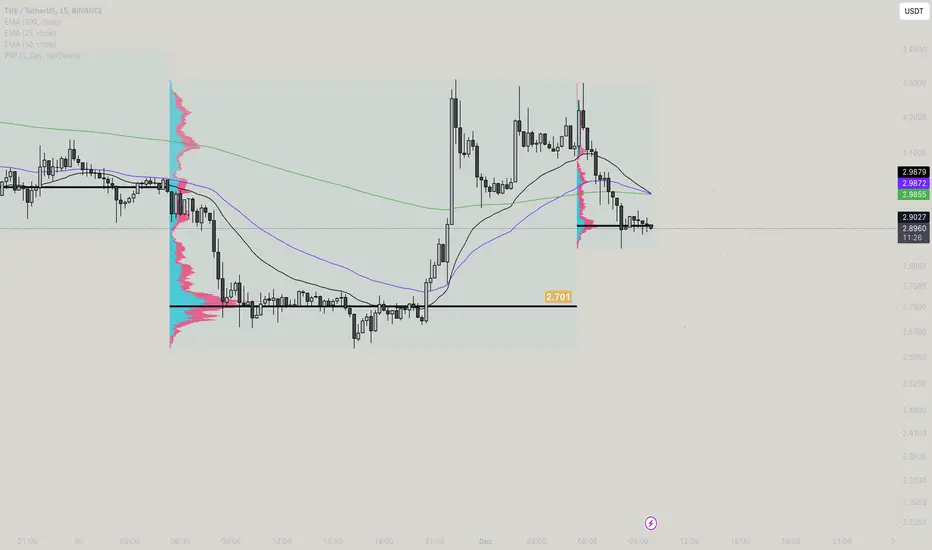
THEUSDT Analysis: Weak Buyers and Downside ConfirmationOn THEUSDT, my current observation is clear: buyers are extremely weak. This isn't just a hunch; the underlying order flow and volume dynamics point to a lack of conviction from the bullish side.
Because of this noticeable weakness, my focus will be squarely on the red box I've identified on the chart. This area is where I'll be actively seeking downward confirmations on lower timeframes. This means I'm looking for signs like:
Failed attempts to rally: Price pushing up into the red box but quickly getting rejected.
Increased selling volume: A spike in volume on bearish candles as price interacts with or breaks below this zone, especially on the volume footprint.
CDV (Cumulative Delta Volume) turning decisively negative: This would signal that sellers are genuinely taking control.
Low Timeframe (LTF) breakdowns: Clear bearish structures forming, like lower highs and lower lows, coupled with retests of broken support as new resistance.
Remember, my strategy dictates that I only analyze and consider trades on coins showing a sudden and significant increase in volume. While THEUSDT's current context may not be about a sudden bullish volume spike, the analysis of existing volume and order flow within this weakness is crucial.
The market rewards patience and confirmation. I will not be looking for long opportunities here. My attention is entirely focused on finding those bearish confirmations within the red box. If they materialize, it presents a clear directional bias for a downside move.
📌I keep my charts clean and simple because I believe clarity leads to better decisions.
📌My approach is built on years of experience and a solid track record. I don’t claim to know it all but I’m confident in my ability to spot high-probability setups.
📌If you would like to learn how to use the heatmap, cumulative volume delta and volume footprint techniques that I use below to determine very accurate demand regions, you can send me a private message. I help anyone who wants it completely free of charge.
🔑I have a long list of my proven technique below:
🎯 ZENUSDT.P: Patience & Profitability | %230 Reaction from the Sniper Entry
🐶 DOGEUSDT.P: Next Move
🎨 RENDERUSDT.P: Opportunity of the Month
💎 ETHUSDT.P: Where to Retrace
🟢 BNBUSDT.P: Potential Surge
📊 BTC Dominance: Reaction Zone
🌊 WAVESUSDT.P: Demand Zone Potential
🟣 UNIUSDT.P: Long-Term Trade
🔵 XRPUSDT.P: Entry Zones
🔗 LINKUSDT.P: Follow The River
📈 BTCUSDT.P: Two Key Demand Zones
🟩 POLUSDT: Bullish Momentum
🌟 PENDLEUSDT.P: Where Opportunity Meets Precision
🔥 BTCUSDT.P: Liquidation of Highly Leveraged Longs
🌊 SOLUSDT.P: SOL's Dip - Your Opportunity
🐸 1000PEPEUSDT.P: Prime Bounce Zone Unlocked
🚀 ETHUSDT.P: Set to Explode - Don't Miss This Game Changer
🤖 IQUSDT: Smart Plan
⚡️ PONDUSDT: A Trade Not Taken Is Better Than a Losing One
💼 STMXUSDT: 2 Buying Areas
🐢 TURBOUSDT: Buy Zones and Buyer Presence
🌍 ICPUSDT.P: Massive Upside Potential | Check the Trade Update For Seeing Results
🟠 IDEXUSDT: Spot Buy Area | %26 Profit if You Trade with MSB
📌 USUALUSDT: Buyers Are Active + %70 Profit in Total
🌟 FORTHUSDT: Sniper Entry +%26 Reaction
🐳 QKCUSDT: Sniper Entry +%57 Reaction
📊 BTC.D: Retest of Key Area Highly Likely
📊 XNOUSDT %80 Reaction with a Simple Blue Box!
📊 BELUSDT Amazing %120 Reaction!
📊 Simple Red Box, Extraordinary Results
📊 TIAUSDT | Still No Buyers—Maintaining a Bearish Outlook
📊 OGNUSDT | One of Today’s Highest Volume Gainers – +32.44%
📊 TRXUSDT - I Do My Thing Again
📊 FLOKIUSDT - +%100 From Blue Box!
📊 SFP/USDT - Perfect Entry %80 Profit!
📊 AAVEUSDT - WE DID IT AGAIN!
I stopped adding to the list because it's kinda tiring to add 5-10 charts in every move but you can check my profile and see that it goes on..
THEUSDT 1D AnalysisTHE ~ 1D Analysis
#THE This trade is very high risk
Buy from here if you still have confidence in this coin with a short term target of at least 15%+ from here.

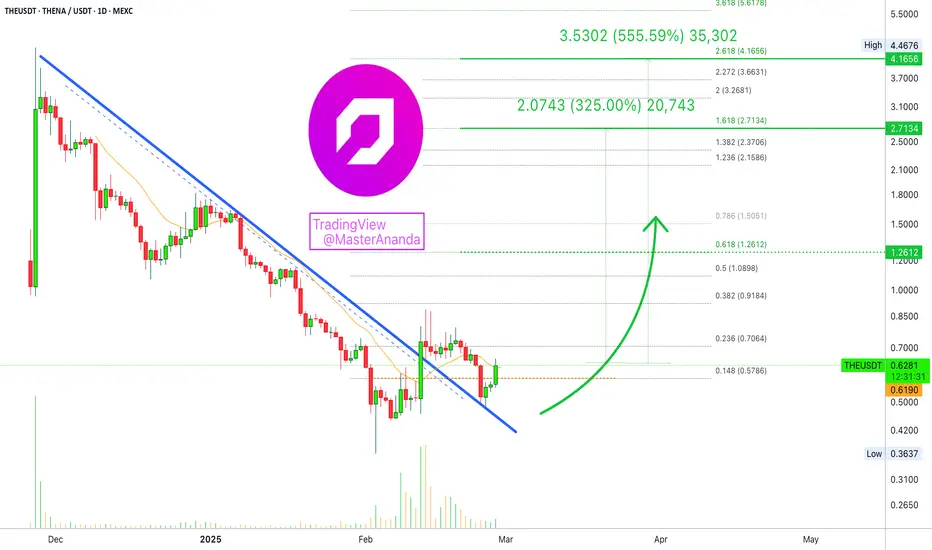
Thena: Simply Bullish (555% Potential)It is no longer necessary to proof that the bottom is in for the Altcoins market, this is clearly confirmed as it happened a while ago, more than three weeks ago.
Here, on the THEUSDT (Thena) chart, it can be seen as a low hit 3-February. With a higher low hit Tuesday (25-Feb), this pair is turning green.
This is easy, simple but bullish.
The blue line on the chart marks the downtrend. A descending trendline. As soon as the action moves above this line the downtrend is confirmed broken. The market bias changes from bearish to bullish. THEUSDT is now in the bullish zone with bullish potential. The higher low reinforces this notion/signal.
Notice how after the 12-February bullish breakout there are three reactions on the same down-trendline that was once a strong resistance. Resistance turned support. This trendline was tested and it holds. Now that it holds prices can easily move up. It is still early though.
Another signal comes from the 0.148 Fib. extension level. The action is moving above this level today. A close above this level further strengthens a bullish case.
Finally, we have EMA13, the orange line on the chart. Once the day closes above it bullish tendencies are confirmed. Simple, yet bullish.
We have two targets mainly based on the short- and mid-term. One target goes for 325% and the next one goes for 555%.
Patience is key.
Buy and hold.
The Altcoins market is bullish now.
Thank you for reading.
Namaste.
Bearish on $THE (Binance Futures)1. We have price reacting off from the premium H4 OB-
2. We have a buyside purge
3. We have a CISD o H1
4. Price is at premium
5. We have discount draws as the H1 OB- AND BREAKERS

THEUSDT 100%-130% Gains Potential Ahead!THEUSDT is currently experiencing a strong bounce from a key support level, signaling a potential bullish reversal. This support level has acted as a significant floor for the price, and the bounce suggests that buying pressure is starting to build. The price action indicates that investors are increasingly confident in this level holding, and with good volume behind the move, the chances of the price continuing to rise are high. Traders are targeting gains in the range of 100% to 130%+, as the price moves toward the next resistance levels. This bounce from support has captured the attention of both retail and institutional investors alike, contributing to a surge in interest around this crypto pair.
The good volume accompanying this bounce is a crucial indicator of the move’s strength. In technical analysis, volume plays a key role in confirming price moves, and with the increased trading activity, it’s clear that the market is reacting positively to the support level holding. If the price continues to hold above this support zone, it sets the stage for a potential rally, as the market shifts from a period of consolidation to a more bullish trend. The projected 100% to 130%+ gain is highly achievable if this momentum continues and resistance levels are successfully breached.
Investor interest in THEUSDT is growing, with many seeing the bounce from support as an indication of the start of a new upward trend. As the price breaks through resistance levels, it could trigger further buying activity, pushing the price higher. The solid technical setup, combined with increasing volume and a positive market sentiment, creates an attractive opportunity for traders looking for high-reward setups. The growing interest in this project adds fuel to the fire, increasing the likelihood that THEUSDT will continue to gain in value.
Traders should stay vigilant and monitor the price action closely, paying attention to key levels of support and resistance. If THEUSDT can maintain its position above the support level and push through resistance, it could lead to a substantial price increase, delivering the expected gains. With the current technical indicators and strong market interest, THEUSDT is shaping up to be one of the more promising crypto pairs to watch for significant returns.
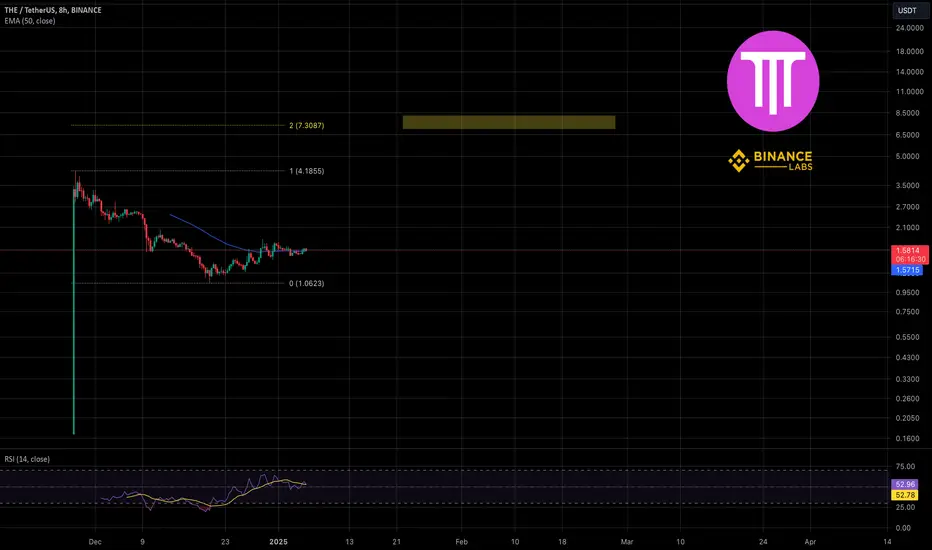
New Thena project from Binance!Thena reminds me of Lista, which was also made for pumping Binance bags. So far it's only 130 million capitalization, but knowing Binance, it will easily grow into 1 billion! I expect a Thena partnership with one of the market makers soon. So far, I haven't detected any MM presence... TVL is also good, I would expect a price around 7$ per coin, this just correlates with the thought of 1 billion, and also technically fits well with the chart technicals.
Horban Brothers.
THEUSDT Analysis: High Volume Surge and Support ZonesTHEUSDT has experienced an impressive %689 daily volume increase , indicating heightened interest and activity. The potential support zones are marked on the chart, and any upward reaction from these levels on lower time frames could signal a long opportunity .
Key Points:
Volume Spike: The significant increase in daily volume shows buyer activity and market engagement.
Support Levels: Carefully identified zones offer promising opportunities if confirmed by upward price movement.
Lower Time Frame Confirmation: Waiting for bullish reactions from the marked zones is crucial for safer entries.
Confirmation Indicators:
When trading these levels, I use CDV, liquidity heatmap, volume profile, volume footprint , and upward market structure breaks in lower time frames to ensure robust confirmation.
Learn My Techniques:
Want to identify such zones with confidence? DM me to learn advanced tools like CDV, liquidity heatmaps, and more!
Reminder:
Manage your risk carefully, as market conditions can change rapidly. Engage with this post if you find it helpful your support keeps me motivated to share more insights!
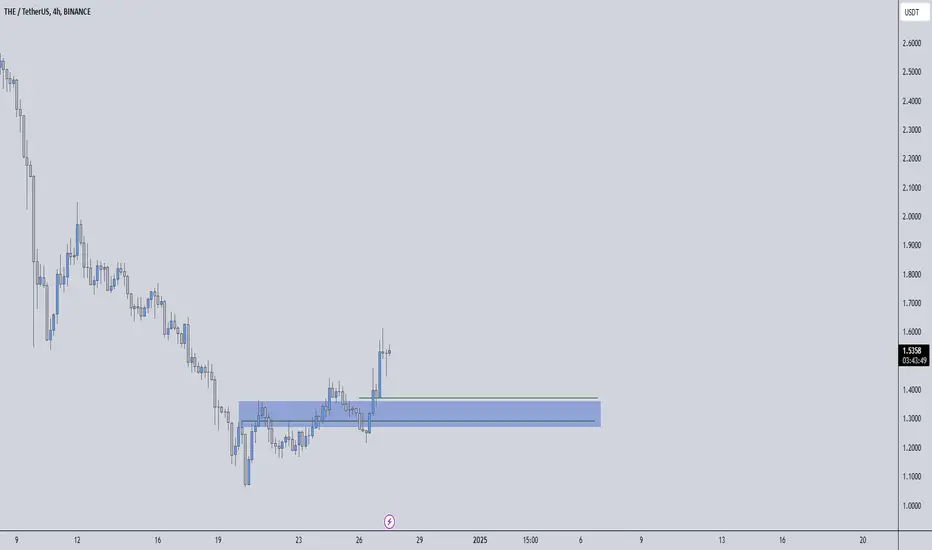
Trading opportunity for THEUSDTBased on technical factors there is a Sell position in :
📊 THEUSDT
🔴 Sell Now
🪫Stop loss 1.6545
🔋Target 1.3030
📏 R/R 1.7
💸RISK : 1%
We hope it is profitable for you ❤️
Please support our activity with your likes👍 and comments📝

THENA COIN PRICE ANALYSIS AND NEXT POSSIBLE TRADE SETUP !!TSX:THE Coin Updates!!
• i am expecting now 10%-30% bounce back in its price.. Next few days if btc start consolidating in range✅
• You can take risk on it if you find good setup🫡
Warning : Thats Just our Analysis..
Jazakallah❤️
THEUSDT Shorts!Approaching #THEUSDT shorts as the divergence almost looks like a death cross,
SHORT - CMP
SL - 3.01
Targets mentioned in yellow
THENA COIN PRICE ANALYSIS AND NEXT POSSIBLE TRADE SETUP !!TSX:THE Coin Update!!
• currently Price holding golden Fib key level but i am not expecting bounce back from her... Still if its break trendline and you get confirmation for trade then use low fund and low leverage✅
• On the other hand i think pottential trade setup will be find when price at 2.30$-2.20$
Warning : That's just my analysis not a trade execution ... #DYOR Before follow me 🚨
THENA-USDT 15min Great VOLATILITYTHENA-USDT -
First strategic tests with the bot, offered spectacular results of 20% profit with "ALL" trades in positive (24h).
We continue working on the small problems that have arisen, but for a diamond to become brilliant, the edges must be polished :)
Thank you!
_______________________________________________________
THENA-USDT 15min Great VOLATILITY
Its price has increased by +260% in just one day
The rise has been incredible throughout the day, but at some point it will be necessary to correct, so there is a great opportunity to go SHORT if the market allows it.
I was doing SHORTS with EMA CROSS: 1min - 3 min - 5min.
Another possibility is to wait for the falls to go LONG.
Whatever the case, this volatility allows us to position ourselves and seek profits in very short time frames.
Either of the 2 is good as long as you know how to catch waves.
Protect your investors with SL and have very good luck with your decisions.
__________________________________________________
Automated Cryptocurrency Trading Bots: All these strategic alternatives can be configured with TradeX BoT, since it will allow you to position in both directions without having to block any amount per position. It will only be necessary for the conditions to be met, either downward or upward, for the orders to be executed in one direction or another, taking the necessary deposits from your portfolio.
TradeX BoT (in development): Tool to automate trading strategies designed in TradingView. It works with both indicators and technical drawing tools: parallel channels, trend lines, supports, resistances... It allows you to easily establish SL (%), TP (%), SL Trailing... multiple strategies in different values, simultaneous BUY-SELL orders, conditional orders.
This tool is in the process of development and the BETA will soon be ready for testing.
FOLLOW ME and I will keep you informed of the progress we make.
I share with you my technical analysis assessments on certain values that I follow as part of the strategies I design for my portfolio, but I do not recommend anyone to operate based on these indicators. Inform yourself, educate yourself and build your own strategies when investing. I only hope that my comments help you on your own path :)

#THEUSDT $THE #THE THERE ARE TWO NICE PATTERNSYou will see nice price turning and also there are Libra and Harmonic Butterfly pattern.
Lets see what will happens
