TIA/USDT Testing Downtrend Line: Reversal or More Downside?Summary:
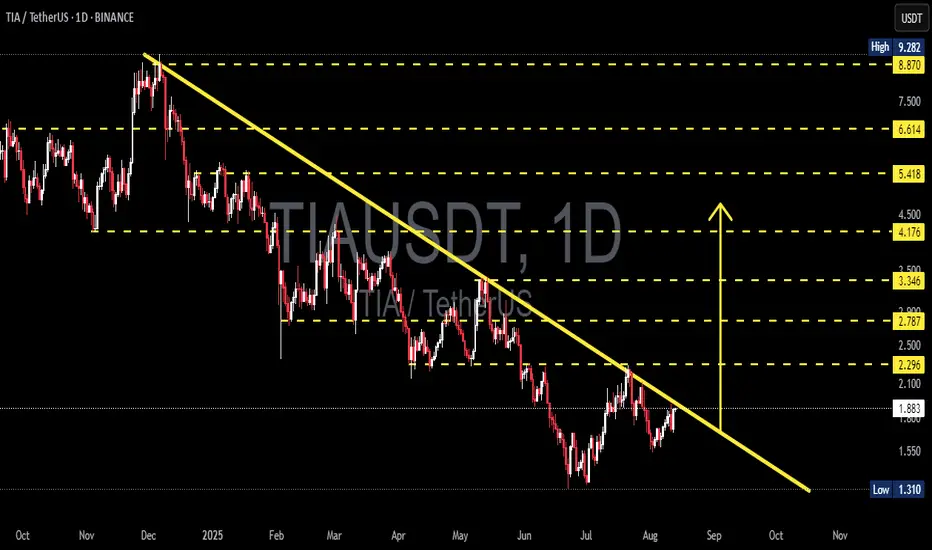
TIA price remains below the main descending trendline (yellow) drawn from the Dec–Jan peak. Price is currently hovering around $1.87–$2.00, right under the key $2.00–$2.10 resistance zone and the trendline. This is a decision zone: a breakout could trigger a reversal, while rejection could extend the bearish trend.
---
Key Structure Levels (from chart)
Support: $1.75–$1.80 (minor), $1.62, $1.31 (major low).
Resistance: $2.00–$2.10, $2.296, $2.787, $3.346, $4.176, $5.418, $6.614, $8.870 (near ATH $9.282)**.
---
Pattern & Context
Daily downtrend still dominant (series of lower highs) with the descending trendline acting as dynamic resistance.
Since mid-July, price has formed higher lows from $1.31 → gradually consolidating toward the trendline.
If $2.10 is treated as a “neckline” of a short-term accumulation, measured move = (2.10 − 1.31) ≈ $0.79 → conservative upside target ≈ $2.90 (aligns with $2.787 level).
---
Bullish Scenario
Trigger:
Daily close above the trendline + $2.10, ideally followed by a retest of $2.00–$2.10 as support.
Step targets:
$2.296 → $2.787 → $3.346 → $4.176.
Structure projection: ≈ $2.90 (around $2.787).
Invalidation / Risk:
Daily close back below $1.80 after breakout, or a failed breakout above $2.10 without follow-through.
---
Bearish Scenario
Trigger:
Strong rejection at the trendline / $2.00–$2.10 with a decisive bearish candle.
Downside targets:
$1.80 → $1.62 → $1.31 (key low).
Break below $1.31 opens deeper bearish territory ($1.20–$1.00 psychological zone).
Invalidation / Risk:
Daily close above $2.10 would cancel the short-term rejection setup.
---
Action Plan (not financial advice)
Bullish: Wait for confirmation above $2.10 with volume/follow-through; target $2.29 / $2.79 / $3.35; manage risk below retest level.
Bearish: Watch for pin bar/engulfing rejection at the trendline/$2.00–$2.10; target $1.80 / $1.62; invalidation if daily closes > $2.10.
#TIA #Celestia #TIAUSDT #CryptoTA #PriceAction #SupportResistance #Trendline #BreakoutWatch #DailyTimeframe #BearishVsBullish
TIAUSDC
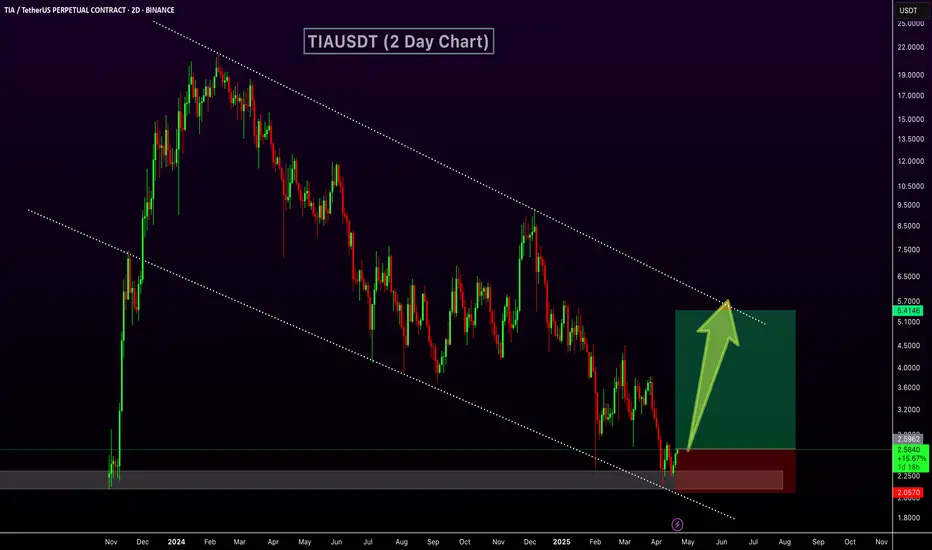
TIAUSDT Bottoming Out?TIAUSDT Technical analysis update
TIAUSDT has been trading within the longest descending channel. The price has once again touched the channel support and also retested the November 2023 support level or bottom. A strong bounce from this zone is likely, and we could potentially see a 100–150% move from the current level.
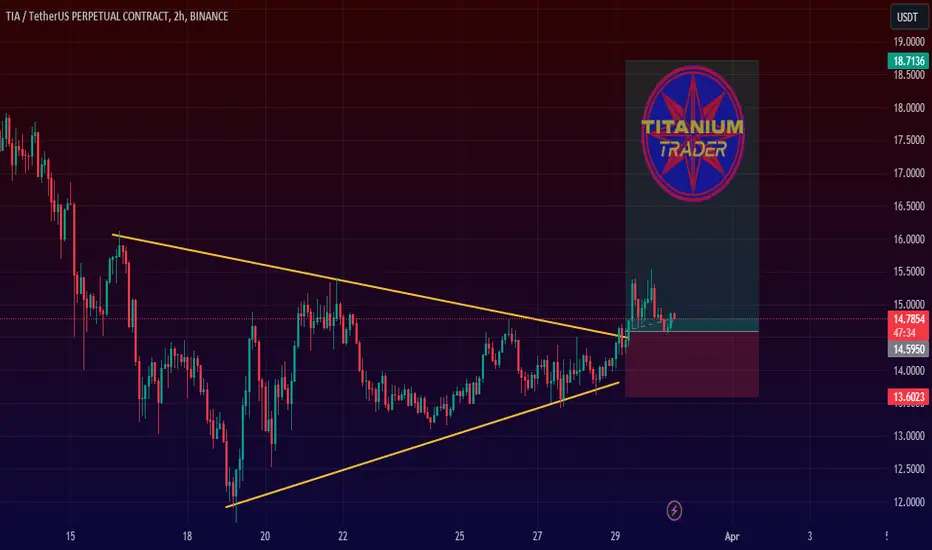
TIA BULLISH MOVE AHEADTIA is currently trading above upper band of symmetrical triangle, another bullish wave is expected.