• Products
  • Community
  • Markets
  • Brokers
  • More
Get started
  • Community
  • /Ideas
  • /Time_comparison

Time_comparison

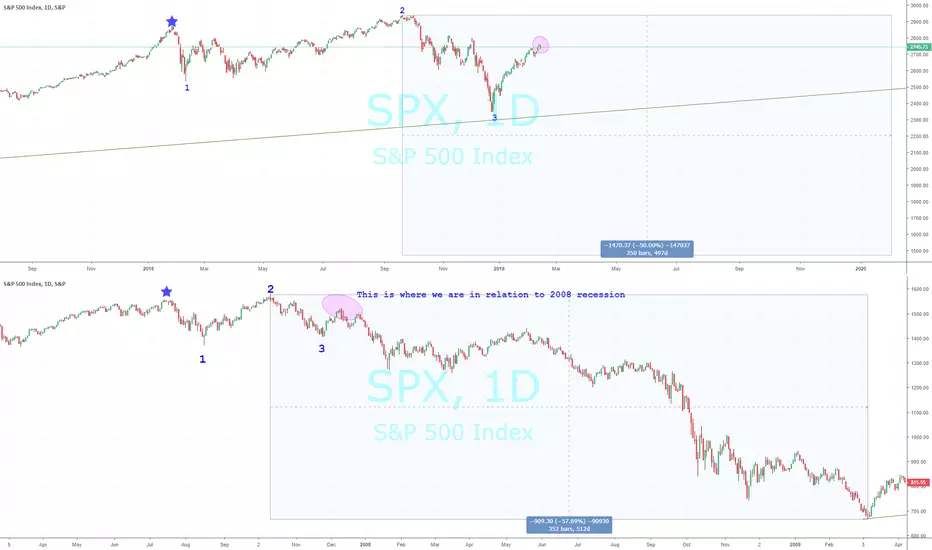
The 2019 Recession vs. 2008I have marked roughly were I believe today's market is in relation to the 'Great Financial Crisis of 2008'. Each chart depicts: A blue star for a top in the market Followed by a low - marked with the number 1 Followed by the final market top - marked with the number 2 Followed by the first bottom of declines - marked with the number 3 And today's current position is the pinkish circle. If this is true, the next will occur soon and surpass the prior lows marked with the number 3. In the current case these would be the December 24th lows. It took about 352 trading days from top to bottom in 2007-2009 in which the market lost 57% of its value. I only marked a 50% loss on today's chart because it would be much more costly if it occurred and I drew out the highlight for roughly 350 days from the market highs on September 21, 2018. Mark Twain is rumored to have said, "History doesn't repeat itself but it often rhymes." Do these charts rhyme? Are they coincidence? Or nothing close? Let me know what you think!
SP:SPXShort
by StockSignaler
55

Select market data provided by ICE Data services. Select reference data provided by FactSet. Copyright © 2025 FactSet Research Systems Inc.© 2025 TradingView, Inc.

More than a product
  • Supercharts
Screeners
  • Stocks
  • ETFs
  • Bonds
  • Crypto coins
  • CEX pairs
  • DEX pairs
  • Pine
Heatmaps
  • Stocks
  • ETFs
  • Crypto
Calendars
  • Economic
  • Earnings
  • Dividends
More products
  • Yield curves
  • Options
  • News Flow
  • Pine Script®
Apps
  • Mobile
  • Desktop
Community
  • Social network
  • Wall of Love
  • Refer a friend
  • House Rules
  • Moderators
Ideas
  • Trading
  • Education
  • Editors' picks
Pine Script
  • Indicators & strategies
  • Wizards
  • Freelancers
Tools & subscriptions
  • Features
  • Pricing
  • Market data
Trading
  • Overview
  • Brokers
Special offers
  • CME Group futures
  • Eurex futures
  • US stocks bundle
About company
  • Who we are
  • Manifesto
  • Athletes
  • Blog
  • Careers
  • Media kit
Merch
  • TradingView store
  • Tarot cards for traders
  • The C63 TradeTime
Policies & security
  • Terms of Use
  • Disclaimer
  • Privacy Policy
  • Cookies Policy
  • Accessibility Statement
  • Security vulnerability
  • Status page
Business solutions
  • Widgets
  • Charting libraries
  • Lightweight Charts™
  • Advanced Charts
  • Trading Platform
Growth opportunities
  • Advertising
  • Brokerage integration
  • Partner program
  • Education program
Community
  • Social network
  • Wall of Love
  • Refer a friend
  • House Rules
  • Moderators
Ideas
  • Trading
  • Education
  • Editors' picks
Pine Script
  • Indicators & strategies
  • Wizards
  • Freelancers
Business solutions
  • Widgets
  • Charting libraries
  • Lightweight Charts™
  • Advanced Charts
  • Trading Platform
Growth opportunities
  • Advertising
  • Brokerage integration
  • Partner program
  • Education program
Look FirstLook First