TradeCityPro | TON Eyes Breakout After Support Zone Rebound👋 Welcome to TradeCity Pro!
In this analysis, I want to review the TON coin for you — one of the popular coins owned by Telegram, currently ranked 20 on CoinMarketCap with a market cap of 7.51 billion dollars.
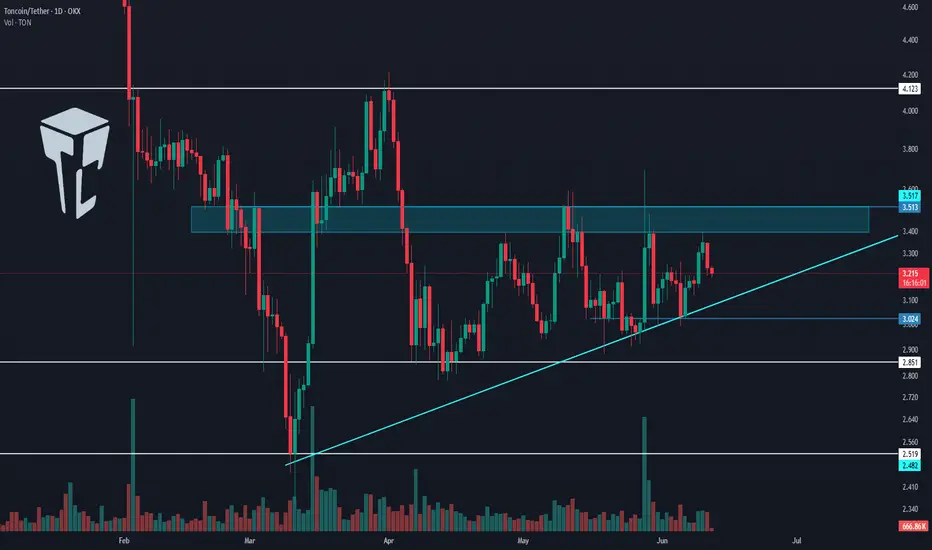
📅 Daily timeframe
In the daily timeframe, unlike other coins that have already broken their highs and are moving upward, this coin hasn’t yet reached its top and has just been supported from the bottom of its range box.
✔️ A Maker Buyer zone has formed between the 2.725 and 2.519 levels, which is the main support zone for this coin, and the price has been supported from this area and is now moving upward.
📈 The trigger confirming this support was the 2.927 level, and after this trigger got activated and the price consolidated, it seems the main bullish leg has now started, and the price can move toward the top of the box.
✨ If you already have a long position on this coin, I recommend holding it — especially if you have other open positions — because this move has just started, and if an uptrend forms, your entry is at a great level.
⭐ The first zone where I might take partial profits is the 3.513 top, which is a Maker Seller zone and may cause a pullback.
💥 On the other hand, if you don’t have an open position yet, the first long trigger is the break of 3.513. This level is the top of the box, and breaking it confirms the beginning of a bullish trend.
🔍 The RSI trigger and the entry of bullish momentum into the market is the break of 58.84 on this oscillator. Volume so far is well aligned with price, and if this buying volume continues to rise, we can expect sharp bullish moves from this coin.
📝 Final Thoughts
This analysis reflects our opinions and is not financial advice.
Share your thoughts in the comments, and don’t forget to share this analysis with your friends! ❤️
TON

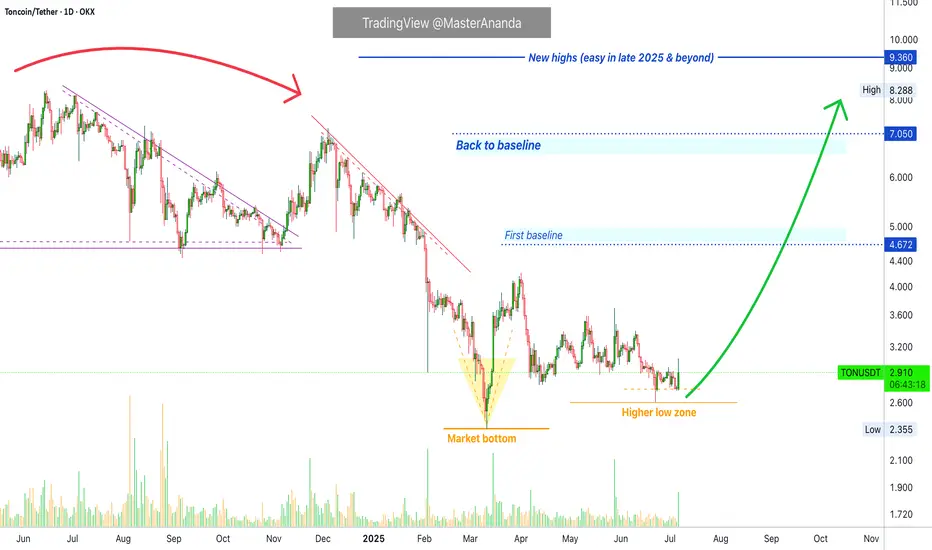
Toncion Update: Never Again Below $3.00 · New All-Time High NextToncoin already closed five consecutive days green as it prepares for a major advance. The last time this happened was in early April and this produced a nice jump. The difference now is that in April the market was coming out of a downtrend and the low was a major low. In June the market was in a retrace and the low is a higher low. Much difference. The next advance is very close, already here, and will produce the highest prices in more than a year, since June 2024 and of course, it will go beyond for sure, a new all-time high.
This is the last time you will see Toncoin trading at low prices before the major 2025 bull market cycle and wave. There is no limit to the upside, it is possible that in just a few days from now Toncoin will move away from $3 and never trade at this price again. That is, you will never be able to buy TON for $3.00, the price will be much higher. Do you remember Litecoin when it traded at 3 cents? What about Bitcoin at $3,000? What about Ethereum at $100? Well, Toncoin is no different. It will grow so much and so strong that we will be happy that we decided to be 100% Crypto. Risk vs reward. We accept the risk and for this reason we can enjoy an amazing reward.
Namaste.
TON – Just a Trade, Probably Out at $6.30📈💼 TON – Just a Trade, Probably Out at $6.30 🎯📊
Welcome back to the Altcoin Series, this time with a closer look at Toncoin (TON) — and yes, it’s just a trade.
Later in the cycle I’ll be divorcing altcoins, but not yet. I’m still bullish. I see setups, I take them. I don’t marry charts — I extract from them.
🔍 What’s the Setup?
TON is at a retest of long-term trendline support, with multiple prior accumulation zones marked on the chart. We’ve just bounced from $2.81, right above the golden pocket area, and we have a clear map higher — but it’s a trade, not a love letter.
🔑 Key Levels
🔹 Entry zone: $2.81–$2.95 (golden pocket & trendline bounce)
🔹 Next levels to watch:
$3.74
$5.52
Likely exit zone: $6.35
🔺 Fib extension shows potential up to $8.49+, but I’m keeping it tight
🛑 Invalidation: Close below $2.81 = back to cash
🧠 The Trader’s Mindset
TON is moving with the narrative — it’s been strong, it’s caught attention, and it’s holding key levels. But I’m not here to believe in the story.
✅ It’s a structural bounce
✅ The risk is clear
✅ The target is clean
🚫 No emotion, no narrative, just levels
This isn’t marriage. It’s business.
🧩 What’s New in Tron?
Tron is picking up momentum, driven by multiple on-chain and institutional signals:
📈 Whale accumulation & on-chain strength — large holders have been accumulating, while withdrawals suggest long-term conviction
🤝 Strategic partnership with Binance Alpha — a roadmap to DeFi expansion and increased liquidity
🧩 Growing stablecoin & DeFi footprint — over $80B USDT on Tron, 6B+ transactions and $15B TVL
🏛️ Coming U.S. debut via a Nasdaq reverse merger — enhanced credibility and U.S. exposure, paused SEC probe, Trump-linked momentum
The Verge
Tron is evolving—from a memecoin playground to a player ready for institutional-level infrastructure.
One Love,
The FXPROFESSOR 💙
Disclosure: I am happy to be part of the Trade Nation's Influencer program and receive a monthly fee for using their TradingView charts in my analysis. Awesome broker, where the trader really comes first! 🌟🤝📈

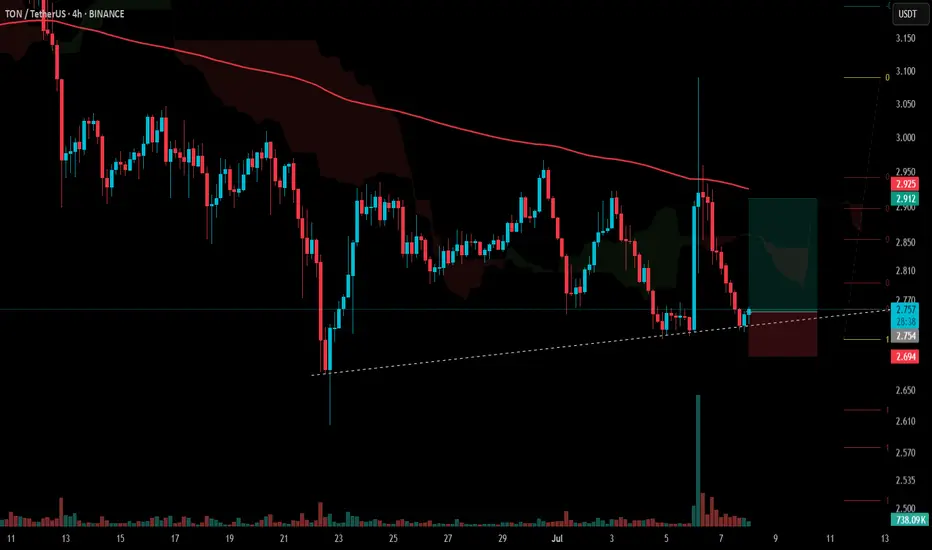
#TON Update #3 – July 7, 2025🟣 #TON Update #3 – July 7, 2025
After the recent news-driven spike on TON, I mentioned that I wasn’t looking to buy into the rally. In fact, I warned that a correction was likely. One thing I always keep in mind:
Do not buy what's already pumping.
Right now, TON is going through that correction. As long as it doesn’t break below the 2.720 zone , I believe it could continue forming a mild upward structure.
As shown on the chart, I’ve marked a potential long setup near 2.755 . That’s not a signal to buy as soon as price touches it, it’s a level I’ll reassess if reached. Only if price reacts strongly there would I consider entering.
Until then, TON is not in a favorable area for either long or short entries. I’m just watching for now.
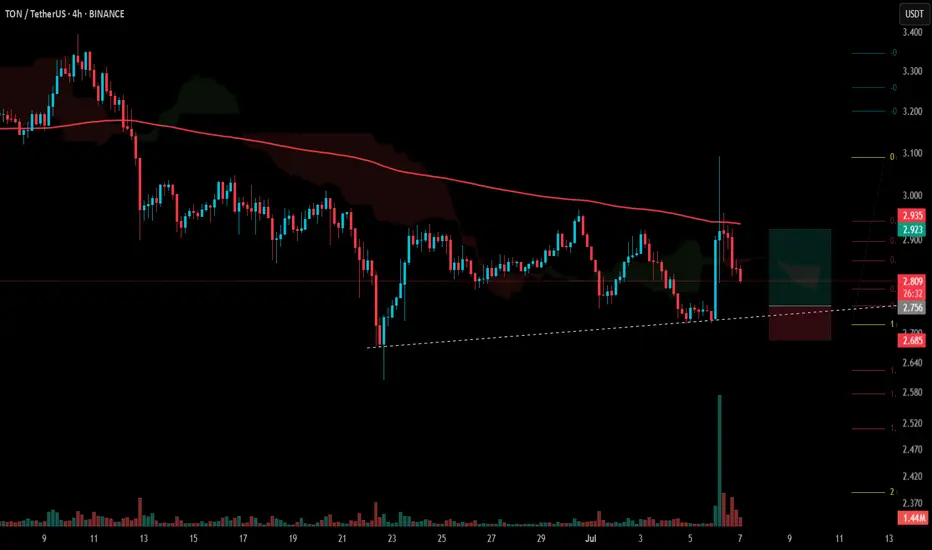
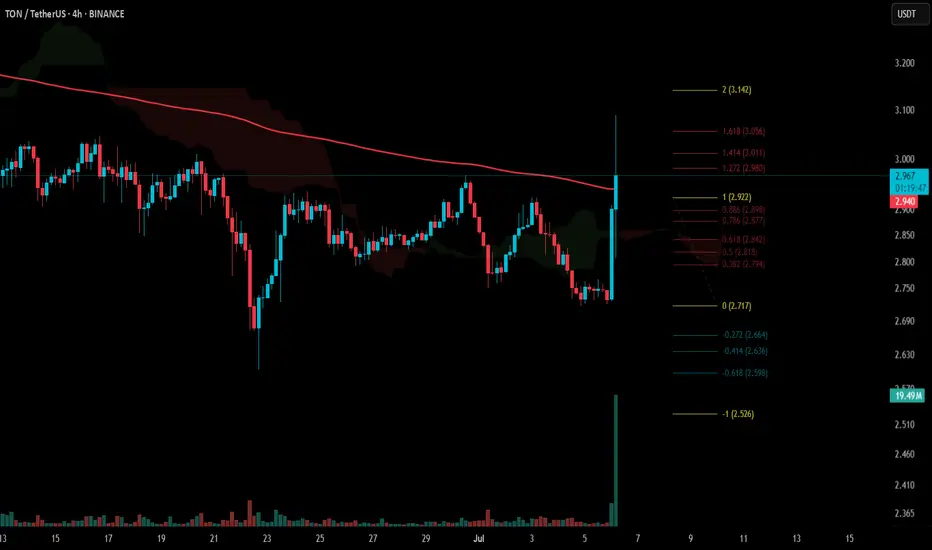
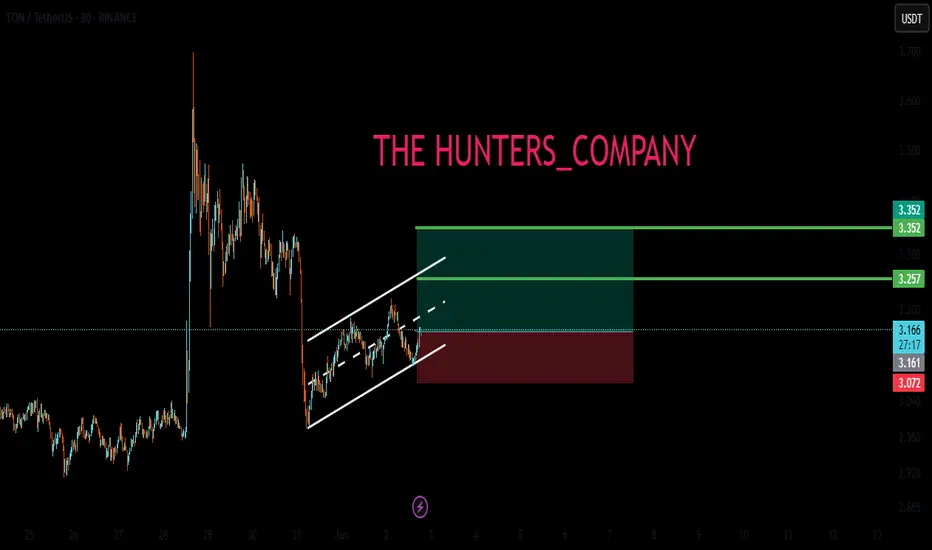
#TON Update #4 – July 8, 2025🟡 #TON Update #4 – July 8, 2025
Tonecoin has reached the area we previously marked as a potential entry zone. We’re now seeing early signs of a bounce from that level.
For this reason, I'm considering entering a trade here, with a risk-to-reward ratio of approximately 2.63.
▫️ Entry: 2.754
▫️ TP1: 2.850 (50%)
▫️ TP2: 2.910 (50%)
▫️ Stop: 2.694
❗️ I do not recommend moving the stop loss. Stick to the plan. This trade will be actively monitored and updated if necessary.
Did you hit a TON?TON yesterday moved due to a golden visa news - That said after the news came of UAE denying golden visa claim it fell, That move was not for that I guess, See the pas of it, If market stays like that, you would see it touch the springs!

Toncoin Bullish Breakout Confirmed —8X Lev. PossibleLook at the volume today, it is the highest since late May. This high volume coupled with a big bullish candle confirms two things: 1) The higher low is in and 2) the next bullish wave starts now.
There is no other way things can develop. The chart is the market. The chart reveals everything you need to know. Toncoin's chart is revealing buying pressure right now, after a higher low. Now that the higher low is confirmed this means the bullish wave we have been expecting is underway.
This is the last chance. A great opportunity. This chart setup can be approached with leverage, easily with 5X. Can be more just as it can be less. Make sure to plan ahead.
Aim high —A new all-time high
Do not sell after 100% growth, the market will grow much more. Here there is an easy target open with 222%, this level should be achieved mid-term. Long-term, expect maximum growth.
The altcoins market will be growing straight up, month after month after month.
This is just a friendly reminder. Get back in the market.
Buy and hold.
Thanks a lot for your continued support.
Namaste.
#TON Update #1 – July 6, 2025⚪️ #TON Update #1 – July 6, 2025
Toncoin has partnered with the UAE to provide a 10-year golden visa for LSE:TON stakers.
The recent surge in Toncoin is primarily driven by this news. This sharp rise should be viewed with caution, as it’s not the result of a steady, healthy trend. While it may appear to have initiated a new impulsive move, the underlying structure is not solid. Therefore, I strongly advise against making any purchases until a proper correction takes place.
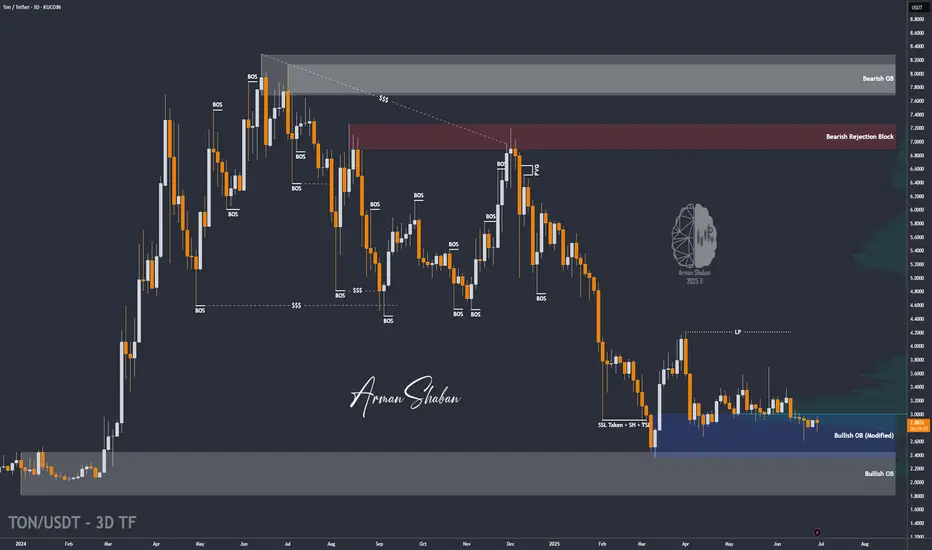
TON/USDT : Are you Bullish or Bearish? Let's Talk!By analyzing the #Toncoin chart on the 3-day timeframe, we observe that the price is still within the demand zone between $2.40 and $3.00.
If the price manages to break above the $3.10 level and hold within the next 7 days, we can expect further growth from this cryptocurrency.
The expected returns are approximately 20% in the short term, 40% to 55% in the mid-term, and up to 110% in the long term.
Please support me with your likes and comments to motivate me to share more analysis with you and share your opinion about the possible trend of this chart with me !
Best Regards , Arman Shaban
TON New Update (1D)This analysis is an update of the analysis you see in the "Related publications" section
Since we started publishing a series of bearish analyses on TON, the coin has experienced a significant drop | despite the ongoing growth of the Telegram app and its expanding user base.
Before reaching the support zone mentioned in our previous analysis, a strong intermediate demand zone is visible along the way, located just below a notable liquidity pool. A solid bullish reaction is expected from this identified demand area.
Targets are clearly marked on the chart.
A daily candle close below the invalidation level will invalidate this analysis.
For risk management, please don't forget stop loss and capital management
When we reach the first target, save some profit and then change the stop to entry
Comment if you have any questions
Thank You

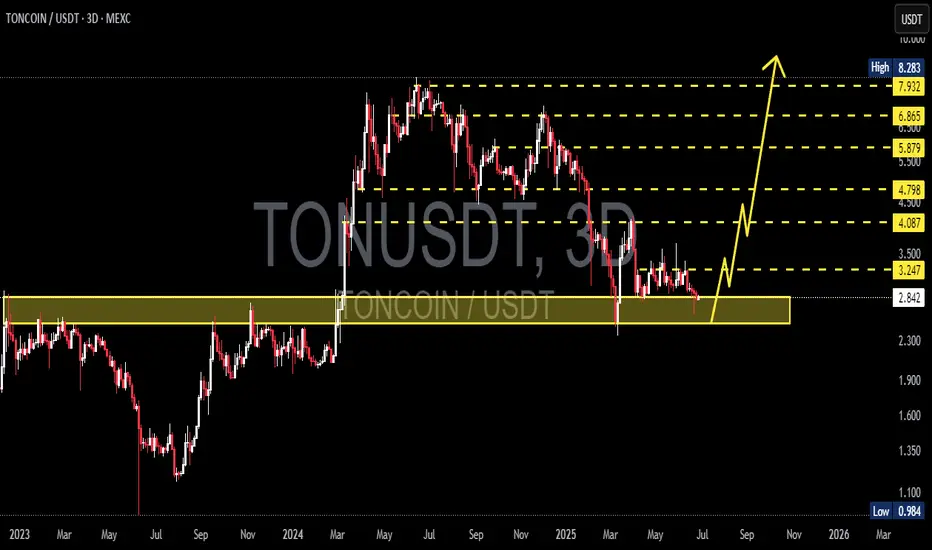
TONCOIN Preparing for Liftoff from the Golden Zone! Potential UpDetailed Breakdown:
🔶 Major Support Zone (Golden Accumulation Area):
TON is currently trading within a strong support zone between 2.839 - 2.300, which previously acted as a key resistance throughout 2023. This zone now serves as a high-probability accumulation area.
🔶 Double Bottom Structure & Reversal Potential:
The price action is forming a potential double bottom pattern, often signaling a major reversal after a prolonged downtrend. This is also supported by sideways consolidation on the support with decreasing selling momentum.
🔶 Bullish Targets (Based on Fibonacci & Historical Resistance):
If a bounce occurs from this golden support area, TON could rally towards the following key resistance levels:
🎯 Target 1: 3.247
🎯 Target 2: 4.087
🎯 Target 3: 4.798
🎯 Target 4: 5.879
🎯 Target 5: 6.865
🎯 Target 6: 7.932
🎯 Ultimate Target (ATH): 8.283
🔶 Maximum Potential Upside:
From the current level (around 2.839) to the all-time high (8.283), TON presents a +190% upside opportunity in a full bullish scenario.
Trading Strategy:
✅ Buy Zone: Accumulate within the golden support box (2.3 - 2.8 USDT)
🔁 Additional Entry: Upon breakout confirmation above 3.25 USDT
❌ Stop Loss: Below 2.2 USDT with strong bearish volume
📈 Take Profit Levels: Use resistance levels as partial TP targets
Conclusion:
TONCOIN is positioned at a technically significant support area, offering a high-risk-reward opportunity for swing traders and mid-term investors. A bullish reaction from this zone could initiate a strong multi-wave rally. Watch for breakout confirmation with volume before entering aggressively.
#TON #TONCOIN #CryptoBreakout #AltcoinSetup #TONUSDT #SwingTrade #BullishPattern #CryptoSignals #FibonacciLevels #TechnicalAnalysis
TON It will grow soon...Do you think this will happen, or do you see TON below $2.5 in the future?
Best regards CobraVanguard.💚
Toncoin Final Call: Last Chance For Bottom Prices (3-5X Lev Pos)The last 3D session that closed produced a major reversal signal and this is the last chance truly, the last opportunity; the final call. It is the final call to get Toncoin at low prices before a major bull market. It will be a massive bullish wave and this wave will reach new all-time highs and beyond during the price discovery phase.
This chart setup can be traded with leverage. Traders can use 3-5X leverage with very low risk. Spot traders can buy and hold and this will be one of the biggest projects in this cycle.
The pairs that moved weakly in the first bounce, 7-April, will do much better in this second jump. These pairs will also move fast and stronger compared to the ones that already moved strong between April and May.
There are many pairs and many projects. In each wave, a different set of pairs moves strong and becomes top performers. The ones that didn't move last time can move this time. Those that did move can move again but they tend to lag behind. The energy moves around the entire market and never gets stuck in one place.
Adapt and change. The market is always changing... Choose wisely.
This is a huge opportunity. It is time to trade.
Buy the bottom and hold; you will be happy with the results.
Namaste.
TONUSDT: Short the Rejection,Buy the Capitulation – A Dual-Level
📉 TONUSDT Technical Analysis – Trending in a Long-Term Descending Channel, Is the Ideal Short Entry Coming?
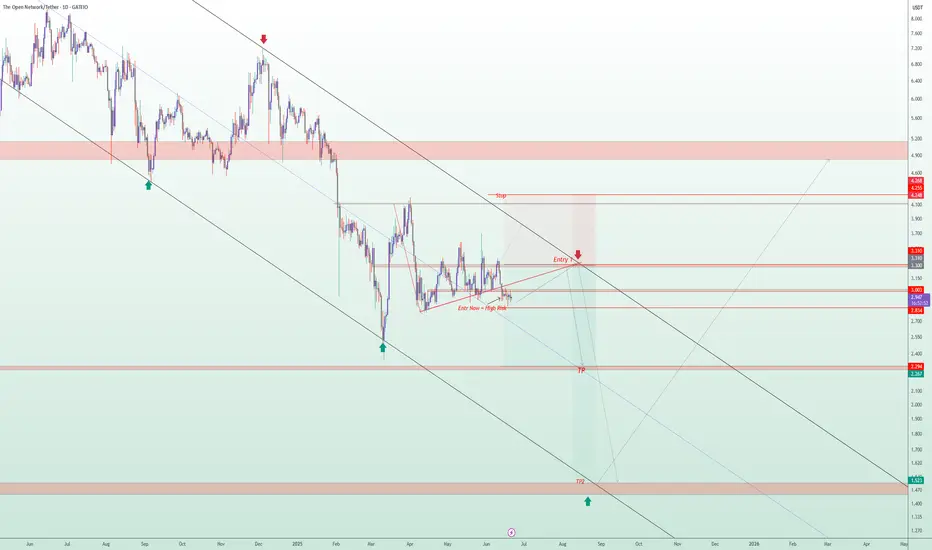
TONUSDT is currently trading inside a long-term descending channel, with clear bearish momentum dominating the structure.
🔻 Scenario 1 (Early & Risky Entry):
Traders may consider opening a short position from the current level, but this setup carries higher risk, as the price could still push upward toward the upper boundary of the channel.
Stop-loss level is clearly marked on the chart.
🧭 Scenario 2 (Smarter, Low-Risk Entry):
A more calculated approach is to wait for the price to revisit the upper resistance zone of the descending channel (marked as Entry 1 on the chart).
This zone offers a clean low-risk, high-reward short opportunity, with a tight stop-loss and excellent setup.
🎯 Defined Targets in This Analysis:
Target 1: The midline of the descending channel
Target 2: The bottom of the long-term descending channel
💎 Important Insight:
If this bearish scenario completes and the price reaches the bottom of the descending channel, that zone could be a prime buying opportunity for long-term holders.
Technically, it's a major support level and psychologically, it's where smart money often steps in.
⚠️ Disclaimer:
This is not financial advice. This analysis is for educational purposes only. Always wait for confirmation and apply strict risk management when trading.
📩 What’s your opinion on this setup? Do you agree with the short plan, or see another scenario unfolding? 👇
Toncoin, Bullish On Everything; We Will WinSee (or watch), Toncoin is consolidating the higher low. I think I need to use new/different words because repeating the same words will get you bored eventually. Ok, that doesn't matter since we are talking about money right? If my analysis ends up being positive and being a money maker, then we can accept repeating the same terms over and over, what do you say?
Sounds good to me; I hope it resonates with you.
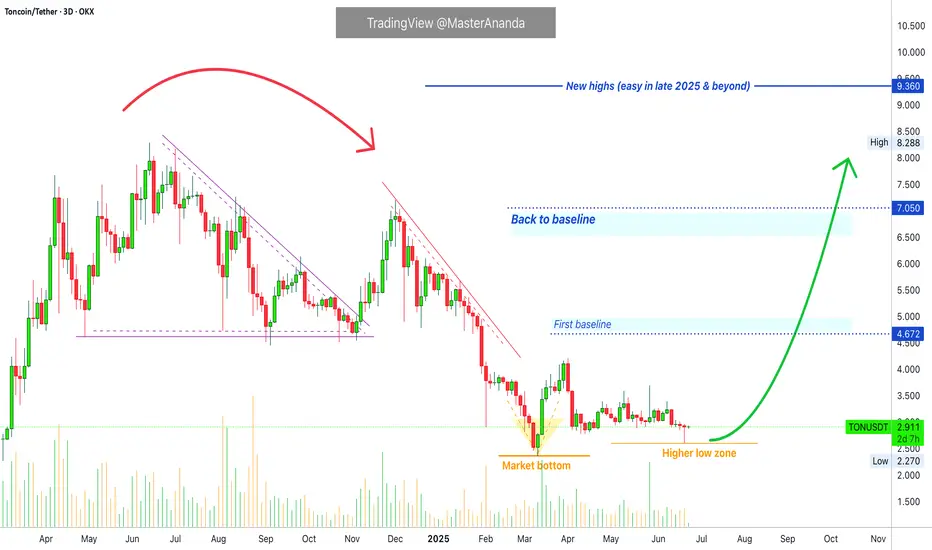
Let us see if you can grasp the situation from my perspective.
When Toncoin peaked in April/June 2024 I told you the thing was going to "go back to baseline" and produce a crash and then consolidate at the lows, etc., before a new wave of growth was possible. This is happening now but the fact that it is happening now also means that the down-wave is over.
After the bearish move comes the bullish move.
You know, this bearish move took more than a year to complete so you might not even remember when I was sharing all those bearish charts. The bullish move is the same, by the time prices go up and the market becomes bearish again, you will forget that I was telling you "it is going up," when the action was happening at bottom prices.
Technical analysis —TONUSDT
Classic price dynamics are present on the chart. The bottom is hit 11-March and there is a very strong reaction supported by high volume. Then the market goes sideways within a higher low.
That's it, this is the last consolidation at low prices before maximum growth. That's just the way it is. The market goes down, the market goes up.
It peaked more than a year ago now, June 2024. That is a long time ago specially in Crypto-terms. Once the bottom is hit, the market recovers and goes on a bullish wave.
How long will it take? 2 months? 1 week? 2 weeks?
Doesn't matter; it is coming, it is sure, it is true, it is easy, we will win.
Namaste.
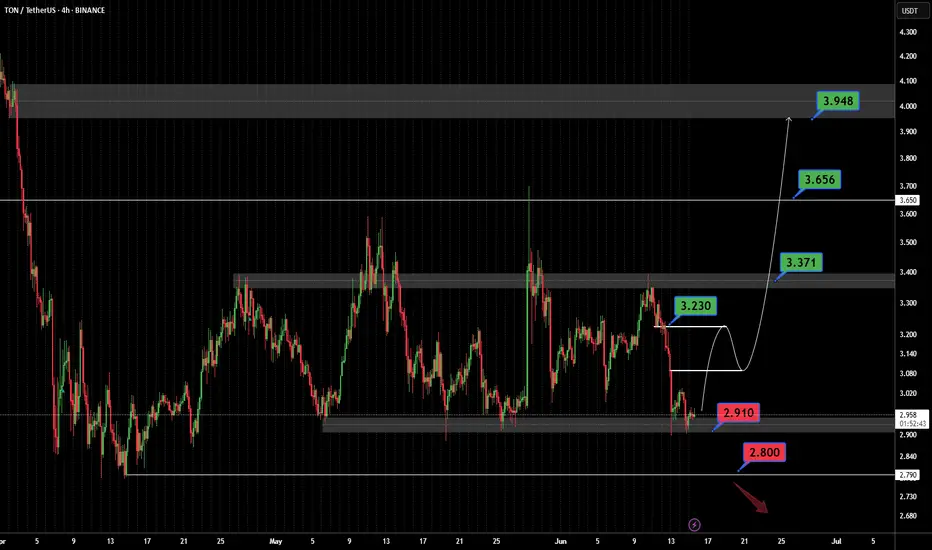
TONUSDT On the @TONUSDT chart, price is currently making a corrective move after reacting to the key support at 2.800. It may rise toward the 3.230 resistance and potentially break higher with a pullback to continue upward. However, if the 2.800 support fails, a deeper drop could follow. ⚠️📉
Resistances:
• 3.230 💥
• 3.371 🔼
• 3.656 🔼
• 3.948 🚀
Supports:
• 2.910 🛡️
• 2.800 🔻
⚠️Contorl Risk management for trades.
TradeCityPro | TON: Eyes Breakout from Daily Range Top👋 Welcome to TradeCity Pro!
In this analysis, I’m going to review the coin TON for you. The TON project is developed for Telegram and operates on a Layer One blockchain, enjoying significant popularity within the Telegram community.
✔️ The coin currently has a market cap of 7.95 billion dollars and ranks 18th on CoinMarketCap.
📅 Daily Timeframe
On the daily chart, as you can see, there’s a range box formed between the levels of 2.851 and 3.513, and price is oscillating between these two zones.
⚡️ I’ve marked the top of the box as a zone as well. This is a major supply zone, and a breakout above it could trigger a bullish trend.
🧩 Personally, I’m watching this coin closely. If buying volume enters and the trigger is activated, I’ll either enter a long position or buy it in spot.
📈 For a long position, the breakout of the 3.513 zone that I marked seems appropriate. If this zone breaks, we can open a long position.
🔍 The target for this position can be set around 4.123. This level is also a good spot trigger. If we enter a long at 3.513 and price moves up to 4.123, we can use the profit from the futures trade to buy this coin in spot.
✨ This way, we’ll have purchased a reasonable amount of the coin using profits, without needing any unusual risk or capital management because the capital was already managed beforehand.
📊 There’s also an ascending trendline visible on the chart that the price has responded to well. If the price gets rejected from the 3.513 zone and breaks this trendline, we can open a short position once the trendline trigger is activated, targeting the 3.024 and 2.851 levels.
📝 Final Thoughts
This analysis reflects our opinions and is not financial advice.
Share your thoughts in the comments, and don’t forget to share this analysis with your friends! ❤️
LIVE TRADEHello friends
Given the ascending channel that has formed, we can open positions with capital and risk management to move towards the specified goals.
*Trade safely with us*
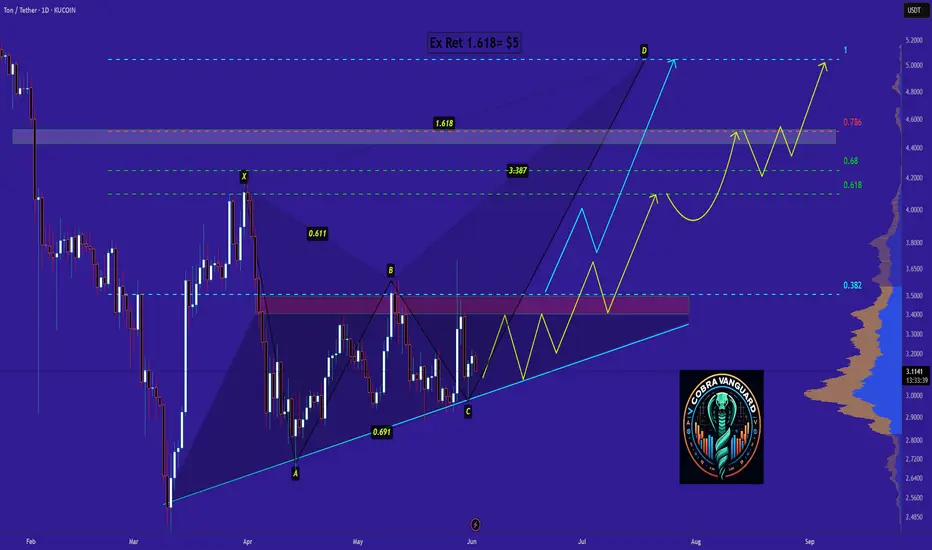
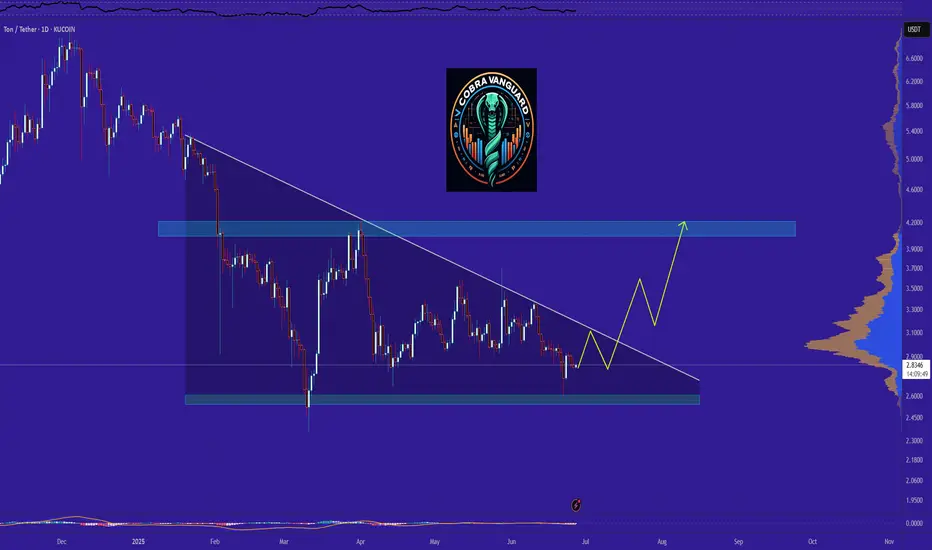
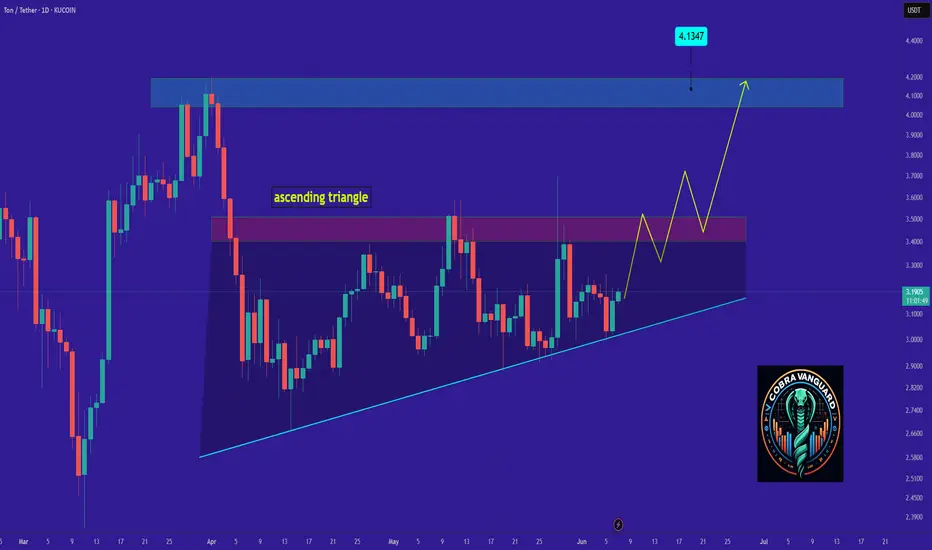
TON It will grow soon...Currently, TON is forming an ascending triangle, indicating a potential price increase. It is anticipated that the price could rise, aligning with the projected price movement (AB=CD).
However, it is crucial to wait for the triangle to break before taking any action.
Give me some energy !!
✨We spend hours finding potential opportunities and writing useful ideas, we would be happy if you support us.
Best regards CobraVanguard.💚
_ _ _ _ __ _ _ _ _ _ _ _ _ _ _ _ _ _ _ _ _ _ _ _ _ _ _ _ _ _ _ _
✅Thank you, and for more ideas, hit ❤️Like❤️ and 🌟Follow🌟!
⚠️Things can change...
The markets are always changing and even with all these signals, the market changes tend to be strong and fast!!
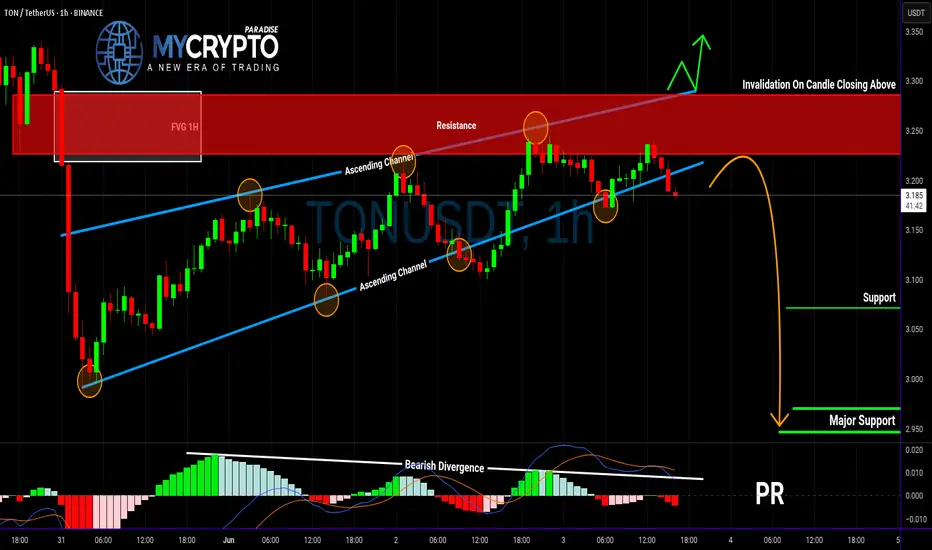
TON Looks Ready to Collapse — Is This the Start of a Bull Trap?Yello Paradisers! what if TON is about to reverse hard—are you positioned correctly, or will you be caught chasing the wrong move?
💎TONUSDT is showing clear bearish signs that can’t be ignored. The price has broken down from an ascending channel—a classic early signal of weakness. But that’s not all. This breakdown happened right at the resistance zone, and it’s backed by a clear bearish divergence on momentum indicators. Adding to the conviction, there’s a 1H Fair Value Gap (FVG) sitting right in that same region, which often acts as a magnet for price before continuation to the downside.
💎This confluence significantly increases the probability of a bearish move in the short term. So, what’s the plan?
💎For risk-averse (safe) traders, the optimal approach is to wait for a pullback and retest of the broken structure. This allows for a cleaner entry and a much better risk-to-reward (RR) ratio. For the aggressive players, there’s potential to enter with reduced size from the current level, understanding that it carries more risk without confirmation.
💎However, if the price manages to break out and closes candle above the resistance zone, this entire bearish setup becomes invalidated. In that case, the smart play is to stay patient and wait for a more favorable structure or price action to develop.
🎖If you want to be consistently profitable, you need to be extremely patient and always wait only for the best, highest probability trading opportunities.
MyCryptoParadise
iFeel the success🌴
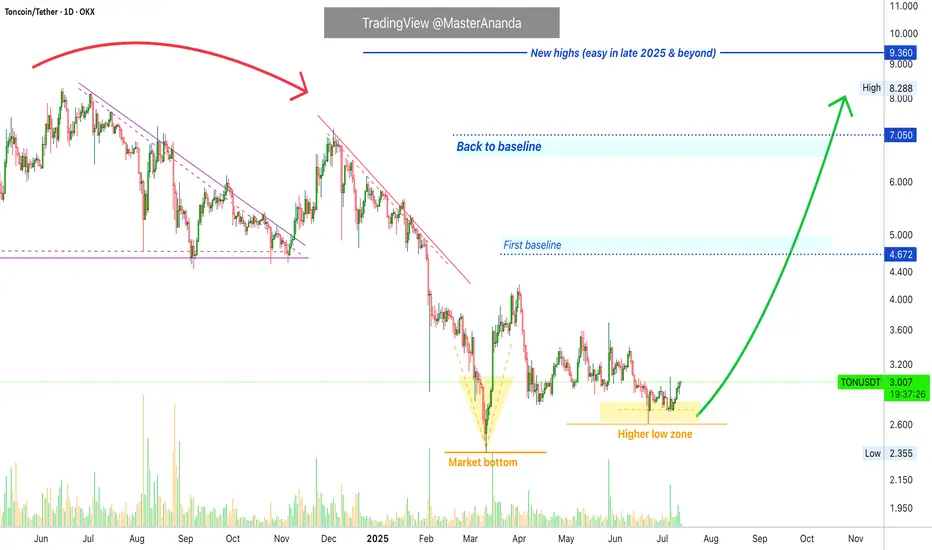
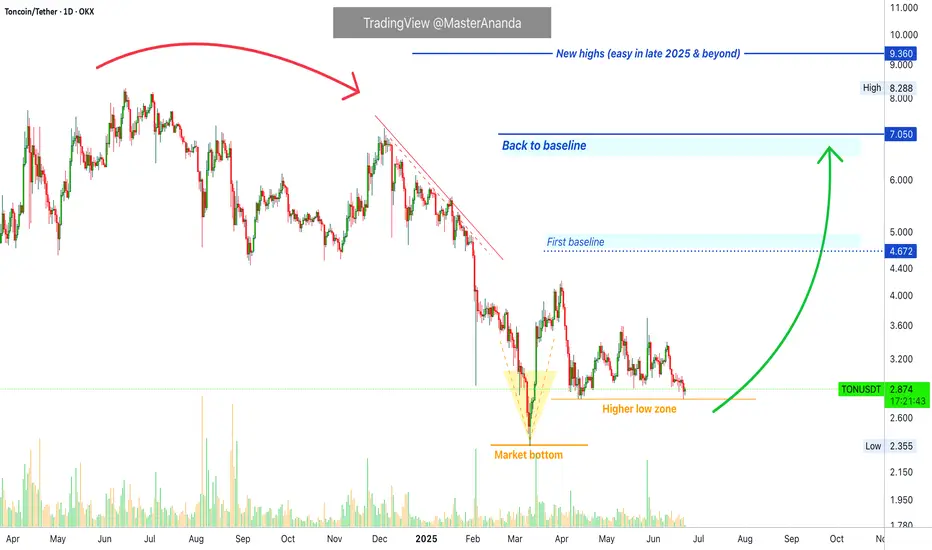
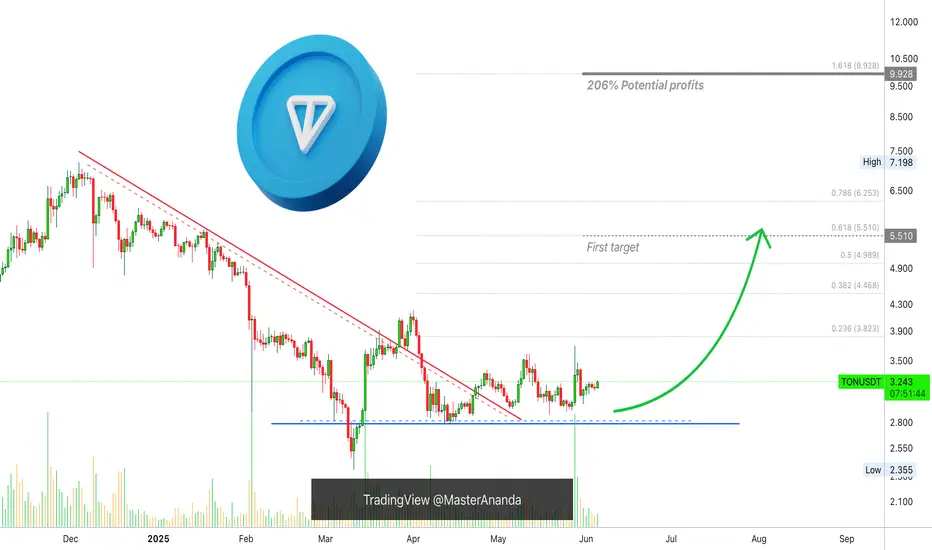
Toncoin Major Advance Now! New All-Time High Incoming (PP: 200%)Toncoin entered its current price range in February, four months ago. After some shaking, this project has been sideways and four months sideways is a very long time when it comes to Crypto, there is good news of course.
When the drop happened in March a bottom pattern was confirmed. A bottom means the bearish trend ends and the market prepares to change.
Just a few days ago, TONUSDT produced really high volume, signaling the start of a new uptrend, higher highs and higher lows.
This post is a friendly reminder just to let you know that Toncoin is about to go up and it will de so really strong.
The signals are in. Consolidation has been strong. The action is happening above support.
An advance now will be strong first, then fast, then slow followed by additional growth. I mean, the bullish action won't stop at $5.51 nor $10 ($9.92), it will continue growing, growth long-term. We are set to experience a new all-time high, the strongest bullish action in the history of Toncoin, it is starting now.
Thank you for reading.
Namaste.
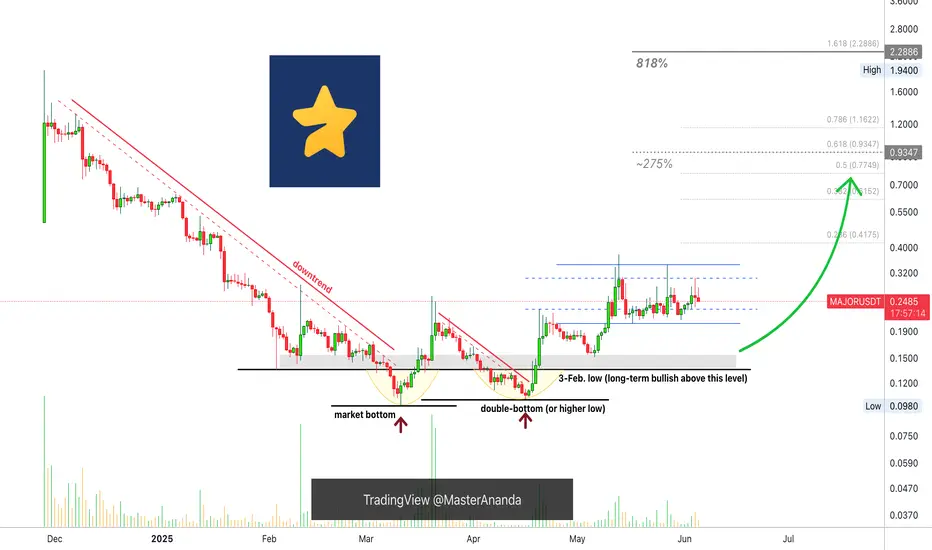
Major Enters Bullish Zone, 800%+ Profits Potential MappedSo this is a game on the TON network. It is good you called this to my attention because I love games. I don't play them but I love them, I think these are good for the Cryptocurrency market.
We are looking at MAJORUSDT, thank you for taking the time to read.
It is my pleasure to write for you and I am always grateful for your continued support... Let's read the chart.
There is high volume on the chart, twice. After 3-February and after mid-March. In both instances the high volume happened on green candles. It is an early reversal signal.
MAJORUSDT was moving down, a downtrend; this is when the candles were producing lower highs and lower lows. 11-March 2025 comes the bottom and the downtrend ends. The end of the downtrend is good news, this market is no longer bearish, it goes from bearish to sideways.
The initial recovery, small, peaks 20-March after 165% growth. Then comes the first retrace and the pair is bullish and strong because it ends in a higher low. 7-April of course, when the entire altcoins market bottomed. This higher low is a technical double-bottom. From this point on, instead of the initial breakout and sideways, we have the start of a bullish wave.
MAJORUSDT starts to grow and now it is up. Current action is happening 153% higher compared to March low, the market bottom.
After some higher highs and higher lows, MAJORUSDT is now sideways again, consolidating but this time bullish, building strength before the next bullish jump. So we can expect some more sideways, with some swings followed by additional growth. You can find two nice targets on the chart.
» The first target sits at $0.9347 for 275% profits potential, the second goes beyond 800%.
I love you.
Thanks a lot.
Your support is appreciated.
Namaste.
TON AB=CD Analysis !!!Currently, TON is forming an ascending triangle, indicating a potential price increase. It is anticipated that the price could rise, aligning with the projected price movement (AB=CD).
However, it is crucial to wait for the triangle to break before taking any action.
Best regards CobraVanguard.💚