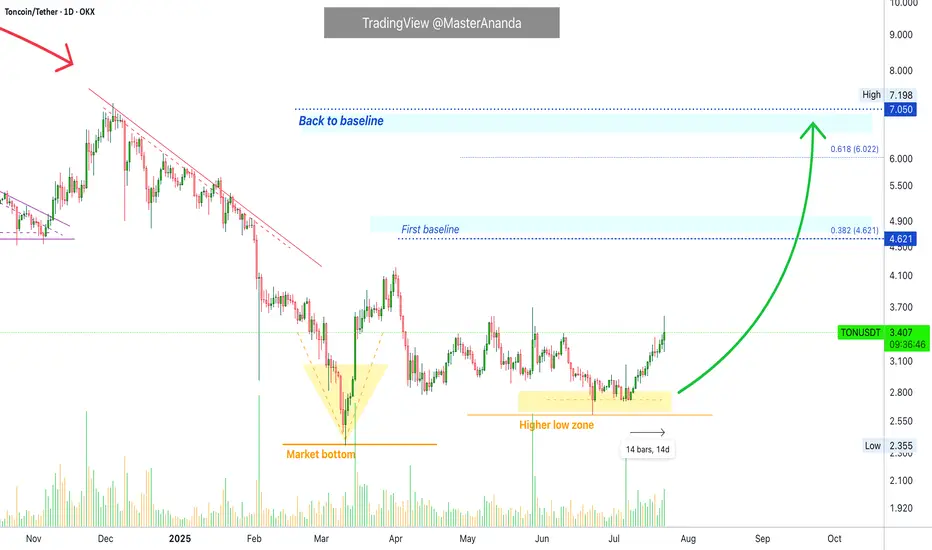
Toncoin TON price analysis💎 CRYPTOCAP:TON didn’t become a legend over the past 9 months — but at least our correction target of $2.30–2.50 played out with precision.
While most of the crypto market is currently going through a correction, #Toncoin keeps pushing upward. Still, we remain realistic:
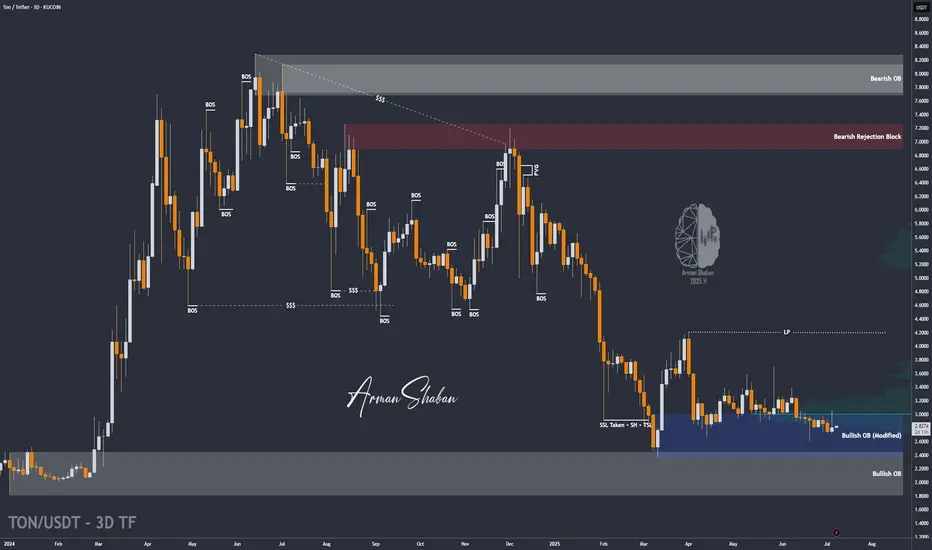
🎯 First target: $5.40–5.80
🎯 Second target: $8.00–8.20
🚀 It’s not a “to the moon” scenario, but a potential 2x–3x from current levels is attractive.
The key support level OKX:TONUSDT remains at $3.00 — as long as it holds, the bullish trend remains valid.
Toncoin
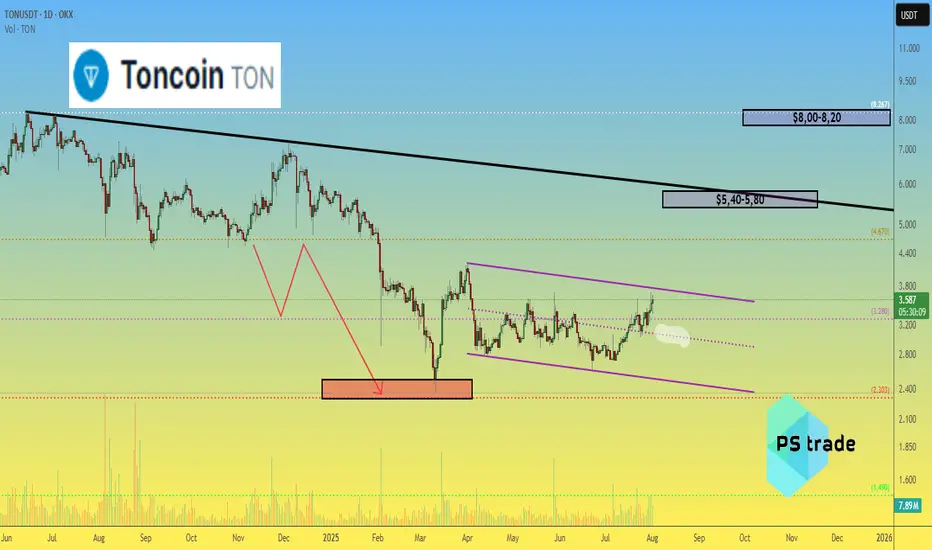
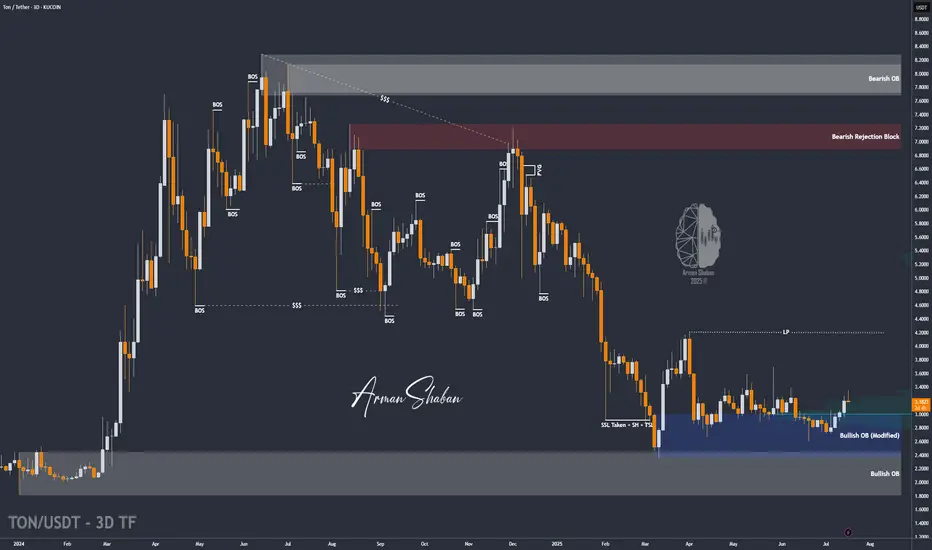
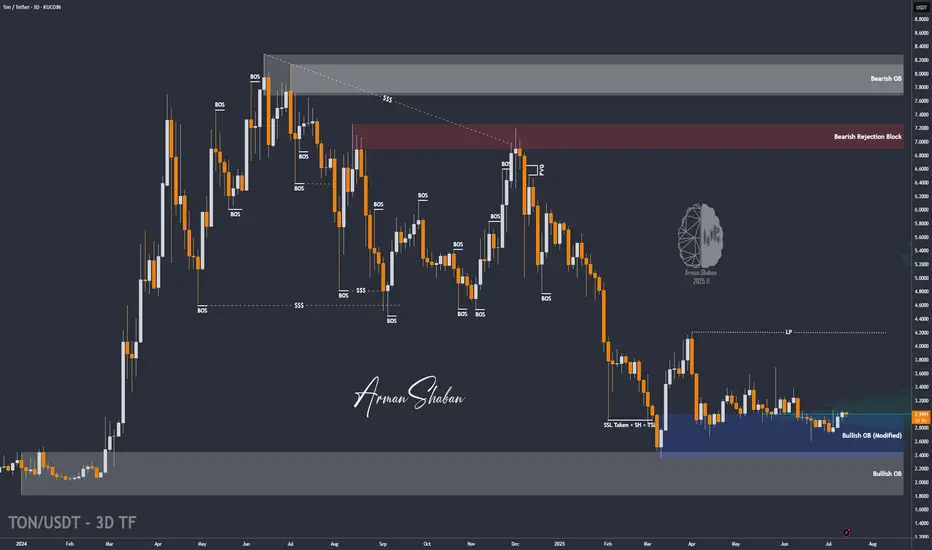
TON/USDT | Surges 18% – Eyes on $3.63, Then $4.20 and $4.68!By analyzing the Toncoin chart on the 3-day timeframe, we can see that after a pullback to the $3 area, strong demand kicked in, and within just one week, the price surged over 18%, reaching above $3.5. Toncoin is currently trading around $3.53, and I expect it to hit the $3.63 target soon. The next bullish targets after that are $4.20 and $4.68.
Please support me with your likes and comments to motivate me to share more analysis with you and share your opinion about the possible trend of this chart with me !
Best Regards , Arman Shaban
Toncoin Goes Bullish · 4X Leverage · Bottom Prices · OpportunityToncoin is breaking the sideways consolidation pattern. Today we have the highest price since late May, already two months ago, and rising volume. When you see how flat the action at the bottom is, you can tell how strong the bullish breakout that follows will me.
This is a friendly reminder because Toncoin will be huge in this altcoins market bullish cycle. I want you want you to be in, I want you to collect big projects, 1,000%+. That is why I am reminding you now. This trade setup can be approached both with leverage and spot, both options will do great.
After years of bearish action and months of consolidation, Toncoin is ready and the recovery is happening slowly but surely. Prices are rising slowly, no new lows. Prices are moving sideways but knowing the bottom is in the only logical conclusion is a break up. It is on the chart. It is inevitable, it is confirmed; profits and success.
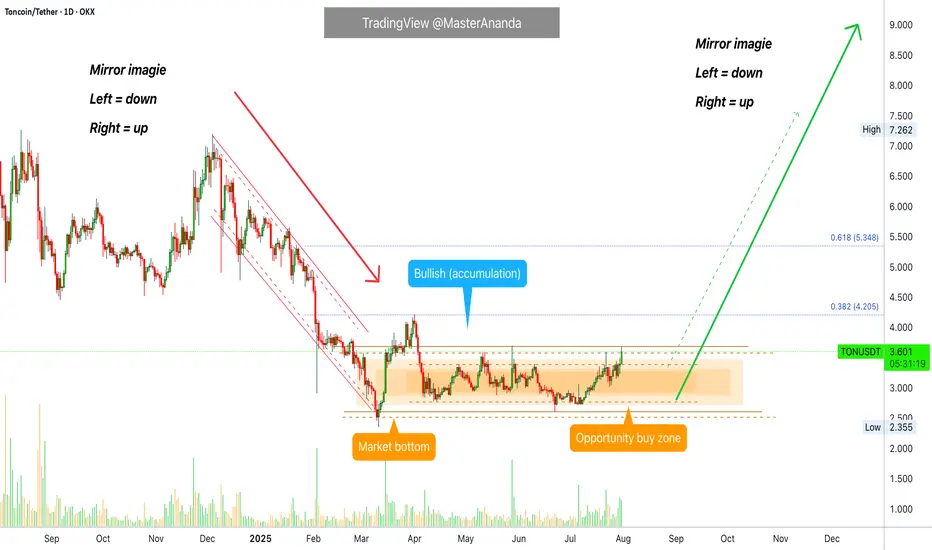
Timing is really essential when trading. If you can get the right entry timing, a great price, trading becomes easy long-term. Once the bullish move shows up, you will be happy sitting in a strong position that only grows. That is because you bought the bottom. We are still looking at bottom prices, the last chance at the "opportunity buy zone."
We are doing 4X but we have positions with higher leverage from where prices were lower. You need to decide your own risk tolerance. If in doubt, zero leverage please. Only when you are 100% certain and you accept the full risk. The full risk is the liquidation of your position, all money gone. Are you ready to lose everything? If you are, better start trading spot. The chances of losing are very low. If prices drop, you get to pick a small paper loss and nothing more. Your number of altcoins stay the same. When the market starts to move, your money grows and the paper loss turns into a gain. You can't lose if you don't sell when prices are down. Buy when prices are low. Hold strong through the bullish wave. The time to buy is now. Buy and hold. You will be happy with the results.
Namaste.
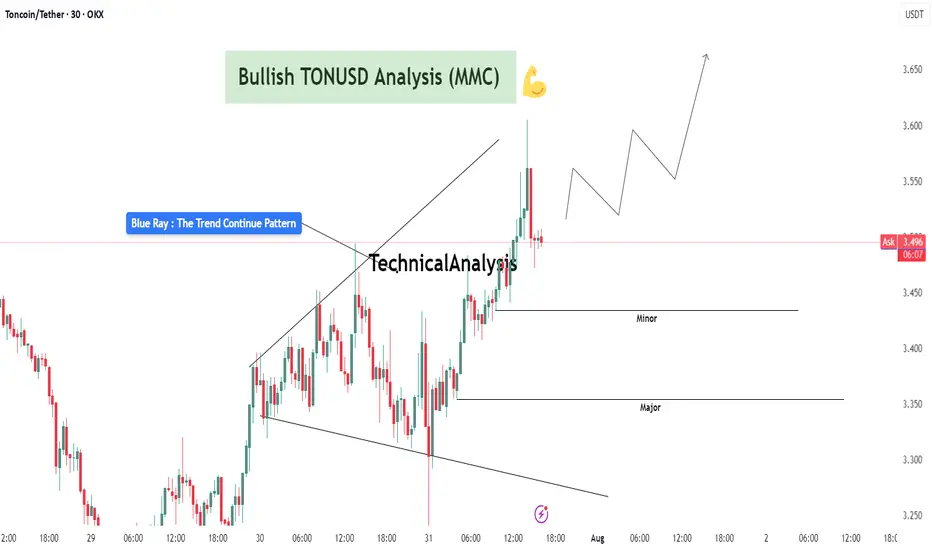
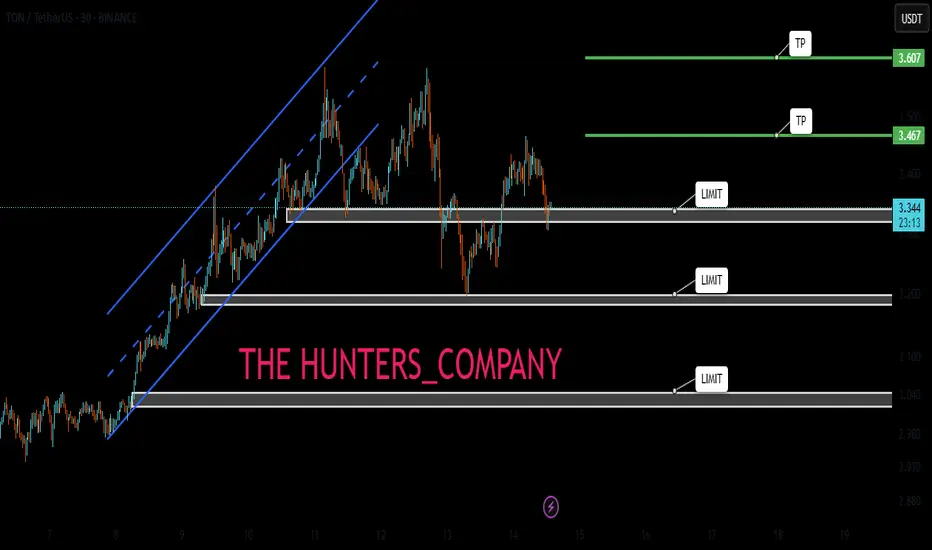
TONUSDT Analysis : Bullish Setup Breakout – Advanced MMC Analyze“Blue Ray Pattern Breakout Confirms Bullish Trend Continuation”
The 30-minute chart of TONUSDT highlights a clean and structured bullish setup based on the MMC (Mirror Market Concepts) methodology. The price action exhibits disciplined market behavior, respecting structural levels, breakout dynamics, and volume-based reactions.
🔷 1. Blue Ray Pattern – Trend Continuation Phase
This chart begins with the formation of the Blue Ray, a visual representation of trend consolidation and energy buildup. This pattern functions as a trend continuation flag or wedge. Prices compressed within a narrowing range, forming higher lows and lower highs, signaling accumulation under buyer control.
Once the pattern matured, we witnessed a decisive bullish breakout, where the price closed above resistance with conviction. This event marked a clear market intention shift and established a new impulsive leg.
🔍 2. Breakout Confirmation and Follow-Through
Post-breakout, TONUSDT experienced:
High-volume candles with elongated bodies, indicating increased buyer participation.
Immediate upside momentum that pushed the asset into a short-term overextended condition – often a healthy sign of strength when followed by a controlled pullback.
The breakout wasn’t just a false move – it was sustained, and the price held above the broken structure, proving that supply was absorbed and buyers were dominant.
🔑 3. Demand Zones (Minor and Major)
Two key MMC demand zones are highlighted:
🔹 Minor Demand Zone (~3.43–3.45):
This is the most immediate support and current price is hovering just above it. It's the first zone of interest for buyers and may serve as a re-entry or scaling point.
🔸 Major Demand Zone (~3.34–3.36):
In case of deeper retracement or volatility, this zone is expected to act as a strong bounce region based on past structure and MMC’s reversal logic. Price memory here suggests accumulation or reactive interest.
📐 4. Structure, Momentum, and Higher Timeframe Confluence
TONUSDT is in a confirmed uptrend, forming a clear sequence of higher highs and higher lows.
The structure supports a bullish flag breakout with minimal overhead resistance.
The projected path drawn on the chart illustrates a stair-stepping price pattern with continuation toward 3.60–3.70, if current levels hold.
📊 5. MMC Strategy Bias – Bullish
Using the MMC lens:
Blue Ray breakout confirms continuation
Volume absorption succeeded at the base of the flag
No signs of dominant supply entering post-breakout
Wave projection supports ongoing momentum
Structure favors buying dips, not shorting spikes
💡 Trader’s Takeaway:
TONUSDT is providing a textbook bullish opportunity under the MMC framework. As long as price stays above the Minor Demand Zone, continuation upward toward 3.60 and beyond remains in play. If price dips to the Major Zone, watch for strong buyer reactions for fresh entries.
Ideal for MMC traders and technical analysts looking to align with structured, logic-based entries and exits. This setup reflects market strength, technical clarity, and volume confirmation – a powerful trio for continuation plays.
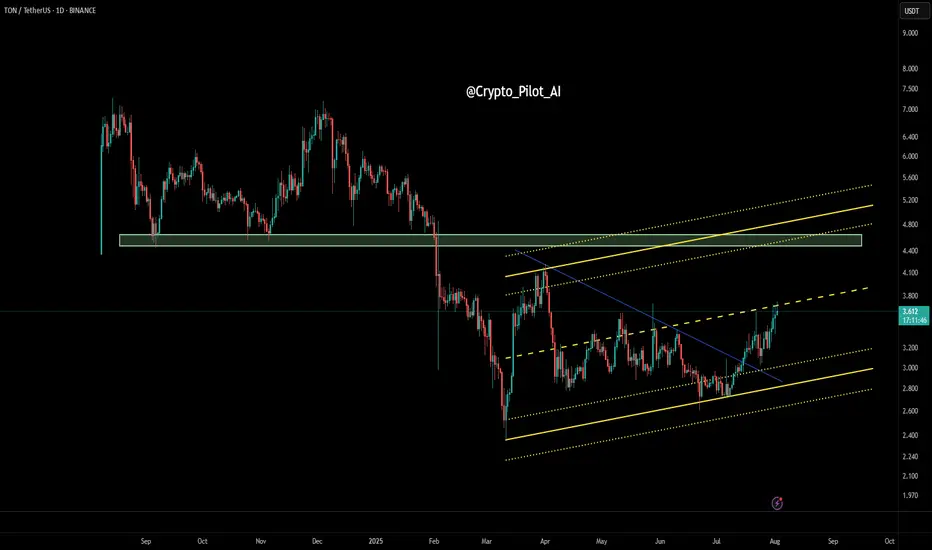
TON/USDT – Daily Price Action Analysis🔹 Price has broken a major descending trendline and entered an ascending channel.
🔹 Currently testing the mid-range resistance zone around $3.60 – $3.70.
🔹 If buyers hold above this area, the next targets could be $4.40 – $4.80.
🔹 If rejected, key supports are at $3.20 and $2.90.
TONUSDT Bullish Reversal from Demand with QFL Base | MMC Setup📊 Technical Breakdown – 4H Chart
✅ Overview
TON/USDT is exhibiting early signs of a bullish reversal after a structured decline into a key smart money demand zone. The setup reflects multiple layers of confirmation—QFL base, multi-supply absorption, liquidity inefficiencies, and a positive reversal pattern—suggesting a high-probability opportunity for upside.
🔹 1. Impulsive Move & Liquidity Sweep
Price rallied aggressively on July 22–23, pushing toward $3.60, breaking short-term highs and triggering liquidity grabs above recent consolidation zones.
This surge absorbed significant buy-side liquidity, leaving a supply zone behind, now marked as the Next Reversal Zone.
After liquidity was collected and orders filled, the market reversed sharply, consistent with institutional profit-taking or engineered liquidation traps.
🧠 Smart Money Insight: Institutions often push price into illiquid zones (above highs) to trap retail and fill large orders. This marks the first phase of the trap.
🔻 2. QFL Base and Multi-Supply Absorption
The price structure created a Quick Flip Level (QFL) — a smart money concept where price forms a base, drops, then rallies, leaving behind an institutional demand zone.
The current pullback has revisited this exact QFL base, now reinforced by 3x supply absorption, enhancing the zone's strength.
This confluence increases the probability of a strong reaction to the upside from this level.
📌 Note: The “If Cross 3x Supply” label shows that this zone has absorbed multiple attempts to break down. It's now acting as a demand pocket.
🔄 3. Reversal Area – The Engine Room of Smart Money
The Reversal Area is carefully marked at $3.20–$3.28 — the ideal discounted price zone where large buyers tend to step in.
This zone is structurally important:
Past breakout level
Aligned with QFL base
Beneath stop levels of breakout traders
A Positive Pattern has now formed within this area—likely a bullish engulfing, morning star, or pin bar, depending on candle confirmation.
📌 Psychology: This zone acts as a trap. Retail traders often panic sell here, while smart money accumulates quietly before launching price upward again.
🧭 4. Dual Scenario Structure – Projected Paths
You’ve beautifully mapped two valid future price scenarios based on reaction to the Central Reversal Zone (~$3.35):
🔵 Scenario 1 – Healthy Pullback Before Continuation
Price climbs toward the central zone, then pulls back slightly to retest support near $3.28–$3.30 (label 1).
This allows further accumulation before price breaks higher.
This is a safer re-entry scenario for patient traders looking for a retest.
🟢 Scenario 2 – Direct Impulsive Rally to Next Reversal Zone
Price continues with bullish momentum, slicing through $3.35 and aiming for the Next Reversal Zone at $3.52–$3.60 (label 2).
This zone contains remaining liquidity, left uncollected from the previous impulse.
Price is likely to reverse or pause at this level again due to heavy supply.
📌 Key Tip: If price reaches that zone without significant resistance or exhaustion, it may signal continuation potential with minor corrections.
💼 Strategic Trade Plan (High-Probability Setup)
Entry Zone: $3.20 – $3.28 (Reversal Area)
Stop-Loss: Below $3.15 (beneath structure + QFL base invalidation)
Target 1: $3.35 (Central Reversal Zone)
Target 2: $3.52–$3.60 (Liquidity Completion & Next Reversal Zone)
🧮 Risk-Reward Estimate:
Conservative: 1:1.8
Aggressive: 1:2.5 or better if price reaches high liquidity zone.
🔄 MMC Flow Summary – What the Market Makers Are Doing:
Create a trap at the top (collect liquidity and fake the trend)
Force price down into demand (scare retail + grab stops)
Absorb sell orders in bulk at QFL/demand zone
Form bullish reversal pattern (positive structure)
Push price upward again, aiming for uncollected liquidity above
📌 This is a classic MMC cycle — engineered by large players, and now you’re aligned with their strategy.
🧠 Why This Matters
This chart isn’t just about entry and exit; it’s about understanding the underlying psychology and structure. By aligning with the smart money footprint — QFL, supply absorption, and liquidity targeting — you're maximizing edge and minimizing guesswork.

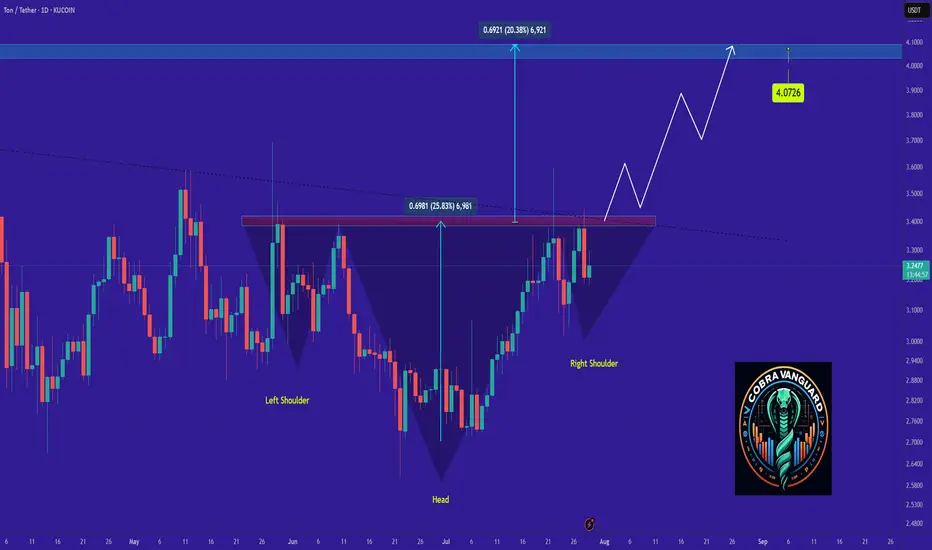
we shall see a good amount of increase in TON price !It seems the price is forming a head and shoulders pattern, which, if correct, suggests a good price increase in the coming days. However, we should wait for the pattern to fully complete.
Best regards CobraVanguard.💚
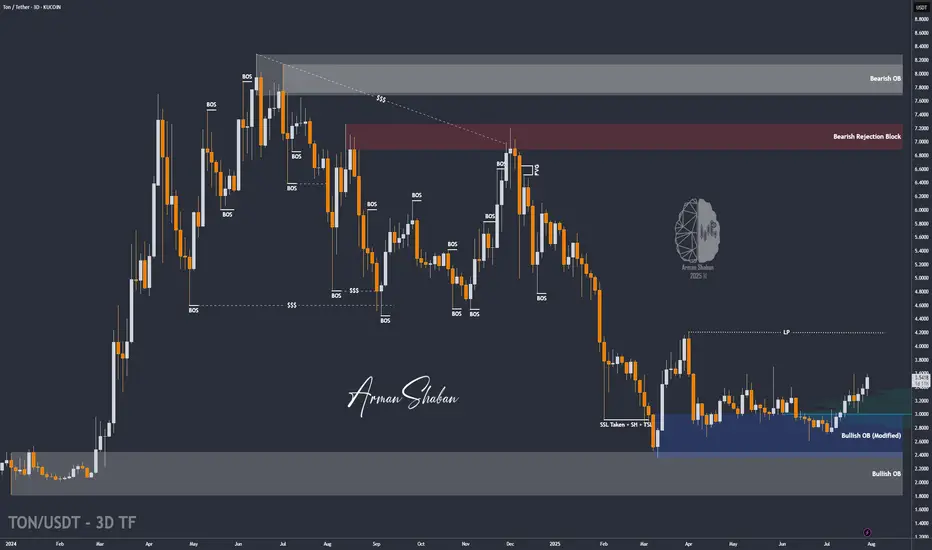
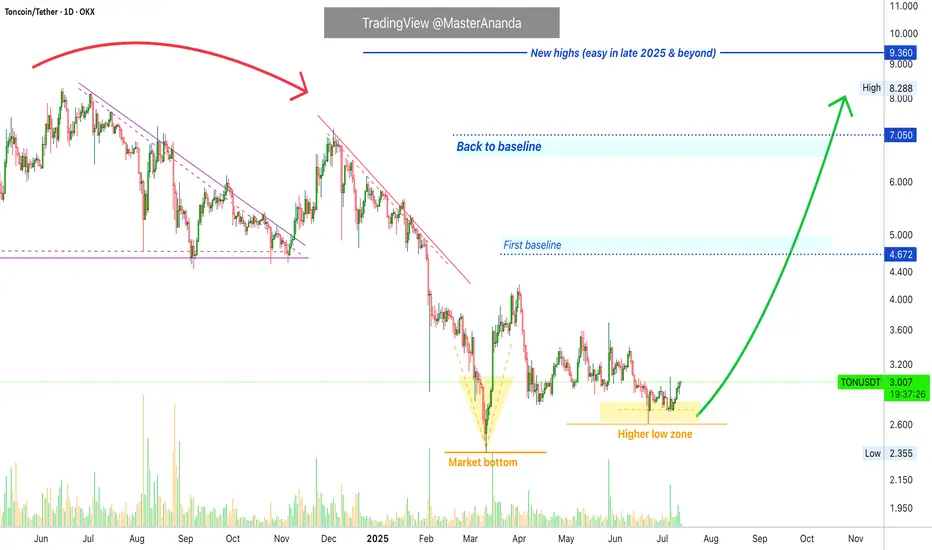
TONUSDT Breaks Out of Bearish Grip! Is a Bullish Rally?🔎 1. Key Pattern: Descending Trendline Breakout + Reaccumulation Zone
After months of downward pressure, TONUSDT has successfully broken above a dominant descending trendline that has been acting as resistance since December 2024.
✅ This breakout occurred with a strong bullish candle and aligns perfectly with a significant historical resistance zone (around $3.00–$3.12).
📌 The area also overlaps with the Fibonacci retracement levels (0.5–0.618) — a zone where trend reversals often occur.
This indicates that the move isn't just noise — it might be the start of a mid-term bullish trend.
---
🧱 2. Consolidation Box = Reaccumulation Zone
TONUSDT spent nearly 4 months ranging sideways between $2.80 and $3.20, forming a clear reaccumulation range.
🔁 This kind of price action often precedes a strong breakout, as smart money accumulates before the next leg up.
🟨 This box now acts as a critical demand/support zone for any potential pullbacks.
---
📏 3. Key Levels to Watch (Support & Resistance)
✅ Bullish Targets (Resistance Levels):
🔹 $3.5404 → Immediate resistance
🔹 $4.0492 → Major resistance to break
🔹 $4.6460
🔹 $5.1961
🔹 $5.9429
🔹 $6.9065
🔹 Local High: $7.2311
🔻 Support Levels:
🔸 $3.1248 – $3.0099 → Key Fibonacci support (0.5–0.618)
🔸 $2.8000 → Bottom of reaccumulation range
🔸 $2.3290 → Major support (also the cycle low)
---
📈 Bullish Scenario (Primary Bias)
If price holds above the key zone at $3.00–$3.12, we could see:
A move towards $3.54 USDT
Breakout above $3.54 opens the door to $4.05 → $4.64 → $5.19 and beyond
A clear structure of higher highs and higher lows confirms trend reversal
Momentum remains strong as long as price respects the breakout zone.
---
📉 Bearish Scenario (Alternative Case to Watch)
If price fails to hold above $3.00 and breaks back below $2.80:
This would suggest a false breakout
Momentum may shift bearish again
Price could revisit the $2.32 support, negating the bullish setup
A return to sideways or even downtrend structure is possible
---
🧩 Strategic Conclusion
TONUSDT has broken out of a key descending trendline and reclaimed a strong structural zone, indicating early signs of a bullish cycle.
📊 Key Levels to Monitor Closely:
Support (validation zone): $3.00–$3.12
Immediate resistance: $3.54
Mid-term targets: $4.05 → $5.19 and higher
> As long as TON stays above the golden zone (Fibonacci 0.5–0.618), bulls have the upper hand.
---
📘 Pro Tips for Traders:
Watch for volume confirmation during retests
Be patient for pullback entries or breakout confirmations
Manage risk — don’t FOMO blindly
#TONUSDT #TONCOIN #CryptoBreakout #AltcoinAnalysis #TechnicalAnalysis #CryptoTrading #TON #Reaccumulation #BreakoutSetup #FibonacciSupport #BullishReversal #TONBullish

TON/USDT - Bullish Channel in H4 (27.07.2025)The TON/USDT pair on the H4 timeframe presents a Potential Buying Opportunity due to a recent Formation of a Bullish Channel Pattern. This suggests a shift in momentum towards the upside and a higher likelihood of further advances in the coming Days.
Possible Long Trade:
Entry: Consider Entering A Long Position around Trendline Of The Pattern.
Target Levels:
1st Resistance – 3.770
2nd Resistance – 3.989
🎁 Please hit the like button and
🎁 Leave a comment to support for My Post !
Your likes and comments are incredibly motivating and will encourage me to share more analysis with you.
Best Regards, KABHI_TA_TRADING
Thank you.

TONUSD TONUSDT TONCOIN mid- to long-termIn my view, we are still in the accumulation phase. The current price action and reactions at key levels suggest ongoing accumulation.
🔻 Bearish Scenarios:
In the short term, a retest of the lower boundary of the accumulation zone (purple box) is possible if the market weakens.
The worst-case scenario would be a move down to the lower green support zone, which has historically triggered strong bullish reactions. This is a critical demand area.
🔼 Bullish Scenarios:
A confirmed breakout and hold above the white line (within the purple box) would signal strength and a potential move higher.
We would then likely see a retest of the upper boundary of the accumulation zone.
A breakout and consolidation above the yellow line would open the door for a move toward the wider yellow channel, which could act as a final target zone
🚨 High-Risk Zone:
The yellow channel might represent the final phase of the current move.
From there, we could see either a sharp correction
Or, if trend strength and macro conditions allow, a continuation towards a new ATH (purple line).
📌 📌 📌 :
All marked lines and zones represent key support and resistance levels.
Price reaction at these areas will be crucial for decision-making.
As always, risk management and trend confirmation are essential.
Toncoin Update · A Closer Look · Major Move in the MakingConsider this, Toncoin has been growing steadily for fourteen days straight. The growth is slow, steady and patterned, but it keeps on happening. Notice no strong sudden jump but still, straight up. This is how the bottom is missed.
At times, we buy and we are waiting for a sudden jump but this almost never happens. The way it works, in a bull market, we get a long drawn out build-up of bullish momentum. After weeks, or sometimes even months, of prices slowly rising, then we get the sudden jump. This is to say that we are getting close.
Toncoin will continue in this pattern for days, can be weeks or even months; but at one point, there will be a major advance producing such amazing growth. Consider Bitcoin Cash on the daily timeframe for an example.
There is one more thing we need to do but I will leave this for a different publication. We need to consider the true all-time high potential.
As you might be aware, we've been looking together at "conservative" and "easy" targets for the next high and bullish wave, we are leaving this approach behind. Now it is wise for us to consider 'true' potential, 'optimistic' and 'real' targets, the highest possible, etc. So we are going to be looking at how far up Toncoin can go in the coming years and months.
Your support is highly appreciated.
The action now indicates that a major move is in the cards for this pair. If you want to catch one of those waves where you see +100% or +200% within weeks, you can sit on your TON tokens, this will be it.
It is going to happen but keep in mind that patience is key.
After you buy you hold, wait long and the market takes care of the rest. The wait is worth it when you consider the amazing profits and results that can be achieved. You deserve the best.
Keep going; keep in insisting; keep trying, keep learning, keep pushing, keep growing. We are going to achieve our goals. If you stay around long enough, the market will give you exactly what you want.
Money? peace of mind? More time to do the things you like?
Not having to leave your home to work? It is possible with Crypto.
Thanks a lot for your support.
Namaste.
TON - Time to buy again! (Update)The price has broken the wedge pattern, which means it can easily reach its previous high or even go higher.
Best regards CobraVanguard.💚
PREVIOUS ANALYSIS

TON/USDT | Another Bullish Move Ahead? (READ THE CAPTION)By analyzing the Toncoin chart on the 3-day timeframe, we can see that, as per yesterday’s analysis, the price climbed to $3.36 before facing a slight correction — which is perfectly normal since every strong bullish trend needs a healthy pullback. The $3.05–$3.20 zone could serve as a good accumulation area for buyers, and we may soon witness another impressive rally from Toncoin! Based on the previous analysis, the next targets are $3.63, $4.20, and $4.68.
Please support me with your likes and comments to motivate me to share more analysis with you and share your opinion about the possible trend of this chart with me !
Best Regards , Arman Shaban
TON/USDT : Get Ready for a new Rally! (READ THE CAPTION)By analyzing the Toncoin chart on the 3-day timeframe, we can see that the price has finally managed to grow over 3% as expected, and is currently consolidating above the $3 level. We’ll have to see how far this bullish momentum can continue — but to be honest, I expected a stronger move considering the market rally and Bitcoin repeatedly hitting new ATHs. Still, no worries — once Bitcoin takes a breather, altcoins will likely begin their powerful runs! Based on previous analysis, the next targets are $3.15, $3.63, $4.20, and $4.68 respectively.
Please support me with your likes and comments to motivate me to share more analysis with you and share your opinion about the possible trend of this chart with me !
Best Regards , Arman Shaban
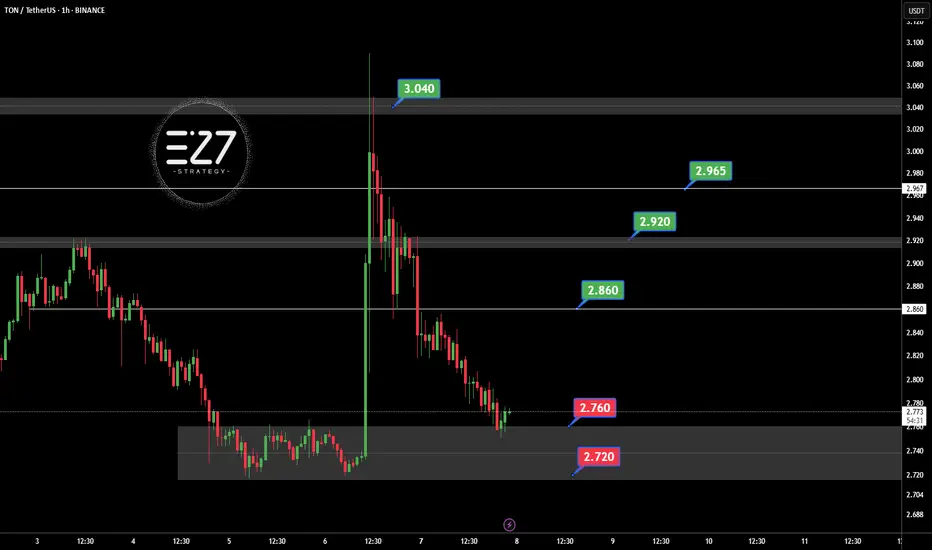
TONUSDT Following the official denial by UAE authorities regarding the possibility of obtaining a golden visa through staking OKX:TONUSDT , the bullish momentum driven by that rumor has faded. Selling pressure has increased, and TON is now consolidating within the key support zone of 2.720 to 2.760 USDT. If this support breaks, further downside is likely. However, if the price holds and reclaims the 2.860 USDT resistance, it could trigger a recovery toward 2.920 and 2.965 USDT. For now, the market sentiment remains bearish with a corrective bias.
Key Points:
UAE officially denied TON-based golden visa claims, weakening sentiment.
Current support zone: 2.720–2.760 USDT.
Key resistance: 2.860 USDT, then 2.920 USDT.
Break below 2.720 = further decline.
Break above 2.860 = potential bullish reversal.
⚠️ Please Control Risk Management in trades.
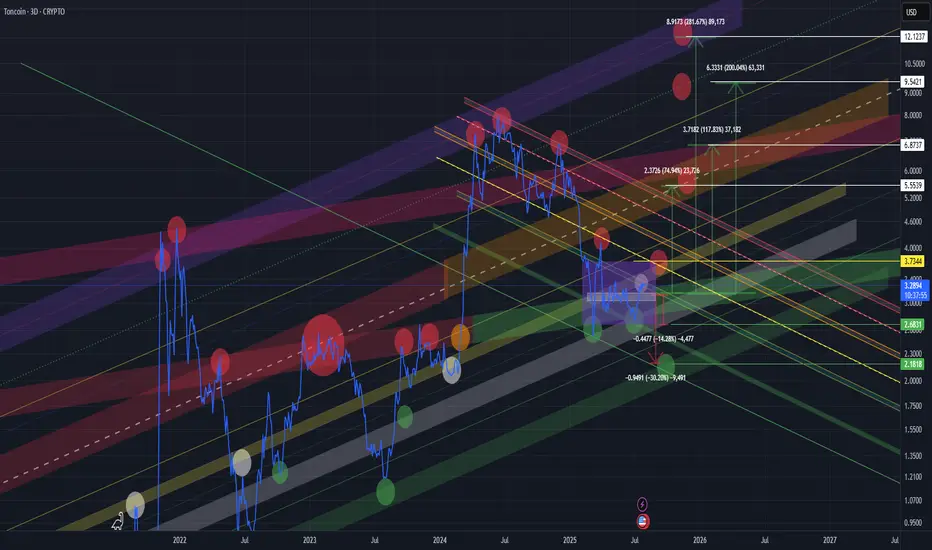
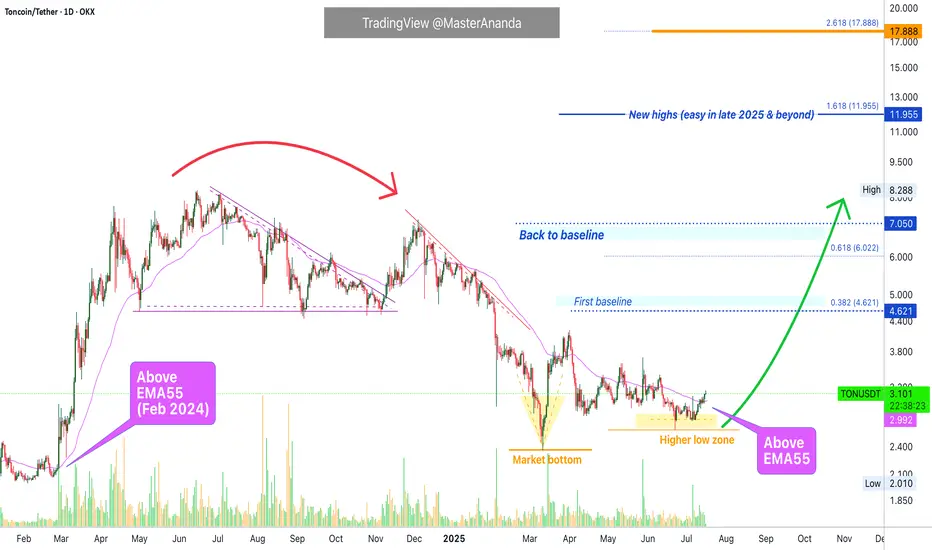
Toncoin Update v2.0 · How To Trade For Maximum ProfitsI am keeping the same chart drawings for simplicity. We continue to move forward on Toncoin and this is one of the trio we track and trade: Notcoin, Toncoin & Dogs.
Daily TONUSDT is now trading above EMA55. When this happened back in February 2024 Toncoin produced its biggest advance ever. The same is likely to repeat multiplied by ten.
(I just updated the targets for your convenience. $12 & $18 have been added to the chart.)
» July 2024 TONUSDT moves daily above EMA55.
» EMA89 is now sitting at $3.10. This resistance level is also about to be conquered. This simply means that the bullish bias is fully confirmed.
» MA200 is still a bit further away but once TONUSDT moves above this level, currently at $3.59, we can expect long-term growth. That is, six months or more. Can be 8, 9, 12, 14, 16, etc. Just beyond six.
"Toncoin will move straight up," this is just a way of saying things. There will always be some days red, some days green, some red some green but the trend, tendency and bias is bullish.
When you see prices rising and you start to enjoying higher profits do not be scared by sudden drops. These are shakeouts and only meant to scare you. Hold strong.
Toncoin can turn red 2 days, 3 days, even 6 days or 9 days and still remain 100% bullish and as soon as the retrace ends you will get additional growth.
It is all fine and great in the Crypto market.
Thanks a lot for your continued support.
Namaste.
Today's signal is TONHello friends
Given the price growth after reaching resistance, it has entered a correction, which provides a good opportunity to buy in stages and with capital management and move to the specified targets.
*Trade safely with us*
TON It will grow soon...So if you pay attention to the TON chart you can see that the price has formed a Ascending wedge which means it is expected to price move as equal as the measured price movement.( AB=CD )
NOTE: wait for break of the WEDGE .
Best regards CobraVanguard.💚

TradeCityPro | TON Eyes Breakout After Support Zone Rebound👋 Welcome to TradeCity Pro!
In this analysis, I want to review the TON coin for you — one of the popular coins owned by Telegram, currently ranked 20 on CoinMarketCap with a market cap of 7.51 billion dollars.
📅 Daily timeframe
In the daily timeframe, unlike other coins that have already broken their highs and are moving upward, this coin hasn’t yet reached its top and has just been supported from the bottom of its range box.
✔️ A Maker Buyer zone has formed between the 2.725 and 2.519 levels, which is the main support zone for this coin, and the price has been supported from this area and is now moving upward.
📈 The trigger confirming this support was the 2.927 level, and after this trigger got activated and the price consolidated, it seems the main bullish leg has now started, and the price can move toward the top of the box.
✨ If you already have a long position on this coin, I recommend holding it — especially if you have other open positions — because this move has just started, and if an uptrend forms, your entry is at a great level.
⭐ The first zone where I might take partial profits is the 3.513 top, which is a Maker Seller zone and may cause a pullback.
💥 On the other hand, if you don’t have an open position yet, the first long trigger is the break of 3.513. This level is the top of the box, and breaking it confirms the beginning of a bullish trend.
🔍 The RSI trigger and the entry of bullish momentum into the market is the break of 58.84 on this oscillator. Volume so far is well aligned with price, and if this buying volume continues to rise, we can expect sharp bullish moves from this coin.
📝 Final Thoughts
This analysis reflects our opinions and is not financial advice.
Share your thoughts in the comments, and don’t forget to share this analysis with your friends! ❤️

Toncion Update: Never Again Below $3.00 · New All-Time High NextToncoin already closed five consecutive days green as it prepares for a major advance. The last time this happened was in early April and this produced a nice jump. The difference now is that in April the market was coming out of a downtrend and the low was a major low. In June the market was in a retrace and the low is a higher low. Much difference. The next advance is very close, already here, and will produce the highest prices in more than a year, since June 2024 and of course, it will go beyond for sure, a new all-time high.
This is the last time you will see Toncoin trading at low prices before the major 2025 bull market cycle and wave. There is no limit to the upside, it is possible that in just a few days from now Toncoin will move away from $3 and never trade at this price again. That is, you will never be able to buy TON for $3.00, the price will be much higher. Do you remember Litecoin when it traded at 3 cents? What about Bitcoin at $3,000? What about Ethereum at $100? Well, Toncoin is no different. It will grow so much and so strong that we will be happy that we decided to be 100% Crypto. Risk vs reward. We accept the risk and for this reason we can enjoy an amazing reward.
Namaste.
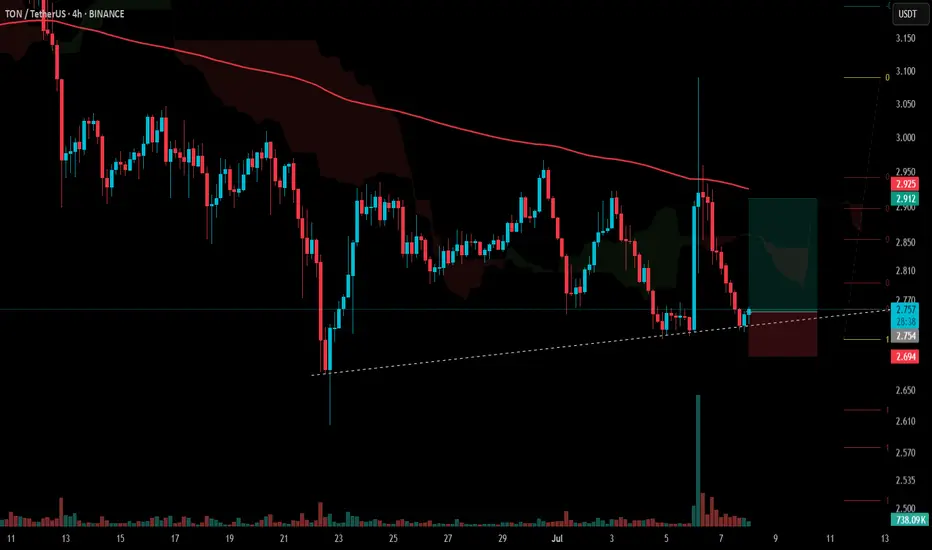
#TON Update #4 – July 8, 2025🟡 #TON Update #4 – July 8, 2025
Tonecoin has reached the area we previously marked as a potential entry zone. We’re now seeing early signs of a bounce from that level.
For this reason, I'm considering entering a trade here, with a risk-to-reward ratio of approximately 2.63.
▫️ Entry: 2.754
▫️ TP1: 2.850 (50%)
▫️ TP2: 2.910 (50%)
▫️ Stop: 2.694
❗️ I do not recommend moving the stop loss. Stick to the plan. This trade will be actively monitored and updated if necessary.
TON/USDT : TON at a Key Breakout Level – Will $3 Hold or Break?By analyzing the TON Coin chart on the 3-day timeframe, we can see that after climbing back to the $3 level, this zone has now turned into a key resistance area. The most important condition for further bullish movement is a strong breakout and confirmation above $3. If that scenario plays out, the next potential upside targets are $3.15, $3.63, $4.20, and $4.68.
⚠️ (A deeper and more detailed analysis is recommended for long-term investment considerations.)
Please support me with your likes and comments to motivate me to share more analysis with you and share your opinion about the possible trend of this chart with me !
Best Regards , Arman Shaban
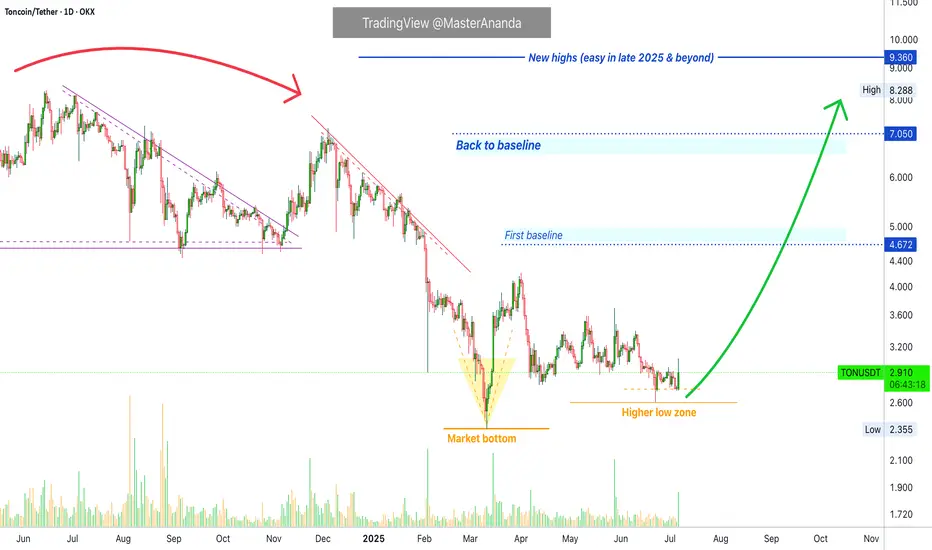
Toncoin Bullish Breakout Confirmed —8X Lev. PossibleLook at the volume today, it is the highest since late May. This high volume coupled with a big bullish candle confirms two things: 1) The higher low is in and 2) the next bullish wave starts now.
There is no other way things can develop. The chart is the market. The chart reveals everything you need to know. Toncoin's chart is revealing buying pressure right now, after a higher low. Now that the higher low is confirmed this means the bullish wave we have been expecting is underway.
This is the last chance. A great opportunity. This chart setup can be approached with leverage, easily with 5X. Can be more just as it can be less. Make sure to plan ahead.
Aim high —A new all-time high
Do not sell after 100% growth, the market will grow much more. Here there is an easy target open with 222%, this level should be achieved mid-term. Long-term, expect maximum growth.
The altcoins market will be growing straight up, month after month after month.
This is just a friendly reminder. Get back in the market.
Buy and hold.
Thanks a lot for your continued support.
Namaste.