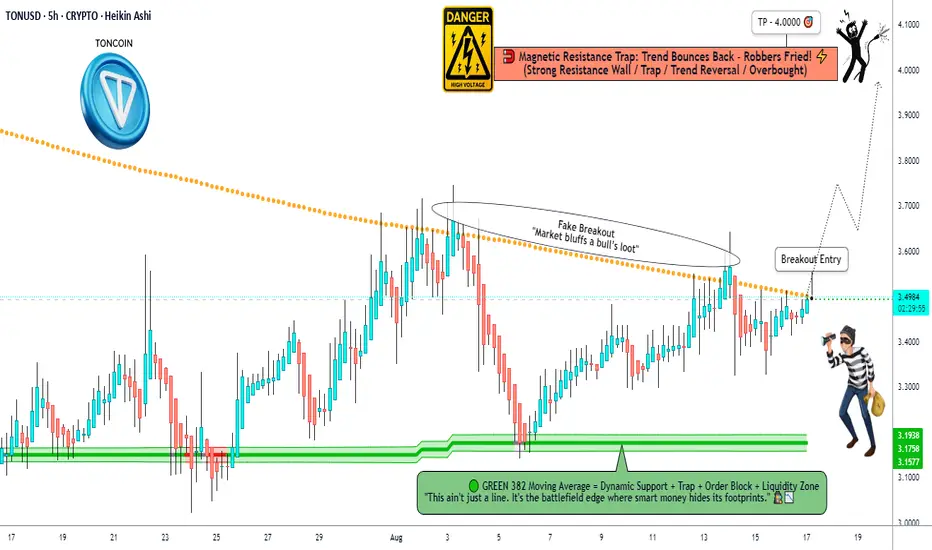
TON/USD Market Trap or Treasure? Decide Before 4.000!🚨TON/USD "TONCOIN vs U.S DOLLAR" Crypto Heist Plan 🚨
💎 Hello Thief OG’s, Money Grabbers & Market Shadows!
Today’s mission is locked 🔐 – we’re breaking into the TON/USD vault with a Bullish Heist Strategy.
🎯 Plan of Attack
Asset: TON/USD "TONCOIN vs U.S DOLLAR"
Mode: Bullish 🟢 (Heist in progress)
Entry (Thief Layers):
💰 Layer 1 @3.4900
💰 Layer 2 @3.4500
💰 Layer 3 @3.4000
💰 Layer 4 @3.3600
(You can add more layers – the deeper the vault, the sweeter the loot!)
Stop Loss (SL) 🛑: @3.2600 – This is the Thief Emergency Exit.
🔐 Adjust based on your own strategy & risk appetite.
Target (Escape Point) 🏆: @4.0000
⚡ “High Voltage Zone” ahead – escape with your loot before the alarms ring!
🕵️♂️ Thief Strategy Style
This is not a single-door entry – we’re layering multiple buy limit orders, stacking our positions like a true market bandit. 📊
Stay sharp – once the bags are full, we run with the profit! 🏃♂️💨
⚠️ Heist Rules for OG’s
Only rob the long side – trend is with the bulls. 🐂
Use trailing SL to protect stolen money 💵.
Don’t get caught in news traps – avoid new entries during 🔔 big announcements.
💥 Boost this plan 💥 if you’re riding with the Thief Crew!
Together, we rob the market – layer by layer, vault by vault. 💰🚀
📌 Disclaimer: This is a Thief Trading style heist plan, not financial advice. Trade with your own risk management.
TONCOINUSDT
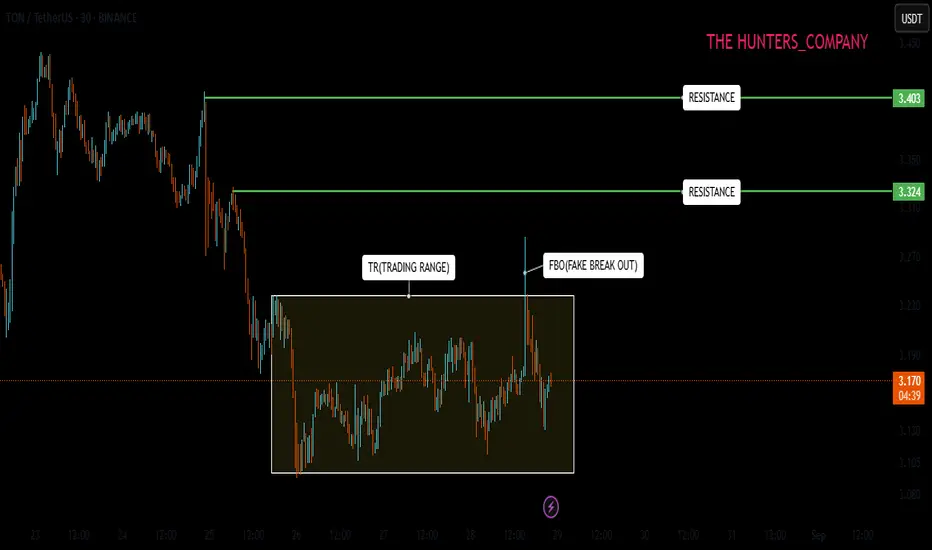
TONCOIN ; Will the pump price finally be fixed?Hello friends
Well, you see that after the decline we had, the price has reached the range that we have specified for you.
In this range, the price once attacked the ceiling of the range, but the failure was fake, which we have also specified.
Now, in this movement, the buyers must see again whether the range will finally be broken or not?
In the event of a valid failure of the trading range, the price can easily move to the specified resistances.
*Trade safely with us*
TONCOIN Shows Neutral-Bearish SentimentTONCOIN is showing neutral-bearish sentiment — a slight daily increase, but technical signals on most indicators are directed towards Sell.
Technical picture
Bitget (1D summary):
General signal: Sell
Oscillators: 2 Sell, 2 Buy, 6 Neutral
Moving Averages: 12 Sell, 1 Buy, 2 Neutral
1-day: Strong Sell
1-week / 1 month: Strong Sell
Moving Averages (MA): Buy: 10, Sell: 2
Oscillators: Buy: 6, Sell: 1
Final signal: Strong Buy on daily indicators — difference in data with Bitget on different timeframes.
Key levels
Pivot (classic): $0.001862
Support: S1 ≈ $0.001783
Resistance: R1 ≈ $0.001844
Market dynamics
The price dropped below $0.001800, signaling bearish pressure with the formation of "bearish engulfing".
RSI dropped to 26.8 (oversold zone), a short-term reaction is possible.
Bollinger Bands are narrowing - volatility may increase.
Trading volume is high, which confirms the dominance of sellers in the session.
TONCOIN Neutral dynamics prevail on most timeframesOverall technical sentiment
Today's signal: Neutral — neutral dynamics prevail on most timeframes and technical indicators. 1-week rating is also balanced, and 1-month — shows "Sell"
Technical indicators
Overall technical conclusion: Strong Sell
Moving Averages: 5 Buy, 7 Sell
Oscillators: 1 Buy, 8 Sell
Summary: Strong Sell — technical indicators and averages point to downward pressure.
Main indicators:
RSI (14): ~46 — neutral
Stochastic: neutral
StochRSI: Sell
MACD: Buy
ADX: Sell
Williams %R: Sell
CCI: Sell
ROC: Sell
Most oscillators are on the sellers' side.
Moving Averages:
MA5/MA10/MA20: Sell
MA50/MA100/MA200: Buy — several mid-term MAs support a possible reversal.
Pivot levels (Classic):
S1: $3.3368
Pivot: $3.3472
R1: $3.3526 — nearest resistance.
Volume and Market Data
Current TON Price: ~$3.34
24-hour range: $3.33–$3.41
Trading Volume: about $170–200 million
Capitalization: ~$8.58 billion,
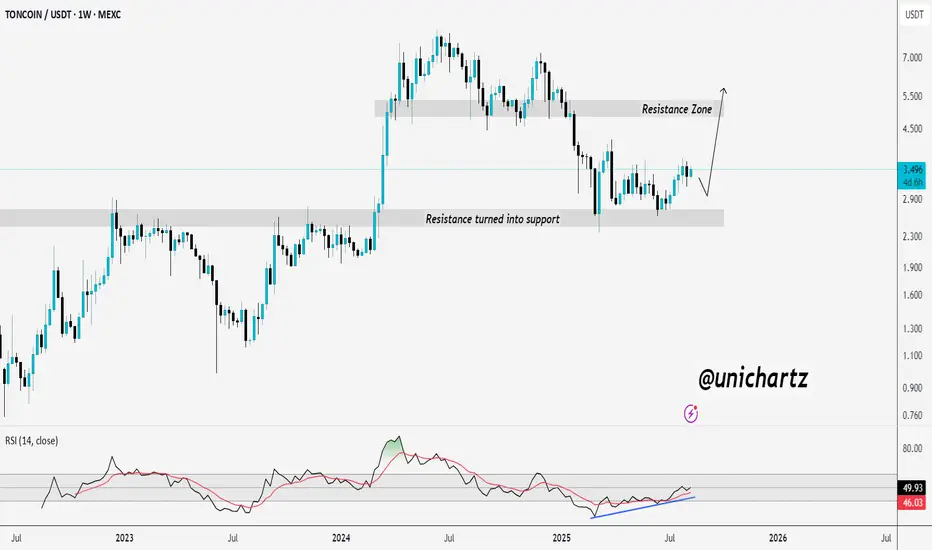
TONCOIN could move 60% from here the key levels to watchCRYPTOCAP:TON is holding above a strong support zone at $2.40–$2.70, showing buyers are defending this level well.
Price is moving higher without facing major resistance immediately ahead.
If momentum continues, it could aim for the $5.00–$5.50 zone next, while a drop below $2.40 would weaken the bullish outlook.
DYOR, NFA
#TON/USDT#TON
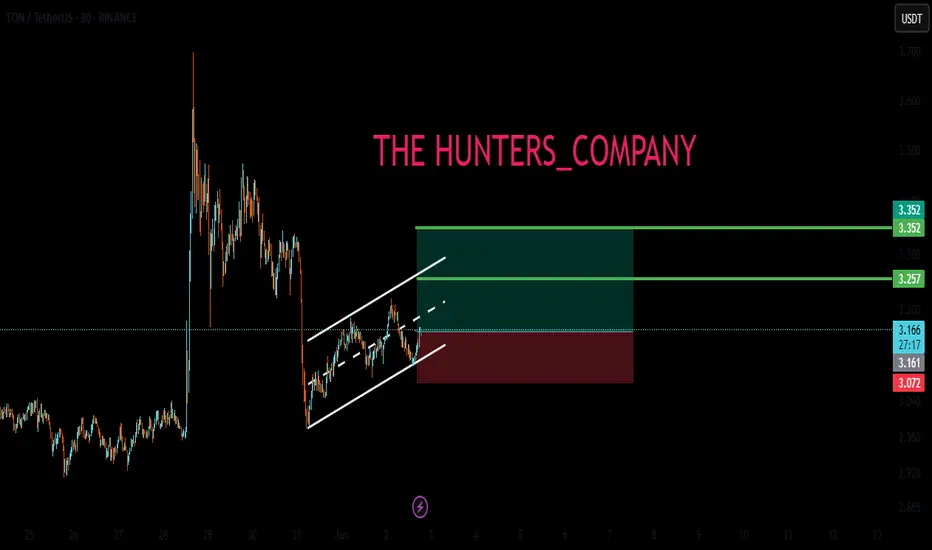
The price is moving within an ascending channel on the 1-hour frame, adhering well to it, and is on its way to break it strongly upwards and retest it.
We have support from the lower boundary of the ascending channel, at 3.05.
We have a downtrend on the RSI indicator that is about to break and retest, supporting the upside.
There is a major support area in green at 3.03, which represents a strong basis for the upside.
Don't forget a simple thing: ease and capital.
When you reach the first target, save some money and then change your stop-loss order to an entry order.
For inquiries, please leave a comment.
We have a trend to hold above the 100 Moving Average.
Entry price: 3.20.
First target: 3.40.
Second target: 3.53.
Third target: 3.70.
Don't forget a simple thing: ease and capital.
When you reach your first target, save some money and then change your stop-loss order to an entry order.
For inquiries, please leave a comment.
Thank you.
TONCOIN - Technical pictureTechnical picture
All key indicators, including RSI (≈56), STOCH, MACD, ADX and others, signal Buy. There is not a single "Sell" signal or
Moving averages on all timeframes (from MA5 to MA200) also give a stable Buy, without "Sell" signals
Pivot levels:
Current Pivot: $3.4271
Resistance: $3.4436 (R1), then $3.4629 and $3.4794
Conclusion: the overall sentiment is confidently bullish.
Additional signals:
Analysis by indicators: 1 Sell, 7 Neutral, 17 Buy - final signal: Strong Buy
Among the oscillators - 5 Buy signals, 5 Neutral, 0 Sell.
Moving Averages: 12 Buy, 2 Neutral, 1 Sell
Chart Shapes and Patterns
According to OKX Europe, Toncoin has exited a descending triangle, which often indicates a trend reversal
Support: $2.60 and $3.00. Resistance: $3.50 and $3.70
Upside Potential and Key Levels
Cryptodamus's final article emphasizes that the $4.00 zone (100-day MA) is key: a break above it could open the way to $5.48, and a failure to $2.90
Binance Square outlines immediate targets: $3.95-4.00, then $4.20-4.30, and a possible move to $4.50+ if the $3.91 level is broken
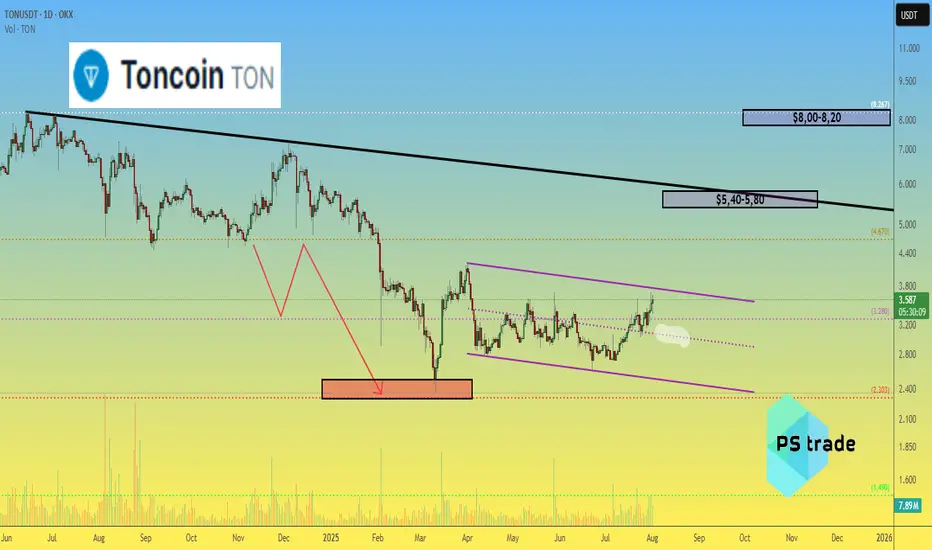
Toncoin TON price analysis💎 CRYPTOCAP:TON didn’t become a legend over the past 9 months — but at least our correction target of $2.30–2.50 played out with precision.
While most of the crypto market is currently going through a correction, #Toncoin keeps pushing upward. Still, we remain realistic:
🎯 First target: $5.40–5.80
🎯 Second target: $8.00–8.20
🚀 It’s not a “to the moon” scenario, but a potential 2x–3x from current levels is attractive.
The key support level OKX:TONUSDT remains at $3.00 — as long as it holds, the bullish trend remains valid.
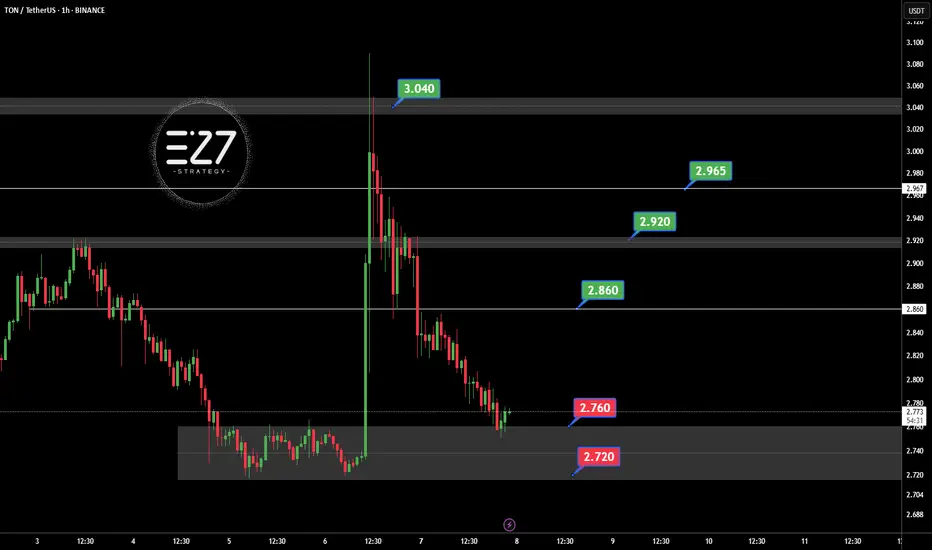
TONUSDT Following the official denial by UAE authorities regarding the possibility of obtaining a golden visa through staking OKX:TONUSDT , the bullish momentum driven by that rumor has faded. Selling pressure has increased, and TON is now consolidating within the key support zone of 2.720 to 2.760 USDT. If this support breaks, further downside is likely. However, if the price holds and reclaims the 2.860 USDT resistance, it could trigger a recovery toward 2.920 and 2.965 USDT. For now, the market sentiment remains bearish with a corrective bias.
Key Points:
UAE officially denied TON-based golden visa claims, weakening sentiment.
Current support zone: 2.720–2.760 USDT.
Key resistance: 2.860 USDT, then 2.920 USDT.
Break below 2.720 = further decline.
Break above 2.860 = potential bullish reversal.
⚠️ Please Control Risk Management in trades.
Today's signal is TONHello friends
Given the price growth after reaching resistance, it has entered a correction, which provides a good opportunity to buy in stages and with capital management and move to the specified targets.
*Trade safely with us*
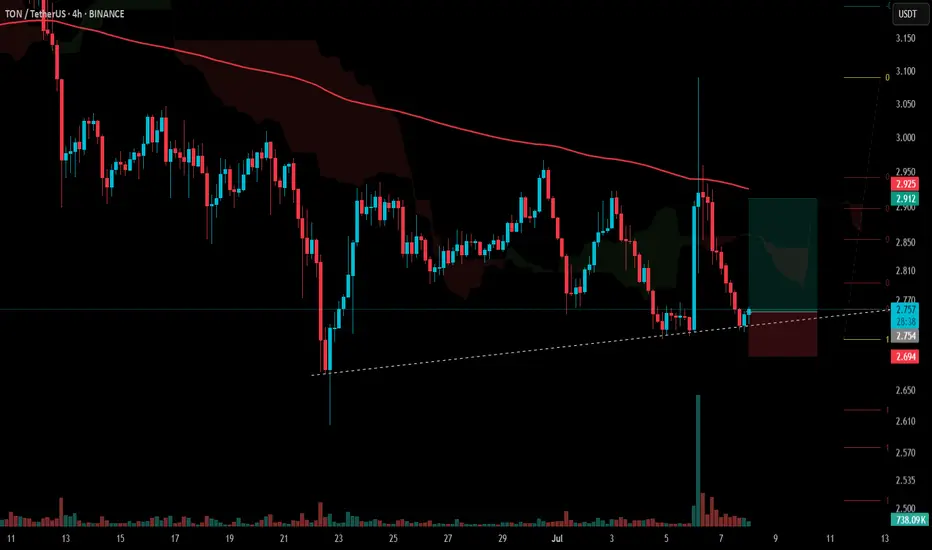
#TON Update #4 – July 8, 2025🟡 #TON Update #4 – July 8, 2025
Tonecoin has reached the area we previously marked as a potential entry zone. We’re now seeing early signs of a bounce from that level.
For this reason, I'm considering entering a trade here, with a risk-to-reward ratio of approximately 2.63.
▫️ Entry: 2.754
▫️ TP1: 2.850 (50%)
▫️ TP2: 2.910 (50%)
▫️ Stop: 2.694
❗️ I do not recommend moving the stop loss. Stick to the plan. This trade will be actively monitored and updated if necessary.
TON to $3.34? This Chart Pattern Could Deliver 12.88% GainsTON/USDT is currently showing promising signs of bullish momentum on the 4-hour chart. The most compelling reason to lean bullish is the consistent price behavior around the Key Support Zone near $2.899. Over several sessions, the price has tested this zone multiple times without any convincing breakdown. Each test resulted in a strong upward rebound, reinforcing the level’s significance. This repeated validation of support suggests that buyers are stepping in with confidence whenever the price revisits this area.
Looking at recent market structure, the price action is consolidating just above the key support level. Such sideways behavior above a major support zone often hints at accumulation. This means market participants could be preparing for an upward move, especially as there’s no sign of aggressive selling pressure. The market is essentially respecting this base, which strengthens the bullish case.
Above the current price, two resistance levels stand out. The first is around $3.240, which marks the mid-range from a previous consolidation and has acted as resistance in the past. If TON can push above this level, it would likely attract further bullish momentum. The second target is at $3.340, which is the most recent swing high. This level represents a clear take-profit area for swing traders and would complete a healthy retracement to previous highs.
Momentum indicators also align with the bullish sentiment. The MACD indicator shows a bullish crossover, with the MACD line crossing above the signal line. This crossover is happening near the zero line, which often marks the beginning of a strong directional move. Additionally, the histogram is flipping into green territory, suggesting that buying pressure is beginning to outweigh selling activity.
With this technical backdrop, a clear trade setup is present:
• Entry Level: Around $2.95–$2.96 (current price range above support)
• Stop Loss: $2.880 (just below the key support zone to minimize risk)
• Take Profit 1 (TP1): $3.240 (first resistance level)
• Take Profit 2 (TP2): $3.340 (recent local high)
The structure of this trade offers a risk-to-reward ratio of approximately 4.82, which is highly favorable for both swing traders and short-term bulls. The upside potential (~12.88%) vastly outweighs the downside risk (~2.67%). This type of asymmetry in trading setups is what experienced traders often look for — strong support, clear resistances, and momentum indicators confirming the direction.
Traders should also keep an eye on price behavior near $3.240. If the price struggles there, partial profit booking may be wise. On the other hand, a strong breakout above this zone could push TON swiftly toward the $3.340 mark. Volume will be a key factor to monitor — increasing volume on green candles would confirm institutional interest or broader market support behind the move.
In conclusion, the current chart setup on TON/USDT reflects a textbook bullish rebound scenario. With support holding firm, momentum building, and clean upside targets, this presents an attractive opportunity for a long position — especially for traders who favor structured and well-risked entries. The next 8–16 hours could be decisive in validating the move, so it’s worth watching this setup closely.

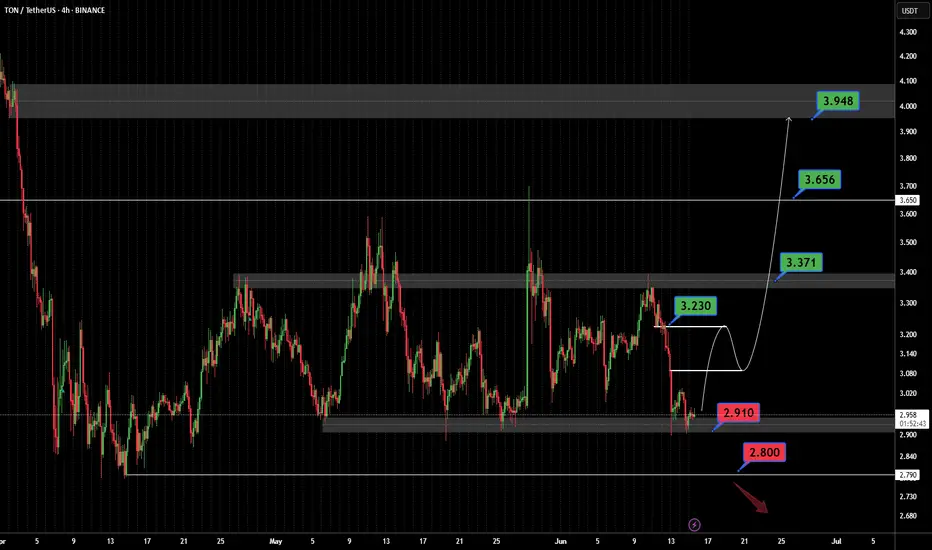
TONUSDT On the @TONUSDT chart, price is currently making a corrective move after reacting to the key support at 2.800. It may rise toward the 3.230 resistance and potentially break higher with a pullback to continue upward. However, if the 2.800 support fails, a deeper drop could follow. ⚠️📉
Resistances:
• 3.230 💥
• 3.371 🔼
• 3.656 🔼
• 3.948 🚀
Supports:
• 2.910 🛡️
• 2.800 🔻
⚠️Contorl Risk management for trades.
LIVE TRADEHello friends
Given the ascending channel that has formed, we can open positions with capital and risk management to move towards the specified goals.
*Trade safely with us*
#TON/USDT#TON
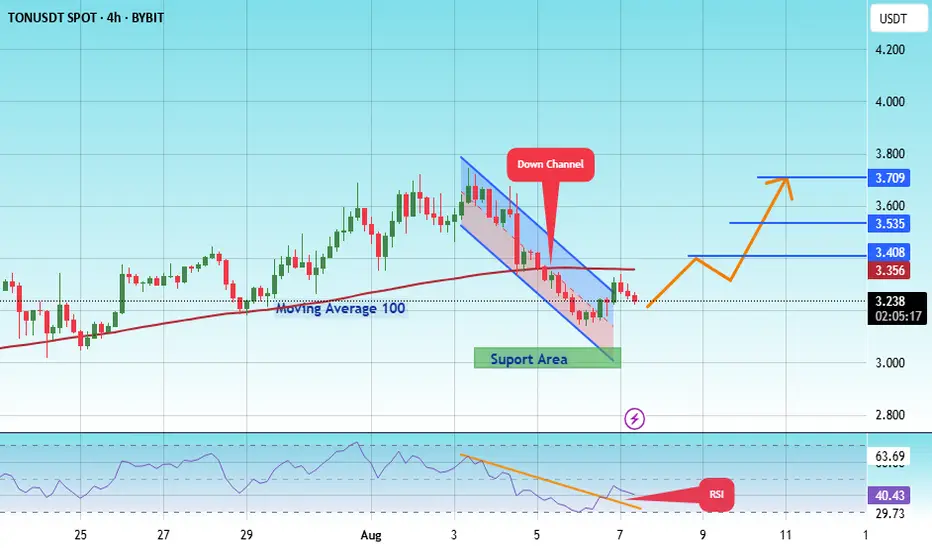
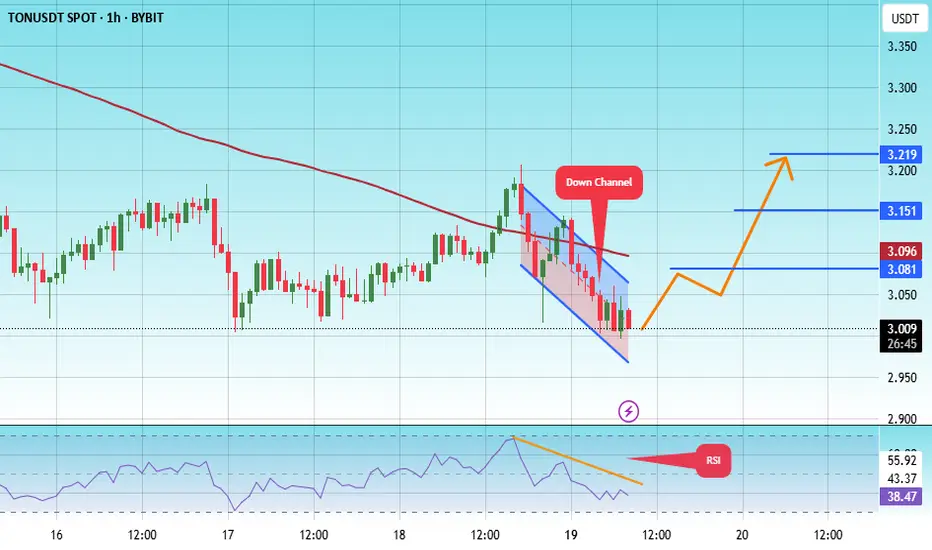
The price is moving within a descending channel on the 1-hour frame, adhering well to it, and is heading for a strong breakout and retest.
We are experiencing a rebound from the lower boundary of the descending channel, which is support at 3.20.
We are experiencing a downtrend on the RSI indicator, which is about to break and retest, supporting the upward trend.
We are looking for stability above the 100 Moving Average.
Entry price: 3.30
First target: 3.41
Second target: 3.53
Third target: 3.69

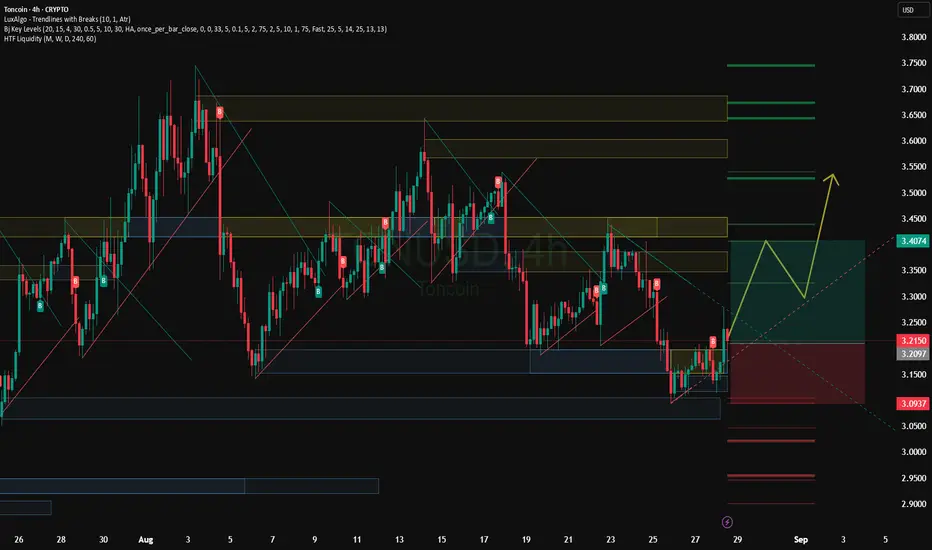
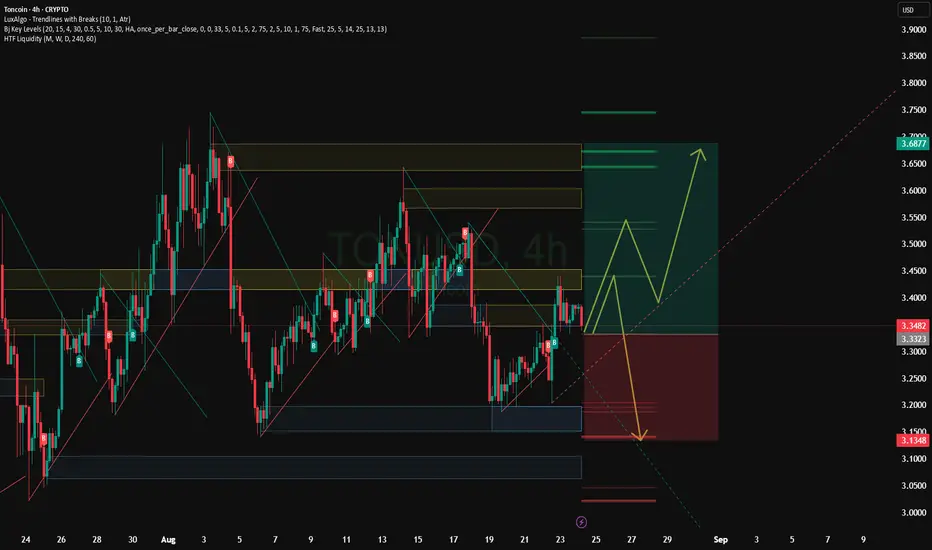
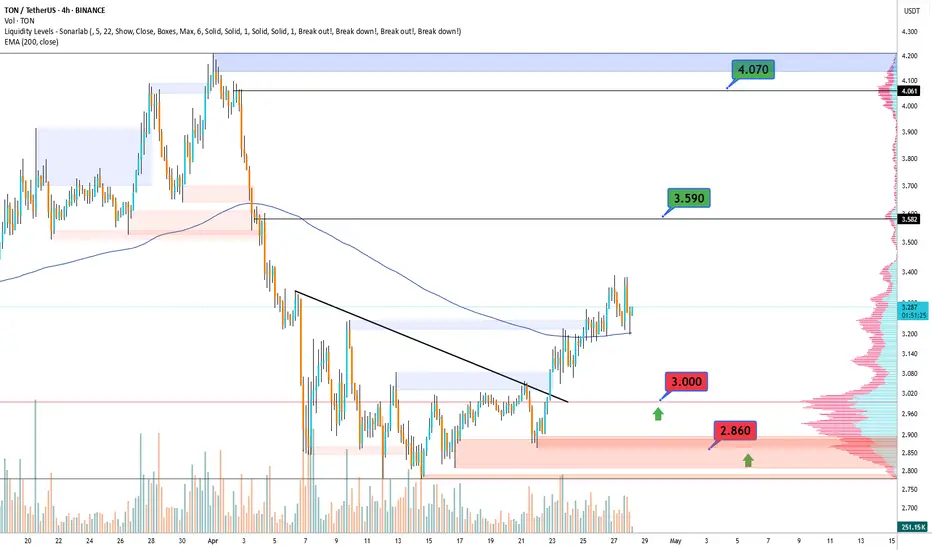
TONCOINCRYPTOCAP:TON In the 4-hour timeframe, key support and resistance zones have been identified based on significant highs and lows. The primary resistance area is at $4.070, while the main support level is at $2.860. A descending trendline has been drawn, and the price trading below the 200-period moving average suggests continued bearish momentum in this time horizon. However, if the near-term resistance at $3.590 is broken, a potential upward movement towards the primary resistance at $4.070 could occur. Conversely, a break below the immediate support at $3.000 might lead to a price decrease towards the main support level at $2.860. To confirm bullish or bearish scenarios, monitoring for valid breakouts of these levels along with volume analysis and other technical tools is essential.
#TON/USDT#TON
The price is moving within a descending channel on the 1-hour frame, adhering well to it, and is heading towards a strong breakout and retest.
We are experiencing a rebound from the lower boundary of the descending channel, which is support at 2.97.
We are experiencing a downtrend on the RSI indicator, which is about to break and retest, supporting the upward trend.
We are looking for stability above the 100 Moving Average.
Entry price: 3.02
First target: 3.05
Second target: 3.15
Third target: 3.22
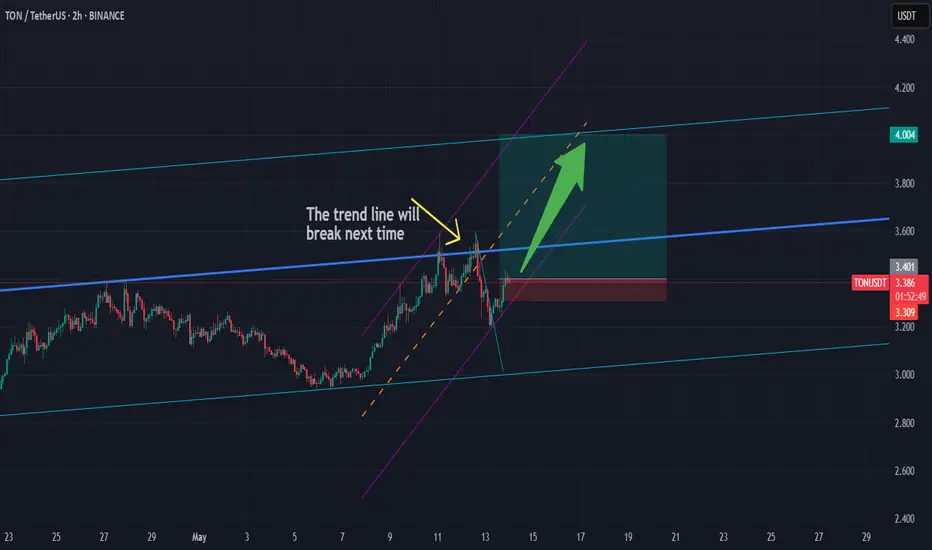
Long TON/USDTThe trend line touch two times and in the next time will break,
We are in the parallel channel and go up,
First target is 4$ soon.
Good Luck..
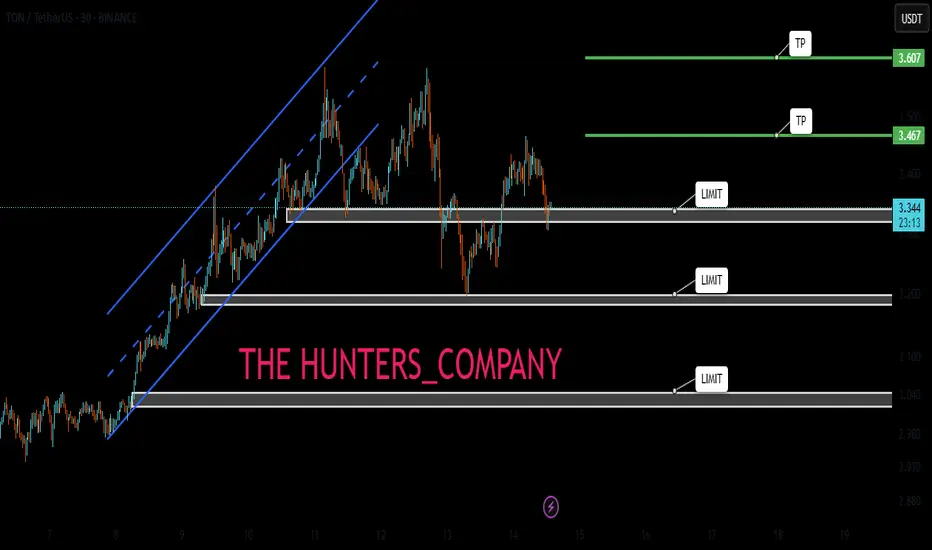
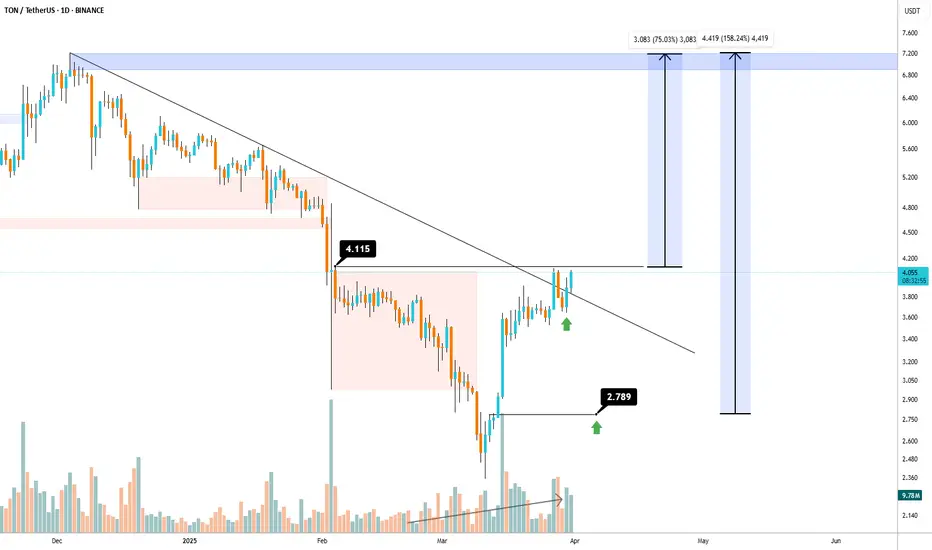
TON breakout alert!!CRYPTOCAP:TON chart Update!
TON has officially broken out of a multi-month symmetrical triangle on the daily chart, signaling a potential trend reversal after a long downtrend.
📈 Clean breakout above descending resistance
🔼 Entry triggered around $3.44
🎯 Targets ahead:
TP1: $4.12
TP2: $4.88
TP3: $5.67
As long as the price stays above the breakout zone, bulls are in control. A successful retest could offer another great entry!
If you find this analysis helpful, please hit the like button to support my content! Share your thoughts in the comments, and feel free to request any specific chart analysis you’d like to see.
Happy Trading!!

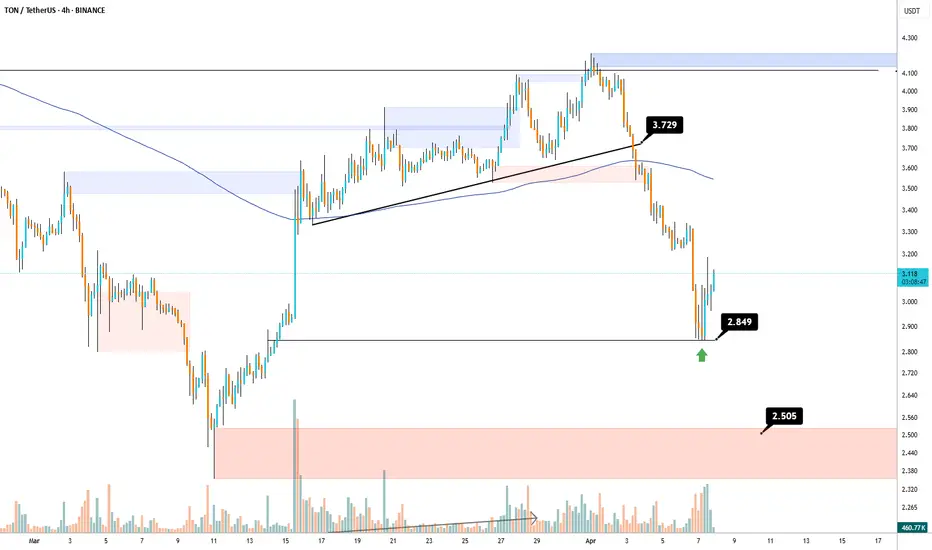
TON Bullish📉 TON/USDT 4H Analysis:
After breaking below the key support at 3.729, TON saw a sharp drop toward 2.849, where it found a strong bullish reaction. A short-term bullish correction is currently underway, but resistance at 3.3–3.4 and the 200 EMA may limit further upside. If TON fails to break through, it could retest 2.849 or drop to the 2.505 demand zone. For a true bullish reversal, a confirmed breakout and consolidation above 3.729 is essential.
#TON/USDT#TON
The price is moving within a descending channel on the 1-hour frame and is expected to continue lower.
We have a trend to stabilize below the 100 moving average once again.
We have a downtrend on the RSI indicator, supporting the upward move with a breakout.
We have a resistance area at the upper limit of the channel at 3.73.
Entry price: 3.69
First target: 3.60
Second target: 3.515
Third target: 3.40

Is a TON Pump Coming?Is a TON Pump Coming? 🚀
TON, the blockchain developed by Telegram’s team, has gained significant attention due to its low transaction fees and strong connection with Telegram. Recent increases in liquidity and demand indicate growing investor interest in this cryptocurrency.
🔹 Technical Analysis:
TON is currently in a short-term uptrend, with $4 acting as a key resistance level. A confirmed breakout above this level could push the price towards $7. However, failure to break this resistance may lead to a price correction toward lower support levels.
🔹 Potential Risks:
A significant portion of TON tokens is held by whales, which could lead to high volatility. Additionally, its unlimited supply poses long-term inflation risks if not managed properly.
🔹 Growth Catalysts:
Recent positive news, such as Telegram’s potential partnership with AI (Grok) and the release of key updates, could drive further demand. If TON sustains its momentum and breaks key resistance levels, it may enter a stronger bullish phase.
📌 Conclusion:
While TON has strong fundamentals and market interest, its long-term stability depends on supply management and investor behavior. Entry at key levels with proper risk management is essential for those looking to trade or invest. 🚀
TON Claims $4 Pivot Amidst A Golden Cross PatternThe price of CRYPTOCAP:TON spiked 9% today reclaiming the $4 price pivot with further growth set to occur amidst a "Golden Cross" pattern.
The Open Network ( CRYPTOCAP:TON ) is a revolutionary blockchain platform designed to handle millions of transactions per second. It uses a unique multi-blockchain architecture with dynamic sharding and instant messaging between chains.
The system aims to make blockchain technology accessible to everyday users through integration with messaging apps and user-friendly services. TON has become one of the fastest-growing blockchain ecosystems, with numerous decentralized applications and services being built on its infrastructure.
As of the time of writing, CRYPTOCAP:TON is up 9% trading within overbought regions as hinted by the RSI at 78.78 with growing momentum and the appearance of a golden cross pattern, a breakout to $6 is feasible.
For TON, a breakout above the 1-month high pivot could cement a move to the $6 region. Similarly, in the case of a cool-off, given the RSI is overbought, the 38.2% Fibonacci level is acting as support for $TON.
Toncoin Price Live Data
The live Toncoin price today is $3.96 USD with a 24-hour trading volume of $285,169,930 USD. Toncoin is up 8.27% in the last 24 hours. The current CoinMarketCap ranking is #12, with a live market cap of $9,833,721,005 USD. It has a circulating supply of 2,484,304,181 TON coins and the max. supply is not available.
