TONUSDT: Short the Rejection,Buy the Capitulation – A Dual-Level
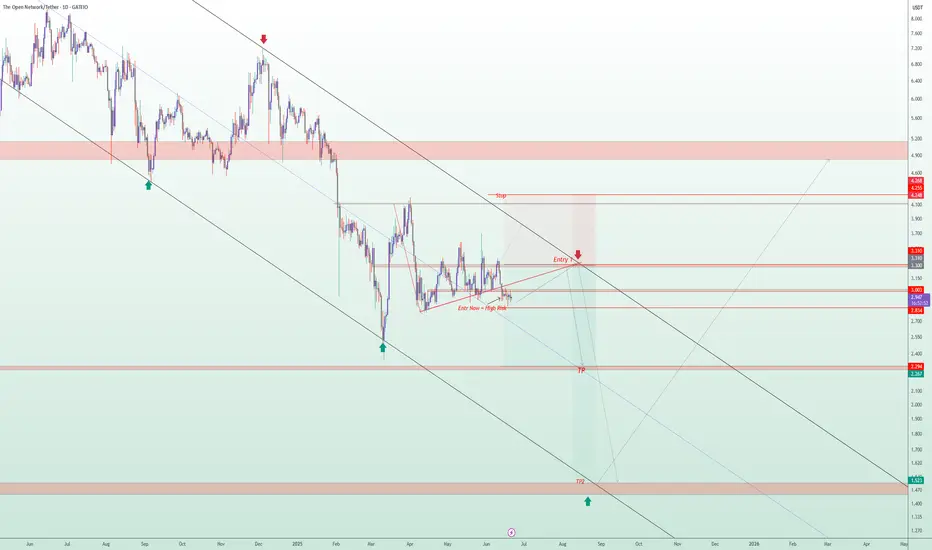
📉 TONUSDT Technical Analysis – Trending in a Long-Term Descending Channel, Is the Ideal Short Entry Coming?
TONUSDT is currently trading inside a long-term descending channel, with clear bearish momentum dominating the structure.
🔻 Scenario 1 (Early & Risky Entry):
Traders may consider opening a short position from the current level, but this setup carries higher risk, as the price could still push upward toward the upper boundary of the channel.
Stop-loss level is clearly marked on the chart.
🧭 Scenario 2 (Smarter, Low-Risk Entry):
A more calculated approach is to wait for the price to revisit the upper resistance zone of the descending channel (marked as Entry 1 on the chart).
This zone offers a clean low-risk, high-reward short opportunity, with a tight stop-loss and excellent setup.
🎯 Defined Targets in This Analysis:
Target 1: The midline of the descending channel
Target 2: The bottom of the long-term descending channel
💎 Important Insight:
If this bearish scenario completes and the price reaches the bottom of the descending channel, that zone could be a prime buying opportunity for long-term holders.
Technically, it's a major support level and psychologically, it's where smart money often steps in.
⚠️ Disclaimer:
This is not financial advice. This analysis is for educational purposes only. Always wait for confirmation and apply strict risk management when trading.
📩 What’s your opinion on this setup? Do you agree with the short plan, or see another scenario unfolding? 👇
Tonlong
TON to $3.34? This Chart Pattern Could Deliver 12.88% GainsTON/USDT is currently showing promising signs of bullish momentum on the 4-hour chart. The most compelling reason to lean bullish is the consistent price behavior around the Key Support Zone near $2.899. Over several sessions, the price has tested this zone multiple times without any convincing breakdown. Each test resulted in a strong upward rebound, reinforcing the level’s significance. This repeated validation of support suggests that buyers are stepping in with confidence whenever the price revisits this area.
Looking at recent market structure, the price action is consolidating just above the key support level. Such sideways behavior above a major support zone often hints at accumulation. This means market participants could be preparing for an upward move, especially as there’s no sign of aggressive selling pressure. The market is essentially respecting this base, which strengthens the bullish case.
Above the current price, two resistance levels stand out. The first is around $3.240, which marks the mid-range from a previous consolidation and has acted as resistance in the past. If TON can push above this level, it would likely attract further bullish momentum. The second target is at $3.340, which is the most recent swing high. This level represents a clear take-profit area for swing traders and would complete a healthy retracement to previous highs.
Momentum indicators also align with the bullish sentiment. The MACD indicator shows a bullish crossover, with the MACD line crossing above the signal line. This crossover is happening near the zero line, which often marks the beginning of a strong directional move. Additionally, the histogram is flipping into green territory, suggesting that buying pressure is beginning to outweigh selling activity.
With this technical backdrop, a clear trade setup is present:
• Entry Level: Around $2.95–$2.96 (current price range above support)
• Stop Loss: $2.880 (just below the key support zone to minimize risk)
• Take Profit 1 (TP1): $3.240 (first resistance level)
• Take Profit 2 (TP2): $3.340 (recent local high)
The structure of this trade offers a risk-to-reward ratio of approximately 4.82, which is highly favorable for both swing traders and short-term bulls. The upside potential (~12.88%) vastly outweighs the downside risk (~2.67%). This type of asymmetry in trading setups is what experienced traders often look for — strong support, clear resistances, and momentum indicators confirming the direction.
Traders should also keep an eye on price behavior near $3.240. If the price struggles there, partial profit booking may be wise. On the other hand, a strong breakout above this zone could push TON swiftly toward the $3.340 mark. Volume will be a key factor to monitor — increasing volume on green candles would confirm institutional interest or broader market support behind the move.
In conclusion, the current chart setup on TON/USDT reflects a textbook bullish rebound scenario. With support holding firm, momentum building, and clean upside targets, this presents an attractive opportunity for a long position — especially for traders who favor structured and well-risked entries. The next 8–16 hours could be decisive in validating the move, so it’s worth watching this setup closely.

TON Long TrrigerTONUSDT | Bullish Retest & Fibonacci Confluence 🚀
TON has recently pushed into new highs, forming a strong uptrend on the 15-minute timeframe. The price is currently pulling back into key Fibonacci retracement levels, creating a potential long entry opportunity.
🔹 Technical Analysis:
✅ Trendline Support: The price is respecting an ascending dashed trendline, indicating bullish structure continuation.
✅ Fibonacci Levels: The 0.382 ($4.0286) and 0.5 ($3.9923) levels align with key support zones.
✅ EMA Confluence: Price is interacting with the 7, 25, and 99 EMAs, suggesting a possible bounce.
📊 Key Levels to Watch:
🔹 Immediate Support: $4.0286 (Fib 0.382)
🔹 Stronger Support: $3.9923 (Fib 0.5)
🔹 Breakout Resistance: $4.0740 (Fib 0.236)
🔹 Major Target: $4.1486
🚀 Long Setup Confirmation:
A strong bounce from the Fibonacci retracement levels ($4.0286–$3.9923) with increasing volume could confirm a long entry. A break above $4.0740 would signal bullish continuation towards $4.1486 and beyond.
🔻 Invalidation & Risk Management:
A break below $3.9563 (Fib 0.618) could invalidate this setup.
A stop-loss can be placed below this level to minimize risk.
If the trend holds, TON could be gearing up for another leg up! Watch for a strong reaction at key Fibonacci levels.
#TON #Crypto #Trading #LongSetup #TechnicalAnalysis 🚀
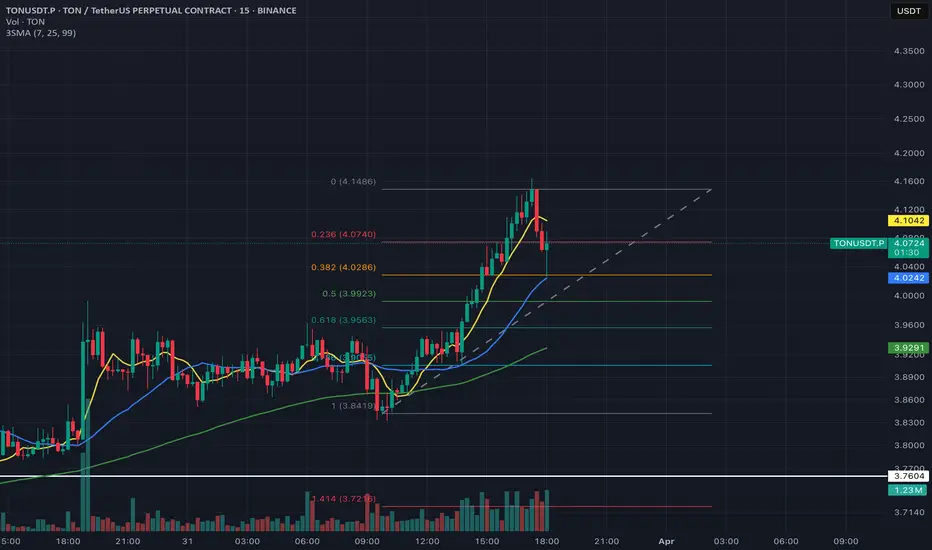
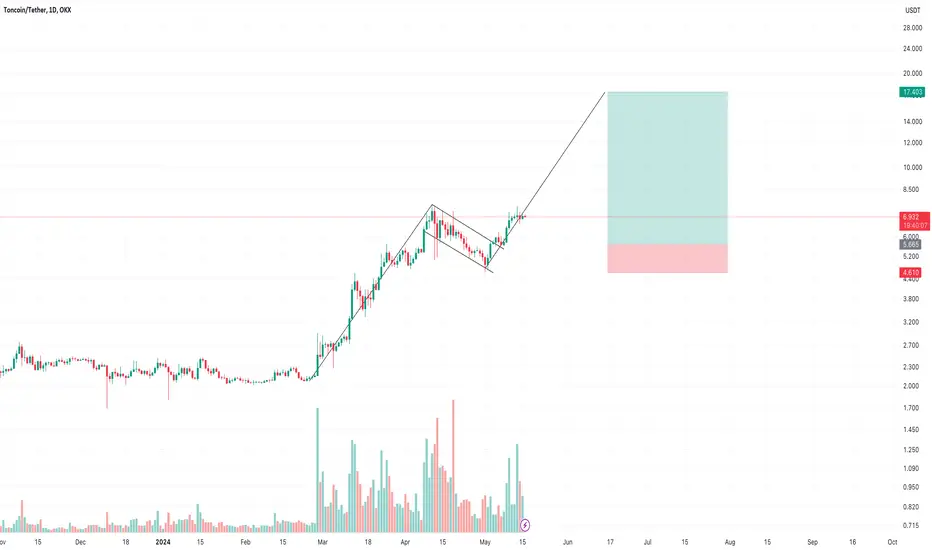
Chart Idea - TONUSDT Swing LongWhat an amazing classic bull flag pattern break out we see here.
Entry: 5.669
TP: 17.39
SL: 4.6
It's a swing trade and could take weeks or even months to playout. Will update the thread here with new comments.
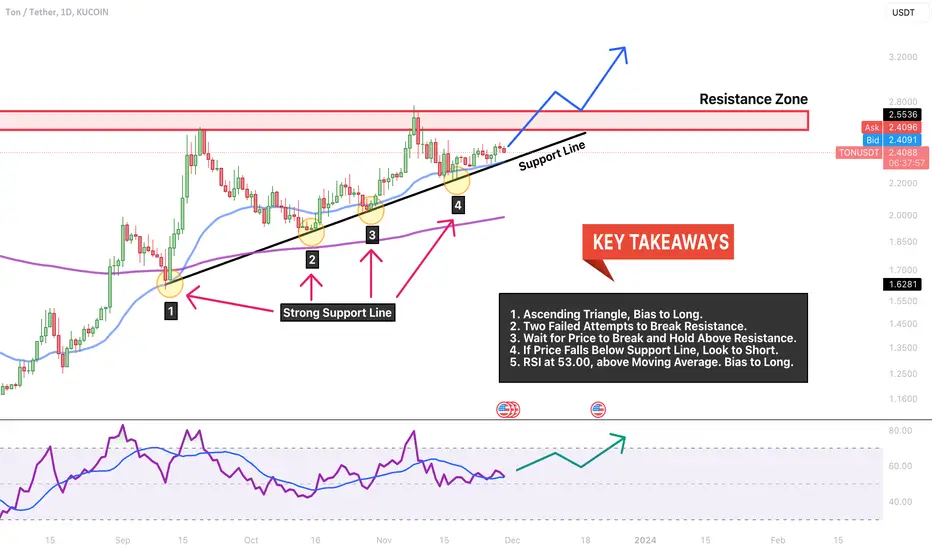
TON → Break Resistance or Flop? Hold Your Entry! Lets Review.Toncoin is racing upward to break resistance in this perfect ascending triangle! Is there enough momentum for the pattern to play out? Or will the price surprise us and reverse down to the 200EMA?
How do we trade this?
If you're not already in a trade, do not enter . There is pain in either direction; we're too close to resistance to long and we don't have a bear signal bar or any strong data to support a reversal. Best to wait on the sidelines until one of two scenarios happens.
1. If the price breaks the Resistance Zone and shows support after the breakout, a long entry is reasonable. It would be a bonus if we see Bitcoin break its Weekly Resistance and make its way toward the $40,000 price range, which brings bullish sentiment to the Crypto market.
2. If the price fails to break resistance and shows us a strong bear signal bar; pin top with the small body closing on or near its low, then a short entry may be reasonable. The probability would be greater if you waited until the support line was broken and a strong bear candle closed below it.
Until then, let's see where the price action goes. FOMO (Fear of Missing Out) is your worst enemy. You're making more money by not falling for the seduction of market profit.
Trade Ideas
Short Entry : $2.33
Stop Loss: $1.39
Take Profit: $2.65
Risk/Reward Ratio: 1:1
Long Entry: $2.82
Stop Loss: $2.50
Take Profit: $3.47
Risk/Reward Ratio: 1:2
Key Takeaways
1. Ascending Triangle, Bias to Long.
2. Two Failed Attempts to Break Resistance.
3. Wait for Price to Break and Hold Above Resistance.
4. If Price Falls Below Support Line, Look to Short.
5. RSI at 53.00, above Moving Average. Bias to Long.
You are solely responsible for your trades, trade at your own risk!
If you found this analysis helpful, click the Boost button and let us know what you think in the comment section below!
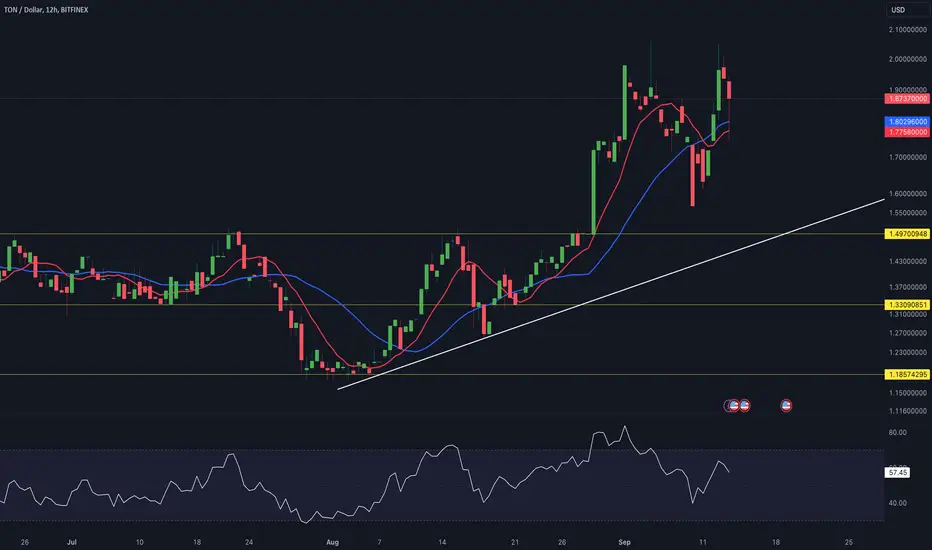
TON/USD 12 HOUR UPDATE BY CRYPTOSANDERS !!hello, welcome to this TON/USD update by CRYPTO SANDERS.
CHART ANALYSIS:- Toncoin (TON) was in the green for a second straight session, moving closer to a key resistance level.
TON/USD jumped nearly 3% higher on Friday, peaking at the 2.15 level at the time of writing.
this is the strongest point TON has hit since the end of September when the price last collided with a ceiling of 2.25.
it appears this occurred as the RSI continued to close in on a ceiling at the 57.00 mark.
With price strength now at a reading of 54.22, the chances are high that a move to 57.00 will result in toncoin trading at 2.25.
I have tried to bring the best possible outcome to this chart.
Hit the like button if you like it and share your charts in the comments section.
Thank you
TON/USD 12hour UPDATE BY CRYPTO SANDERS !!hello, welcome to this TON/USD update by CRYPTO SANDERS.
CHART ANALYSIS:- Toncoin (TON) moved away from a multi-week low in today’s session, as the price climbed above the 2.00 mark.
Following a low of 1.95 on Wednesday, TON/USD bulls pushed the token to a peak of 2.10 earlier in the day.
toncoin bounced from its lowest point since September 15, which has also been a key support point.
Traders opted to buy the dip at this point, with the relative strength index (RSI) rising past a ceiling of 50.00.
the index is tracking at 50.73, with a ceiling of 54.00 a possible target for buyers.
Should this point be hit, there is a good chance that TON will hit a ceiling at the 2.20 region in the coming days.
I have tried to bring the best possible outcome to this chart.
Hit the like button if you like it and share your charts in the comments section.
Thank you
TON/USDT 1DAY UPDATE BY CRYPTOSANDERS !!Hello, welcome to this TON/USDT update by CRYPTO SANDERS.
CHART ANALYSIS:- Toncoin (TON) fell by as much as 7% on Thursday, after recently climbing to its highest point in nine months.
TON/USD dropped to a low of 2.31 earlier in the day, after peaking at 2.49 less than 24 hours ago.
The drop came as toncoin bulls seemingly opted to secure gains, following a recent surge to its strongest point since late January.
After tracking deep in the overbought region in the past few days, toncoin’s RSI is now sitting at 65.19.
It appears that the next support point for price strength could be at 56.00, which may mean more profit-taking could be on the cards.
I have tried to bring the best possible outcome to this chart.
Hit the like button if you like it and share your charts in the comments section.
Thank you.

TON/USD 12hour UPDATE BY CRYPTO SANDERS !!hello, welcome to this TON/USD update by CRYPTO SANDERS.
CHART ANALYSIS:- Toncoin (TON) was one of today’s biggest movers, as markets were buoyed by the news that it was partnering with Telegram.
Following a low of 1.73 on Tuesday, TON/USD rose to an intraday peak of 1.95 earlier in the day.
This surge resulted in toncoin rising by as much as 13%, nearing a recent high of 2.05 in the process.
the move led to the relative strength index (RSI) colliding with a ceiling at the 66.00 level.
Earlier gains have since faded as a result of a failed breakout beyond this point, leading to TON now trading at 1.93.
In order to move above 2.00, the aforementioned ceiling on the RSI must first be broken.
I have tried to bring the best possible outcome to this chart.
Hit the like button if you like it and share your charts in the comments section.
Thank you