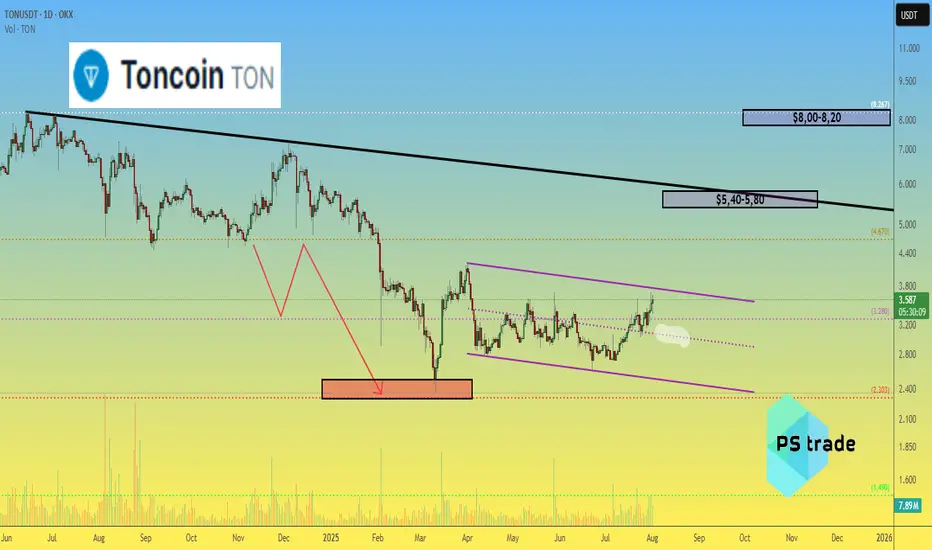
Toncoin TON price analysis💎 CRYPTOCAP:TON didn’t become a legend over the past 9 months — but at least our correction target of $2.30–2.50 played out with precision.
While most of the crypto market is currently going through a correction, #Toncoin keeps pushing upward. Still, we remain realistic:
🎯 First target: $5.40–5.80
🎯 Second target: $8.00–8.20
🚀 It’s not a “to the moon” scenario, but a potential 2x–3x from current levels is attractive.
The key support level OKX:TONUSDT remains at $3.00 — as long as it holds, the bullish trend remains valid.
TONUSD
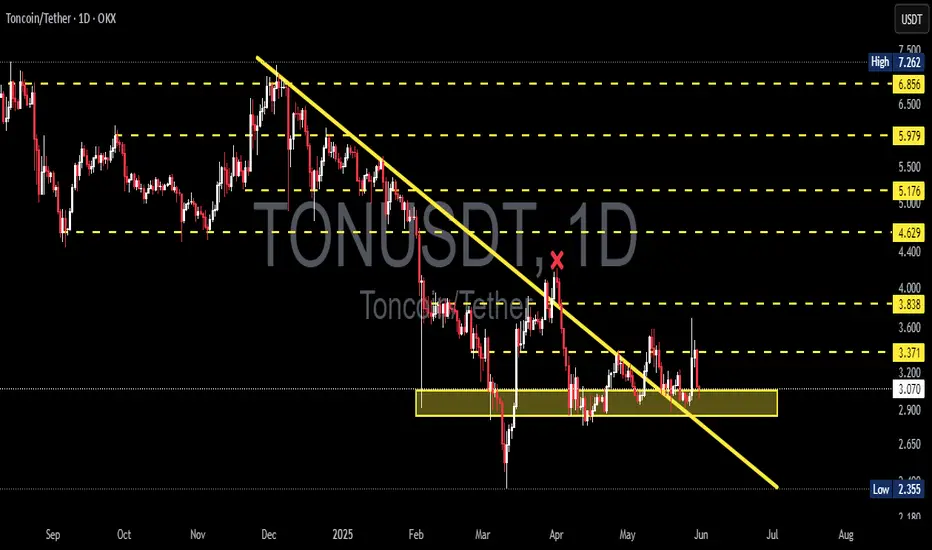
TONUSDT Breaks Out of Bearish Grip! Is a Bullish Rally?🔎 1. Key Pattern: Descending Trendline Breakout + Reaccumulation Zone
After months of downward pressure, TONUSDT has successfully broken above a dominant descending trendline that has been acting as resistance since December 2024.
✅ This breakout occurred with a strong bullish candle and aligns perfectly with a significant historical resistance zone (around $3.00–$3.12).
📌 The area also overlaps with the Fibonacci retracement levels (0.5–0.618) — a zone where trend reversals often occur.
This indicates that the move isn't just noise — it might be the start of a mid-term bullish trend.
---
🧱 2. Consolidation Box = Reaccumulation Zone
TONUSDT spent nearly 4 months ranging sideways between $2.80 and $3.20, forming a clear reaccumulation range.
🔁 This kind of price action often precedes a strong breakout, as smart money accumulates before the next leg up.
🟨 This box now acts as a critical demand/support zone for any potential pullbacks.
---
📏 3. Key Levels to Watch (Support & Resistance)
✅ Bullish Targets (Resistance Levels):
🔹 $3.5404 → Immediate resistance
🔹 $4.0492 → Major resistance to break
🔹 $4.6460
🔹 $5.1961
🔹 $5.9429
🔹 $6.9065
🔹 Local High: $7.2311
🔻 Support Levels:
🔸 $3.1248 – $3.0099 → Key Fibonacci support (0.5–0.618)
🔸 $2.8000 → Bottom of reaccumulation range
🔸 $2.3290 → Major support (also the cycle low)
---
📈 Bullish Scenario (Primary Bias)
If price holds above the key zone at $3.00–$3.12, we could see:
A move towards $3.54 USDT
Breakout above $3.54 opens the door to $4.05 → $4.64 → $5.19 and beyond
A clear structure of higher highs and higher lows confirms trend reversal
Momentum remains strong as long as price respects the breakout zone.
---
📉 Bearish Scenario (Alternative Case to Watch)
If price fails to hold above $3.00 and breaks back below $2.80:
This would suggest a false breakout
Momentum may shift bearish again
Price could revisit the $2.32 support, negating the bullish setup
A return to sideways or even downtrend structure is possible
---
🧩 Strategic Conclusion
TONUSDT has broken out of a key descending trendline and reclaimed a strong structural zone, indicating early signs of a bullish cycle.
📊 Key Levels to Monitor Closely:
Support (validation zone): $3.00–$3.12
Immediate resistance: $3.54
Mid-term targets: $4.05 → $5.19 and higher
> As long as TON stays above the golden zone (Fibonacci 0.5–0.618), bulls have the upper hand.
---
📘 Pro Tips for Traders:
Watch for volume confirmation during retests
Be patient for pullback entries or breakout confirmations
Manage risk — don’t FOMO blindly
#TONUSDT #TONCOIN #CryptoBreakout #AltcoinAnalysis #TechnicalAnalysis #CryptoTrading #TON #Reaccumulation #BreakoutSetup #FibonacciSupport #BullishReversal #TONBullish

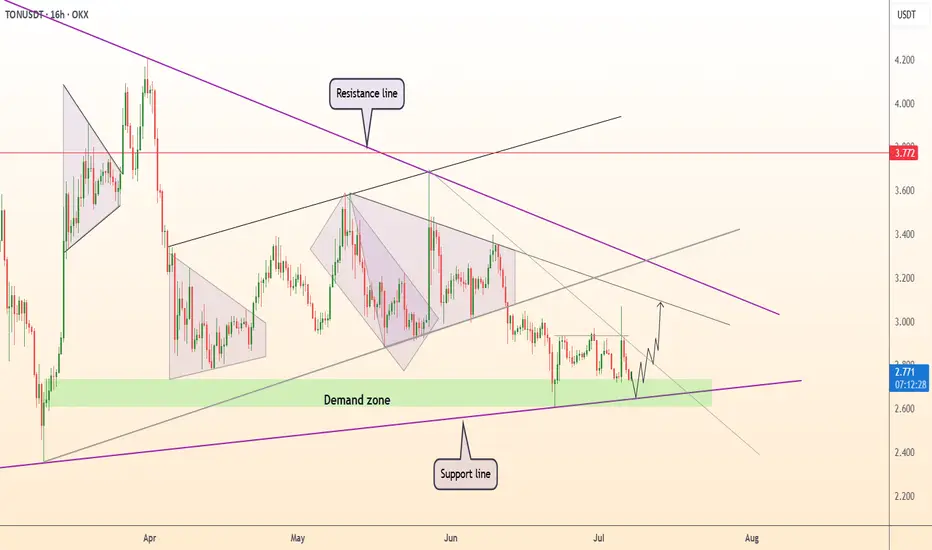
TONUSD TONUSDT TONCOIN mid- to long-termIn my view, we are still in the accumulation phase. The current price action and reactions at key levels suggest ongoing accumulation.
🔻 Bearish Scenarios:
In the short term, a retest of the lower boundary of the accumulation zone (purple box) is possible if the market weakens.
The worst-case scenario would be a move down to the lower green support zone, which has historically triggered strong bullish reactions. This is a critical demand area.
🔼 Bullish Scenarios:
A confirmed breakout and hold above the white line (within the purple box) would signal strength and a potential move higher.
We would then likely see a retest of the upper boundary of the accumulation zone.
A breakout and consolidation above the yellow line would open the door for a move toward the wider yellow channel, which could act as a final target zone
🚨 High-Risk Zone:
The yellow channel might represent the final phase of the current move.
From there, we could see either a sharp correction
Or, if trend strength and macro conditions allow, a continuation towards a new ATH (purple line).
📌 📌 📌 :
All marked lines and zones represent key support and resistance levels.
Price reaction at these areas will be crucial for decision-making.
As always, risk management and trend confirmation are essential.
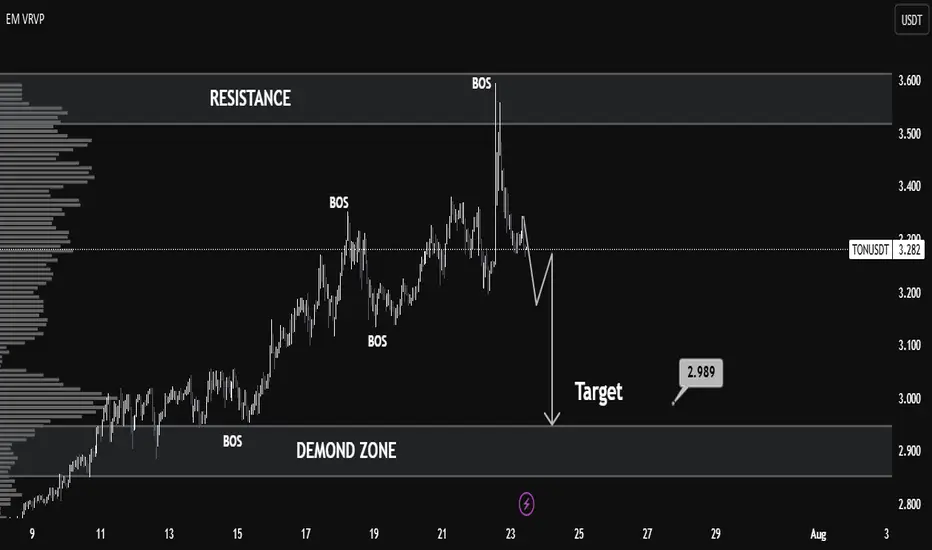
TONUSDT Technical Analysis – Bearish Shift with Clean TargetMarket Context:
TONUSDT recently showed strong bullish momentum, breaking multiple structure levels (noted as BOS – Break of Structure), indicating a clear uptrend. However, the most recent price action reveals a sharp rejection from the resistance zone around 3.55–3.60, marking a significant trend reversal.
Key Levels:
Resistance: 3.55 – 3.60
Price tested this zone and was strongly rejected, forming a potential top.
Demand Zone: 2.88 – 2.99
This zone provided previous accumulation and serves as a probable liquidity area and downside target.
Target: 2.989
The chart marks this as the near-term bearish objective, aligning with the volume node and prior demand.
Technical Signals:
Multiple BOS (Break of Structure):
Confirmed bullish structure earlier, but the latest BOS downward indicates a possible trend reversal.
Volume Profile (VRVP):
Shows high volume nodes around 3.00, suggesting strong market interest at lower levels — acting as a magnet for price.
Bearish Market Structure:
After the peak, the lower highs and lower lows pattern reflects short-term bearish dominance.
Liquidity Grab & Selloff:
The spike above resistance likely induced liquidity before a rapid selloff — classic distribution behavior.
Outlook:
If the market fails to reclaim levels above 3.35, a bearish continuation toward 2.989 remains likely.
The demand zone (2.88–2.99) is a critical area where buyers may re-enter — look for reversal signals here.
Conclusion:
TONUSDT has shifted from bullish to bearish in the short term. A clean rejection from resistance and strong structural breaks suggest a move toward the 2.989 demand zone. Traders should watch for confirmation of support or continuation upon reaching this level.
Ton USDT Intraday Setup / Long SetupTake with tight SL, an easy 2RR, take it at cmp (Current Market Price), While if you holding spot bag, it can easily hit 4.5-5$ mark in this week. Best Of Luck

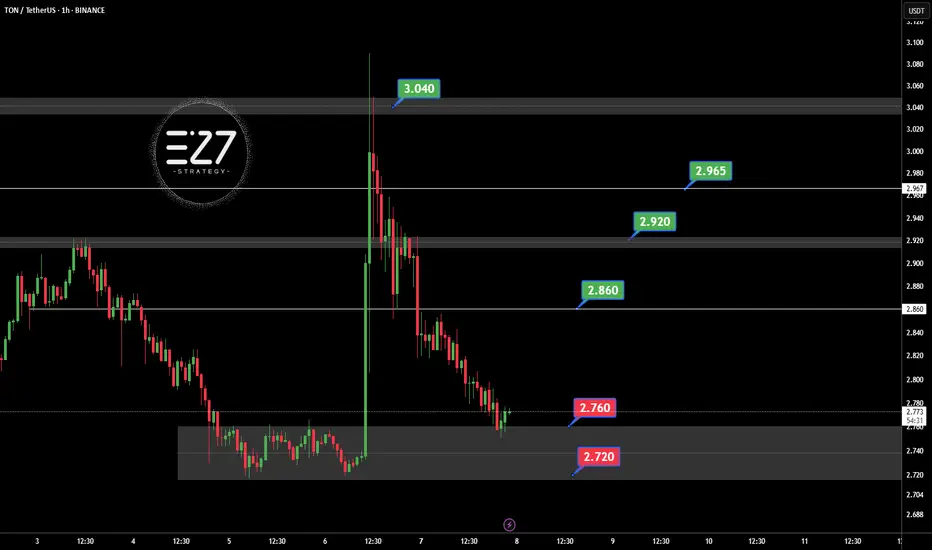
TONUSDT Following the official denial by UAE authorities regarding the possibility of obtaining a golden visa through staking OKX:TONUSDT , the bullish momentum driven by that rumor has faded. Selling pressure has increased, and TON is now consolidating within the key support zone of 2.720 to 2.760 USDT. If this support breaks, further downside is likely. However, if the price holds and reclaims the 2.860 USDT resistance, it could trigger a recovery toward 2.920 and 2.965 USDT. For now, the market sentiment remains bearish with a corrective bias.
Key Points:
UAE officially denied TON-based golden visa claims, weakening sentiment.
Current support zone: 2.720–2.760 USDT.
Key resistance: 2.860 USDT, then 2.920 USDT.
Break below 2.720 = further decline.
Break above 2.860 = potential bullish reversal.
⚠️ Please Control Risk Management in trades.
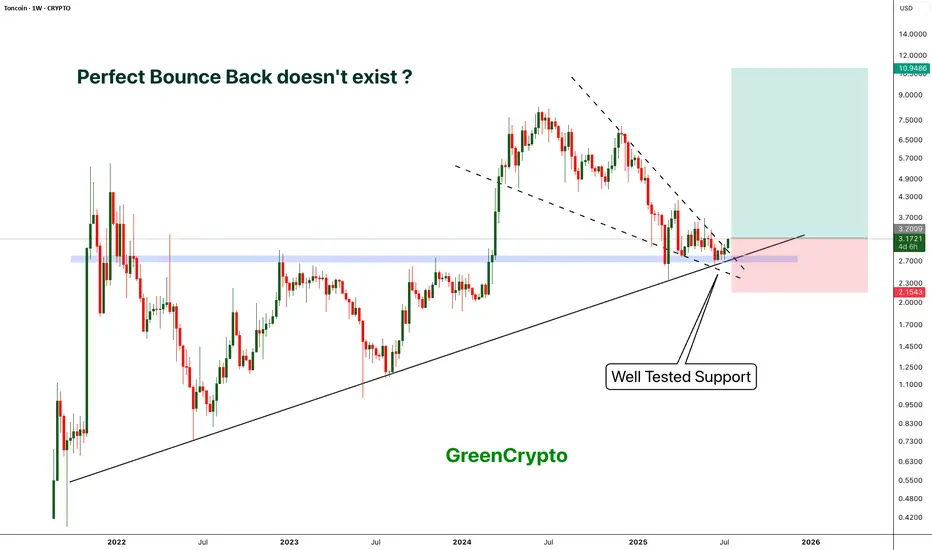
TON - Locked and Loaded for a perfect Reversal- TON is reversing perfectly from its long tested support
- On weekly chart we have clear bounce back and perfect candle.
- This is an excellent opportunity to enter
Entry Price: 3.17
Stop Loss: 2.15
TP1: 4.0796
TP2: 5.2629
TP3: 6.8383
TP4: 8.3298
TP5: 11.0191
Stay tuned for more updates.
Cheers
GreenCrypto
DeGRAM | TONUSD held the demand zone📊 Technical Analysis
● Price has just printed a third higher-low inside the green $2.60-2.75 demand zone and on the long-term purple trend line, forming a tight falling-wedge that is squeezing against $2.90 resistance.
● A 16 h close above $2.90 completes the wedge and opens the grey mid-channel target at $3.25; the pattern’s 1 : 1 swing and descending magenta resistance intersect at $3.77, offering follow-through scope.
💡 Fundamental Analysis
● Telegram’s plan to roll out the Ton-powered wallet to its global user base, alongside a new $115 M TON ecosystem fund, is expected to boost real-world demand and developer activity.
✨ Summary
Long $2.70-2.90; breakout > $2.90 aims for $3.25 → $3.77. Invalidate on a 16 h close below $2.58.
-------------------
Share your opinion in the comments and support the idea with a like. Thanks for your support!
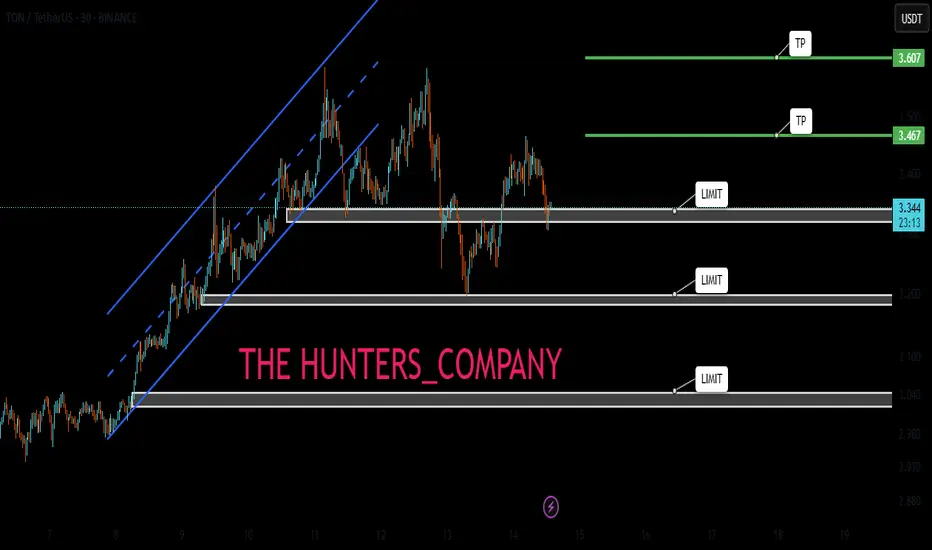
Today's signal is TONHello friends
Given the price growth after reaching resistance, it has entered a correction, which provides a good opportunity to buy in stages and with capital management and move to the specified targets.
*Trade safely with us*
TON New Update (1D)This analysis is an update of the analysis you see in the "Related publications" section
Since we started publishing a series of bearish analyses on TON, the coin has experienced a significant drop | despite the ongoing growth of the Telegram app and its expanding user base.
Before reaching the support zone mentioned in our previous analysis, a strong intermediate demand zone is visible along the way, located just below a notable liquidity pool. A solid bullish reaction is expected from this identified demand area.
Targets are clearly marked on the chart.
A daily candle close below the invalidation level will invalidate this analysis.
For risk management, please don't forget stop loss and capital management
When we reach the first target, save some profit and then change the stop to entry
Comment if you have any questions
Thank You

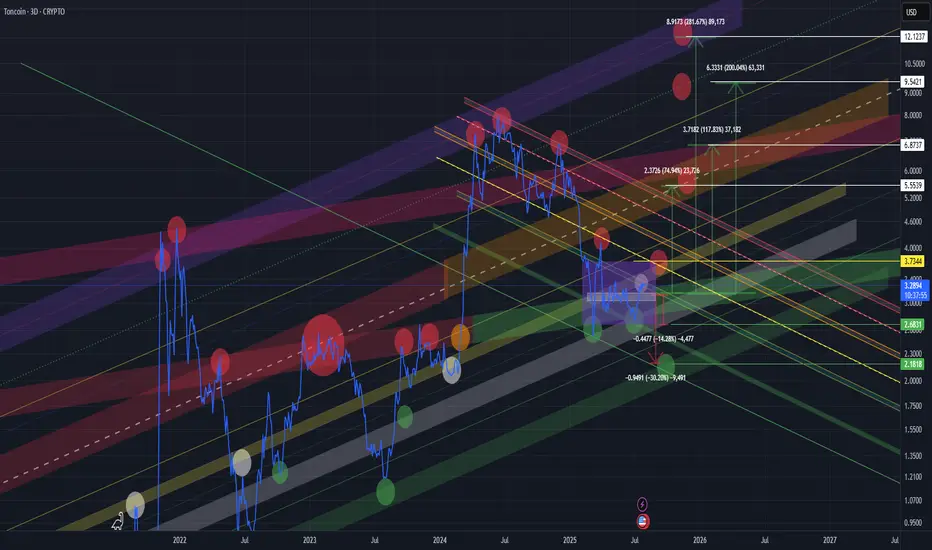
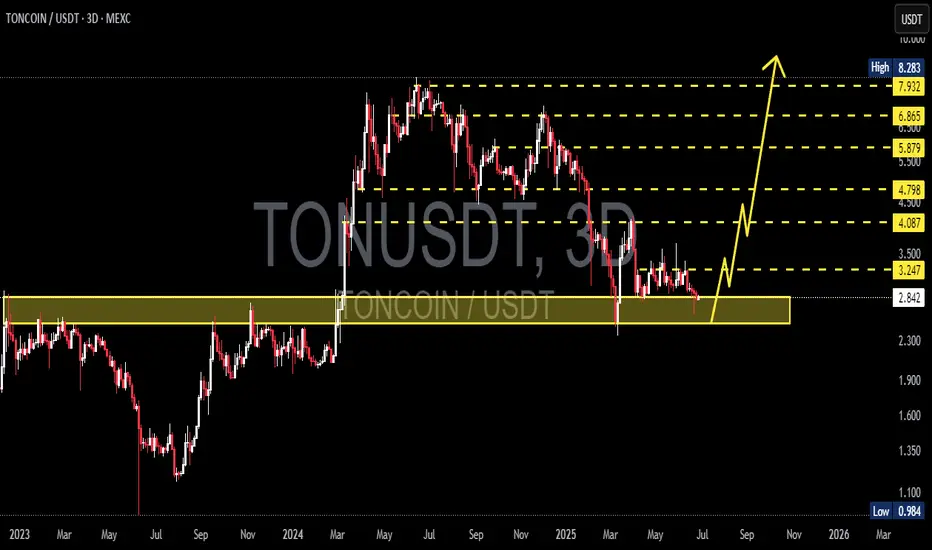
TONCOIN Preparing for Liftoff from the Golden Zone! Potential UpDetailed Breakdown:
🔶 Major Support Zone (Golden Accumulation Area):
TON is currently trading within a strong support zone between 2.839 - 2.300, which previously acted as a key resistance throughout 2023. This zone now serves as a high-probability accumulation area.
🔶 Double Bottom Structure & Reversal Potential:
The price action is forming a potential double bottom pattern, often signaling a major reversal after a prolonged downtrend. This is also supported by sideways consolidation on the support with decreasing selling momentum.
🔶 Bullish Targets (Based on Fibonacci & Historical Resistance):
If a bounce occurs from this golden support area, TON could rally towards the following key resistance levels:
🎯 Target 1: 3.247
🎯 Target 2: 4.087
🎯 Target 3: 4.798
🎯 Target 4: 5.879
🎯 Target 5: 6.865
🎯 Target 6: 7.932
🎯 Ultimate Target (ATH): 8.283
🔶 Maximum Potential Upside:
From the current level (around 2.839) to the all-time high (8.283), TON presents a +190% upside opportunity in a full bullish scenario.
Trading Strategy:
✅ Buy Zone: Accumulate within the golden support box (2.3 - 2.8 USDT)
🔁 Additional Entry: Upon breakout confirmation above 3.25 USDT
❌ Stop Loss: Below 2.2 USDT with strong bearish volume
📈 Take Profit Levels: Use resistance levels as partial TP targets
Conclusion:
TONCOIN is positioned at a technically significant support area, offering a high-risk-reward opportunity for swing traders and mid-term investors. A bullish reaction from this zone could initiate a strong multi-wave rally. Watch for breakout confirmation with volume before entering aggressively.
#TON #TONCOIN #CryptoBreakout #AltcoinSetup #TONUSDT #SwingTrade #BullishPattern #CryptoSignals #FibonacciLevels #TechnicalAnalysis
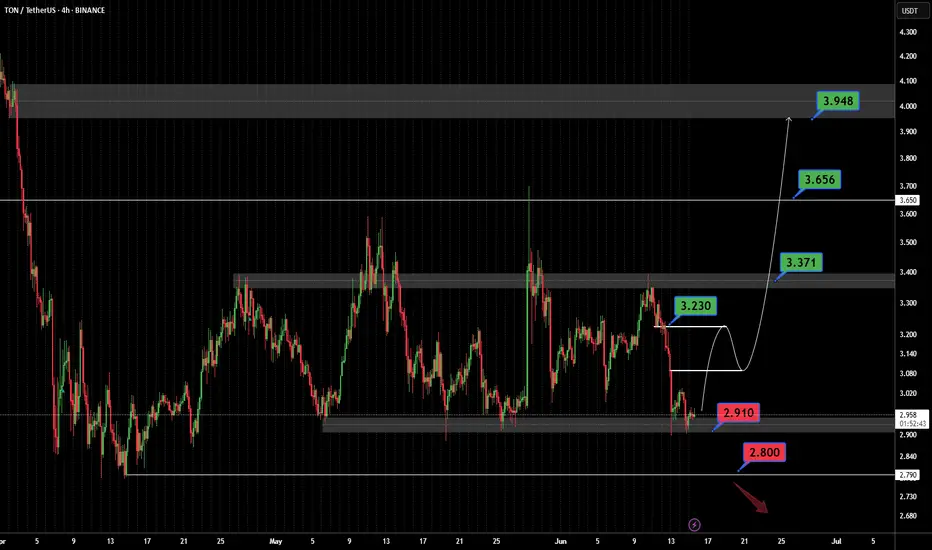
TONUSDT On the @TONUSDT chart, price is currently making a corrective move after reacting to the key support at 2.800. It may rise toward the 3.230 resistance and potentially break higher with a pullback to continue upward. However, if the 2.800 support fails, a deeper drop could follow. ⚠️📉
Resistances:
• 3.230 💥
• 3.371 🔼
• 3.656 🔼
• 3.948 🚀
Supports:
• 2.910 🛡️
• 2.800 🔻
⚠️Contorl Risk management for trades.
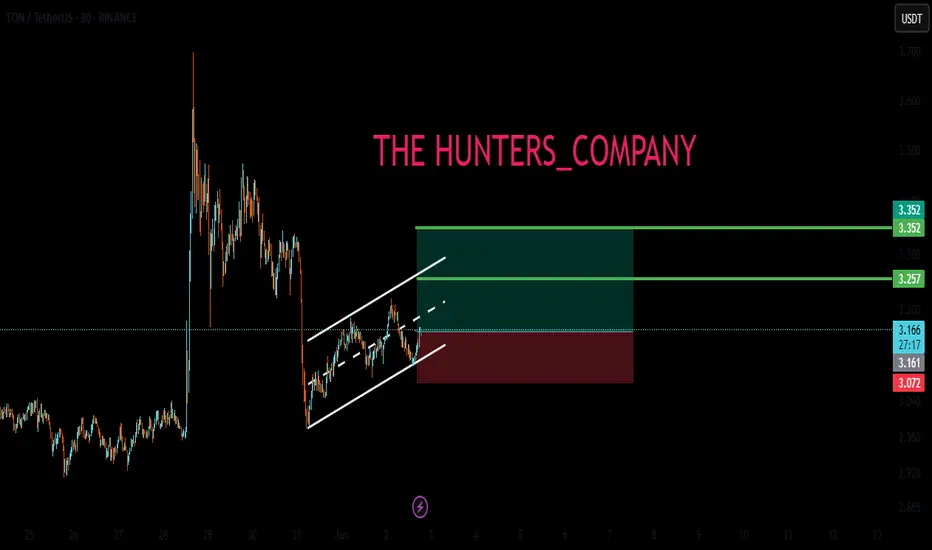
LIVE TRADEHello friends
Given the ascending channel that has formed, we can open positions with capital and risk management to move towards the specified goals.
*Trade safely with us*
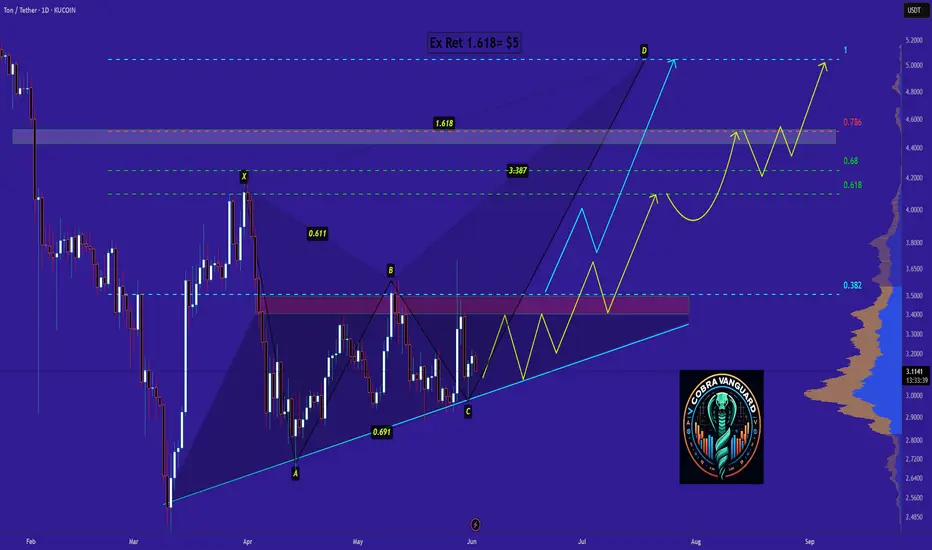
TON AB=CD Analysis !!!Currently, TON is forming an ascending triangle, indicating a potential price increase. It is anticipated that the price could rise, aligning with the projected price movement (AB=CD).
However, it is crucial to wait for the triangle to break before taking any action.
Best regards CobraVanguard.💚
TONUSDT 1D AnalysisTON ~ 1D Analysis
#TON Buy back gradually from here with a short term target of at least 15%+, Long term target $8
#TON/USDT#TON
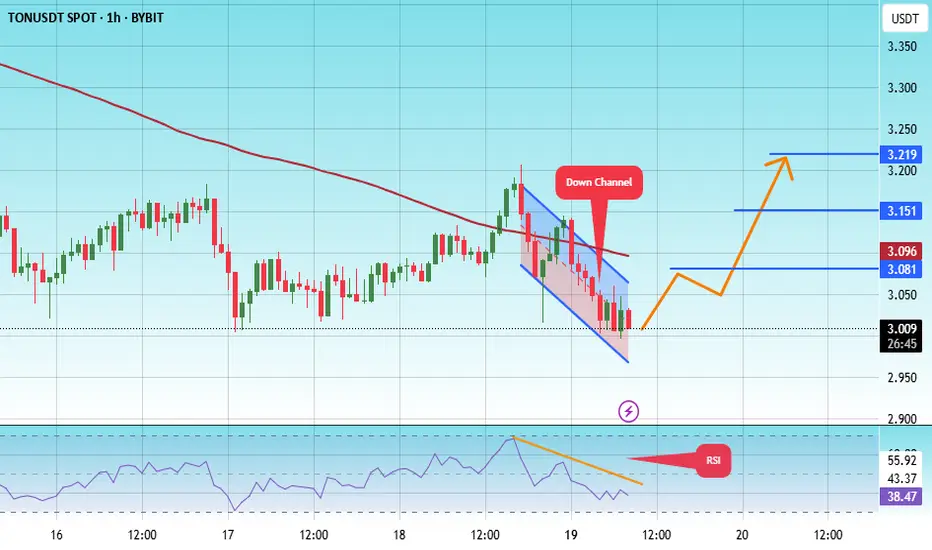
The price is moving within a descending channel on the 1-hour frame, adhering well to it, and is heading for a strong breakout and retest.
We are experiencing a rebound from the lower boundary of the descending channel, which is support at 3.20.
We are experiencing a downtrend on the RSI indicator, which is about to break and retest, supporting the upward trend.
We are looking for stability above the 100 Moving Average.
Entry price: 3.30
First target: 3.41
Second target: 3.53
Third target: 3.69

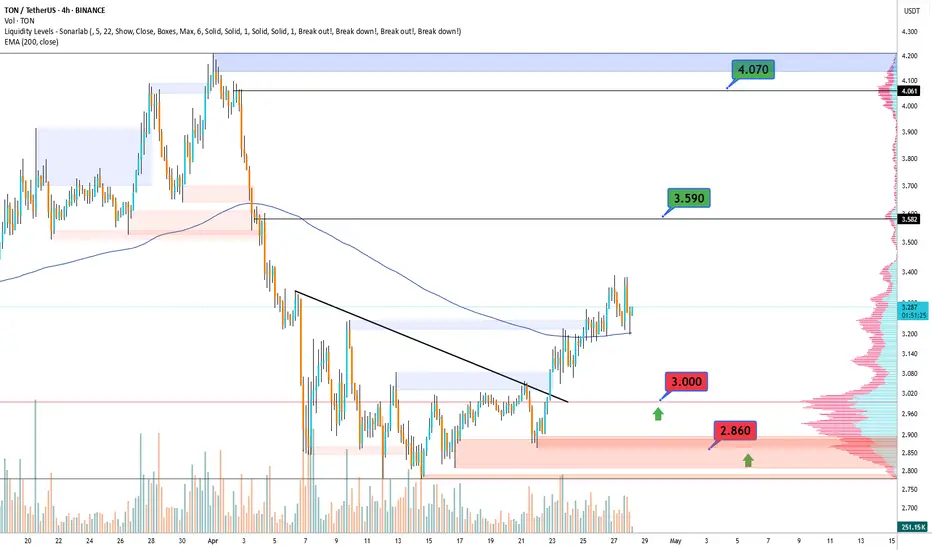
TONCOINCRYPTOCAP:TON In the 4-hour timeframe, key support and resistance zones have been identified based on significant highs and lows. The primary resistance area is at $4.070, while the main support level is at $2.860. A descending trendline has been drawn, and the price trading below the 200-period moving average suggests continued bearish momentum in this time horizon. However, if the near-term resistance at $3.590 is broken, a potential upward movement towards the primary resistance at $4.070 could occur. Conversely, a break below the immediate support at $3.000 might lead to a price decrease towards the main support level at $2.860. To confirm bullish or bearish scenarios, monitoring for valid breakouts of these levels along with volume analysis and other technical tools is essential.
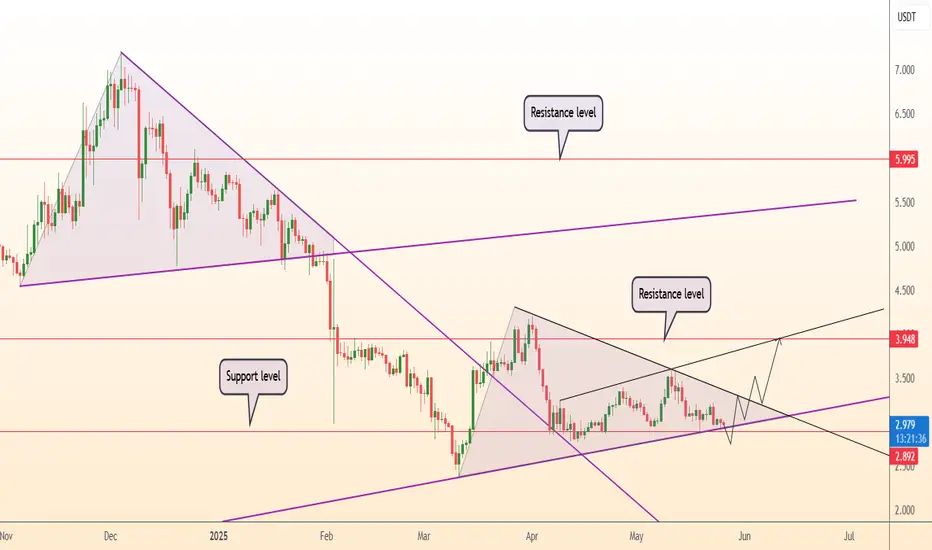
DeGRAM | TONUSD forming the new triangle📊 Technical Analysis
● Price exited a 6-month falling wedge, retested the purple breakout line near $2.90 and is printing successive higher lows inside a nascent up-sloping channel.
● The wedge’s 0.618 projection and horizontal cap align at the $3.95 resistance band; holding above the $2.89 support trend keeps that target in play, with the long-term ceiling at $5.99 next.
💡 Fundamental Analysis
● Telegram has begun routing merchant payments through TON rails, broadening real-world demand for the token.
● Recent on-chain data show earlier long-term holders taking profit near $5 yet buyers quickly absorbed supply, signalling underlying bid strength ahead of another push higher.
✨ Summary
Buy dips toward $2.90-3.00; as long as the breakout line holds, look for $3.50 then $3.95. Bull thesis void on a weekly close below $2.82.
-------------------
Share your opinion in the comments and support the idea with a like. Thanks for your support!
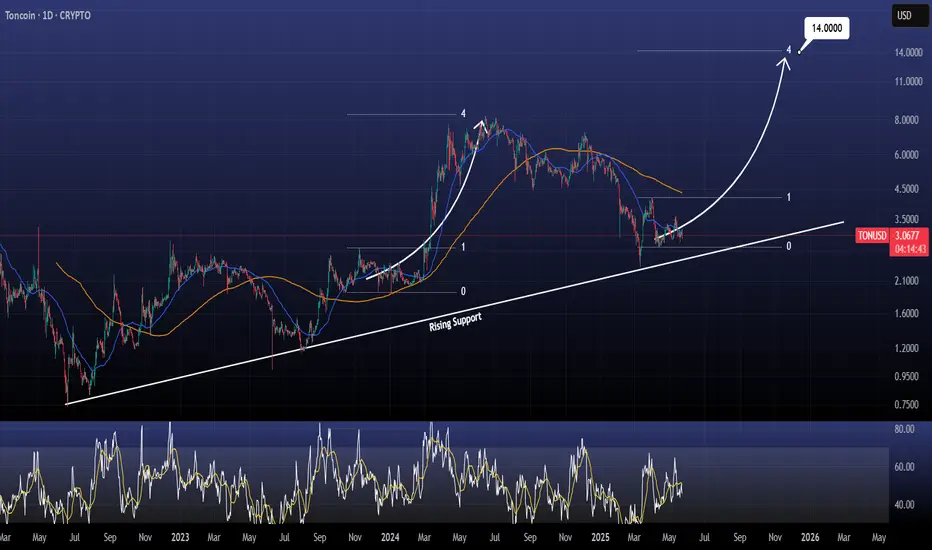
TONUSD forming the new bottom. Target $14.000.Toncoin / TONUSD is consolidatind just over its long term Rising Support.
The last time it did this, the price started a parabolic rise to the 4.0 Fibonacci extension.
Buy and target 14.000.
Follow us, like the idea and leave a comment below!!
#TON/USDT#TON
The price is moving within a descending channel on the 1-hour frame, adhering well to it, and is heading towards a strong breakout and retest.
We are experiencing a rebound from the lower boundary of the descending channel, which is support at 2.97.
We are experiencing a downtrend on the RSI indicator, which is about to break and retest, supporting the upward trend.
We are looking for stability above the 100 Moving Average.
Entry price: 3.02
First target: 3.05
Second target: 3.15
Third target: 3.22
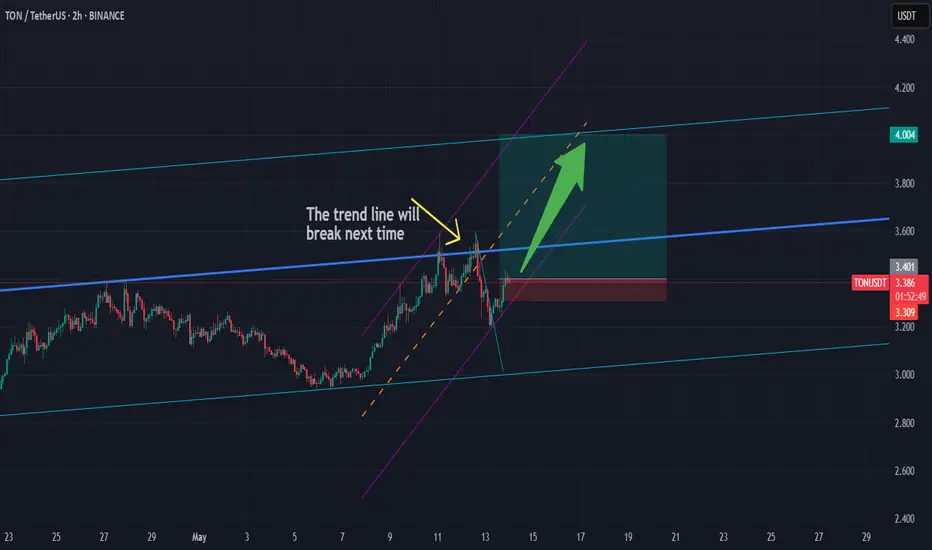
Long TON/USDTThe trend line touch two times and in the next time will break,
We are in the parallel channel and go up,
First target is 4$ soon.
Good Luck..
TON breakout alert!!CRYPTOCAP:TON chart Update!
TON has officially broken out of a multi-month symmetrical triangle on the daily chart, signaling a potential trend reversal after a long downtrend.
📈 Clean breakout above descending resistance
🔼 Entry triggered around $3.44
🎯 Targets ahead:
TP1: $4.12
TP2: $4.88
TP3: $5.67
As long as the price stays above the breakout zone, bulls are in control. A successful retest could offer another great entry!
If you find this analysis helpful, please hit the like button to support my content! Share your thoughts in the comments, and feel free to request any specific chart analysis you’d like to see.
Happy Trading!!

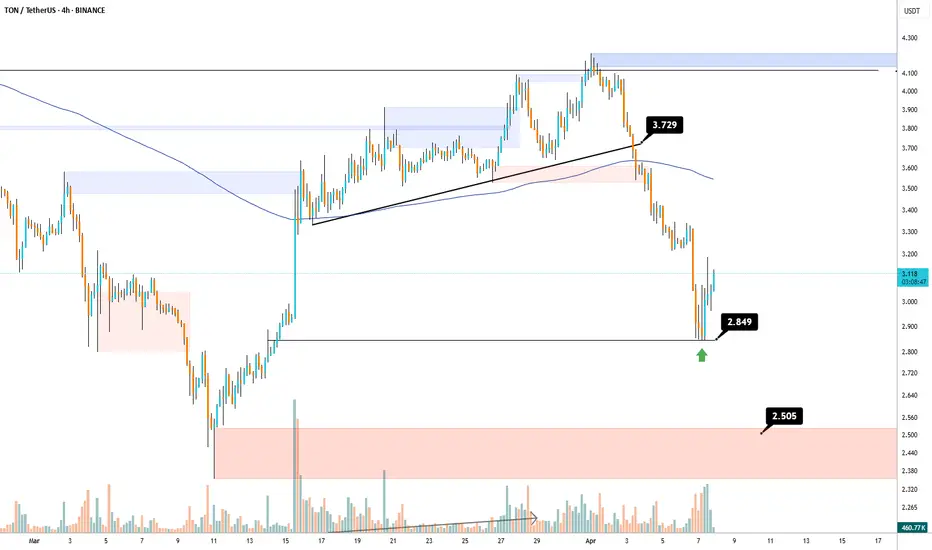
TON Bullish📉 TON/USDT 4H Analysis:
After breaking below the key support at 3.729, TON saw a sharp drop toward 2.849, where it found a strong bullish reaction. A short-term bullish correction is currently underway, but resistance at 3.3–3.4 and the 200 EMA may limit further upside. If TON fails to break through, it could retest 2.849 or drop to the 2.505 demand zone. For a true bullish reversal, a confirmed breakout and consolidation above 3.729 is essential.