#TON/USDT#TON
The price is moving within an ascending channel on the 1-hour frame, adhering well to it, and is on its way to break it strongly upwards and retest it.
We have support from the lower boundary of the ascending channel, at 3.05.
We have a downtrend on the RSI indicator that is about to break and retest, supporting the upside.
There is a major support area in green at 3.03, which represents a strong basis for the upside.
Don't forget a simple thing: ease and capital.
When you reach the first target, save some money and then change your stop-loss order to an entry order.
For inquiries, please leave a comment.
We have a trend to hold above the 100 Moving Average.
Entry price: 3.20.
First target: 3.40.
Second target: 3.53.
Third target: 3.70.
Don't forget a simple thing: ease and capital.
When you reach your first target, save some money and then change your stop-loss order to an entry order.
For inquiries, please leave a comment.
Thank you.
Tonusdtlong
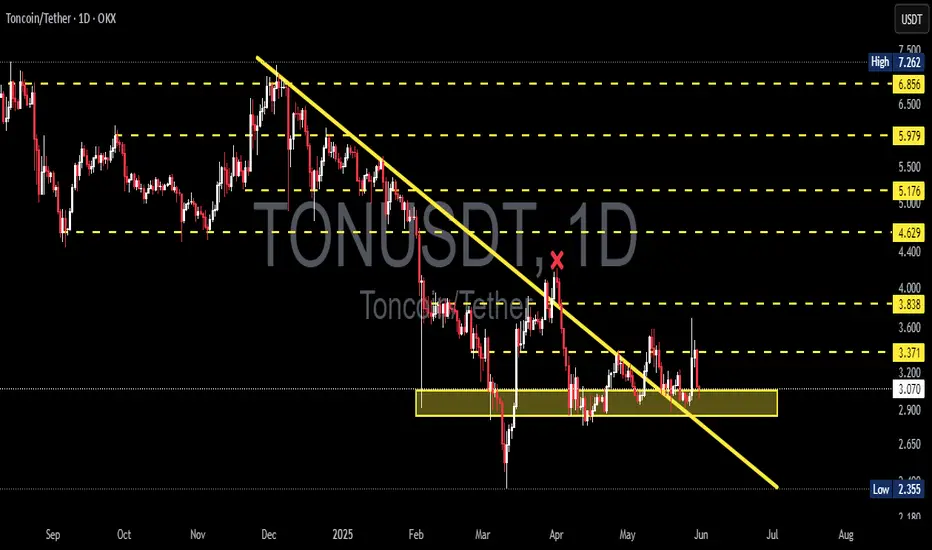
TONUSDT Breaks Out of Bearish Grip! Is a Bullish Rally?🔎 1. Key Pattern: Descending Trendline Breakout + Reaccumulation Zone
After months of downward pressure, TONUSDT has successfully broken above a dominant descending trendline that has been acting as resistance since December 2024.
✅ This breakout occurred with a strong bullish candle and aligns perfectly with a significant historical resistance zone (around $3.00–$3.12).
📌 The area also overlaps with the Fibonacci retracement levels (0.5–0.618) — a zone where trend reversals often occur.
This indicates that the move isn't just noise — it might be the start of a mid-term bullish trend.
---
🧱 2. Consolidation Box = Reaccumulation Zone
TONUSDT spent nearly 4 months ranging sideways between $2.80 and $3.20, forming a clear reaccumulation range.
🔁 This kind of price action often precedes a strong breakout, as smart money accumulates before the next leg up.
🟨 This box now acts as a critical demand/support zone for any potential pullbacks.
---
📏 3. Key Levels to Watch (Support & Resistance)
✅ Bullish Targets (Resistance Levels):
🔹 $3.5404 → Immediate resistance
🔹 $4.0492 → Major resistance to break
🔹 $4.6460
🔹 $5.1961
🔹 $5.9429
🔹 $6.9065
🔹 Local High: $7.2311
🔻 Support Levels:
🔸 $3.1248 – $3.0099 → Key Fibonacci support (0.5–0.618)
🔸 $2.8000 → Bottom of reaccumulation range
🔸 $2.3290 → Major support (also the cycle low)
---
📈 Bullish Scenario (Primary Bias)
If price holds above the key zone at $3.00–$3.12, we could see:
A move towards $3.54 USDT
Breakout above $3.54 opens the door to $4.05 → $4.64 → $5.19 and beyond
A clear structure of higher highs and higher lows confirms trend reversal
Momentum remains strong as long as price respects the breakout zone.
---
📉 Bearish Scenario (Alternative Case to Watch)
If price fails to hold above $3.00 and breaks back below $2.80:
This would suggest a false breakout
Momentum may shift bearish again
Price could revisit the $2.32 support, negating the bullish setup
A return to sideways or even downtrend structure is possible
---
🧩 Strategic Conclusion
TONUSDT has broken out of a key descending trendline and reclaimed a strong structural zone, indicating early signs of a bullish cycle.
📊 Key Levels to Monitor Closely:
Support (validation zone): $3.00–$3.12
Immediate resistance: $3.54
Mid-term targets: $4.05 → $5.19 and higher
> As long as TON stays above the golden zone (Fibonacci 0.5–0.618), bulls have the upper hand.
---
📘 Pro Tips for Traders:
Watch for volume confirmation during retests
Be patient for pullback entries or breakout confirmations
Manage risk — don’t FOMO blindly
#TONUSDT #TONCOIN #CryptoBreakout #AltcoinAnalysis #TechnicalAnalysis #CryptoTrading #TON #Reaccumulation #BreakoutSetup #FibonacciSupport #BullishReversal #TONBullish

Ton USDT Buy Setup / Long SetupTon entry at current market price 3.305 , SL if 1 day closes below the mentioned zone. Otherwise holding ton for breakout towards 4-4.5$. use low risk amount as BTC can retrace.
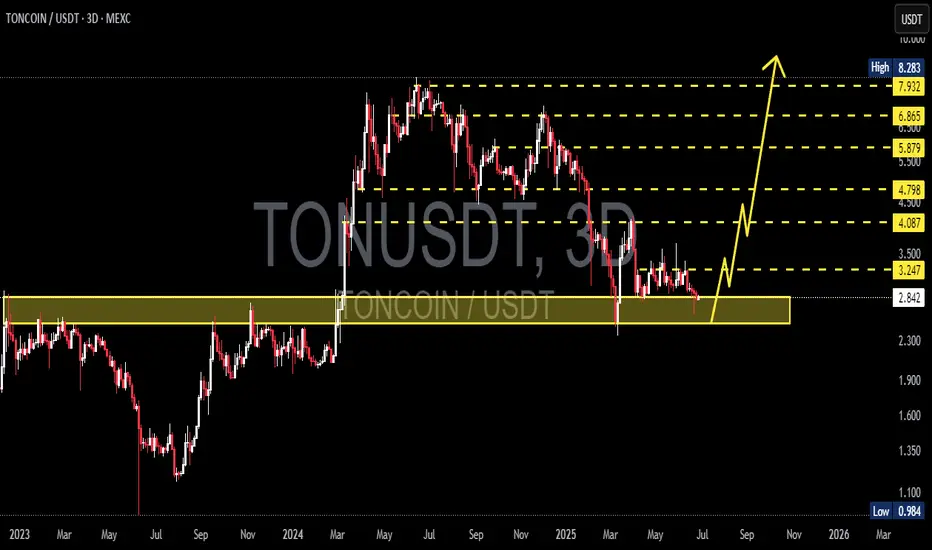
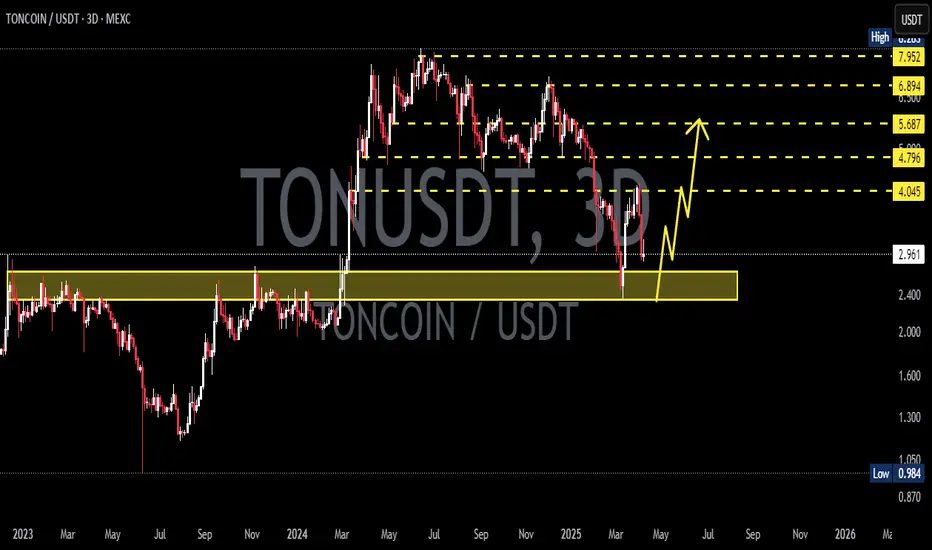
TONCOIN Preparing for Liftoff from the Golden Zone! Potential UpDetailed Breakdown:
🔶 Major Support Zone (Golden Accumulation Area):
TON is currently trading within a strong support zone between 2.839 - 2.300, which previously acted as a key resistance throughout 2023. This zone now serves as a high-probability accumulation area.
🔶 Double Bottom Structure & Reversal Potential:
The price action is forming a potential double bottom pattern, often signaling a major reversal after a prolonged downtrend. This is also supported by sideways consolidation on the support with decreasing selling momentum.
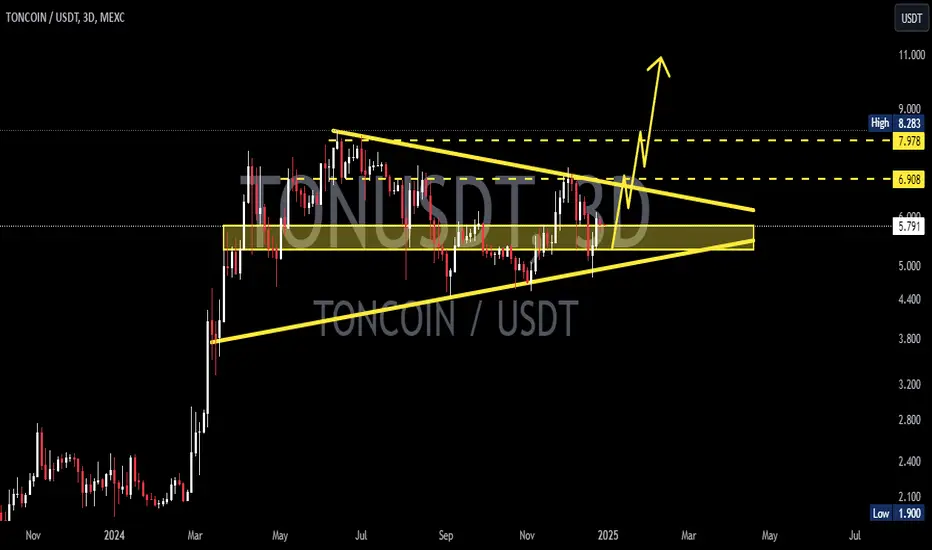
🔶 Bullish Targets (Based on Fibonacci & Historical Resistance):
If a bounce occurs from this golden support area, TON could rally towards the following key resistance levels:
🎯 Target 1: 3.247
🎯 Target 2: 4.087
🎯 Target 3: 4.798
🎯 Target 4: 5.879
🎯 Target 5: 6.865
🎯 Target 6: 7.932
🎯 Ultimate Target (ATH): 8.283
🔶 Maximum Potential Upside:
From the current level (around 2.839) to the all-time high (8.283), TON presents a +190% upside opportunity in a full bullish scenario.
Trading Strategy:
✅ Buy Zone: Accumulate within the golden support box (2.3 - 2.8 USDT)
🔁 Additional Entry: Upon breakout confirmation above 3.25 USDT
❌ Stop Loss: Below 2.2 USDT with strong bearish volume
📈 Take Profit Levels: Use resistance levels as partial TP targets
Conclusion:
TONCOIN is positioned at a technically significant support area, offering a high-risk-reward opportunity for swing traders and mid-term investors. A bullish reaction from this zone could initiate a strong multi-wave rally. Watch for breakout confirmation with volume before entering aggressively.
#TON #TONCOIN #CryptoBreakout #AltcoinSetup #TONUSDT #SwingTrade #BullishPattern #CryptoSignals #FibonacciLevels #TechnicalAnalysis
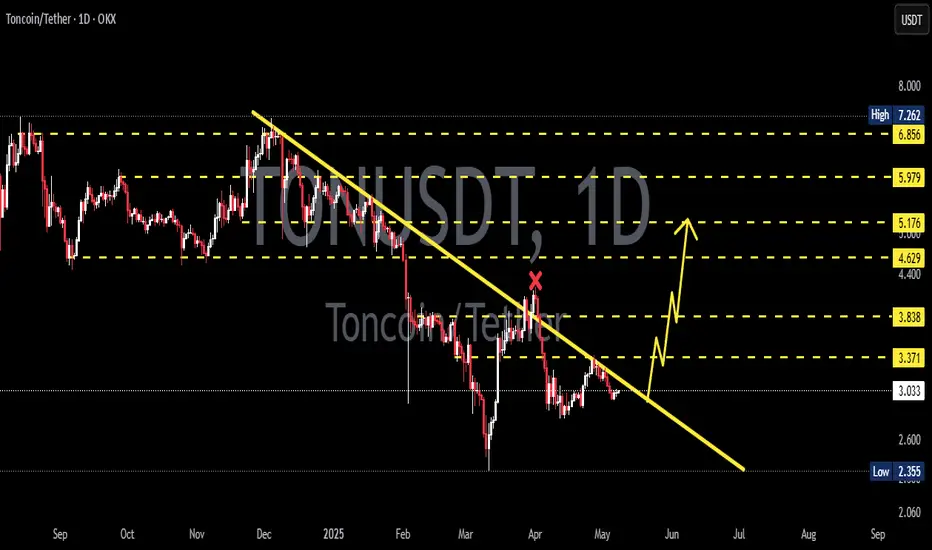
TONUSDT 1D AnalysisTON ~ 1D Analysis
#TON Buy back gradually from here with a short term target of at least 15%+, Long term target $8
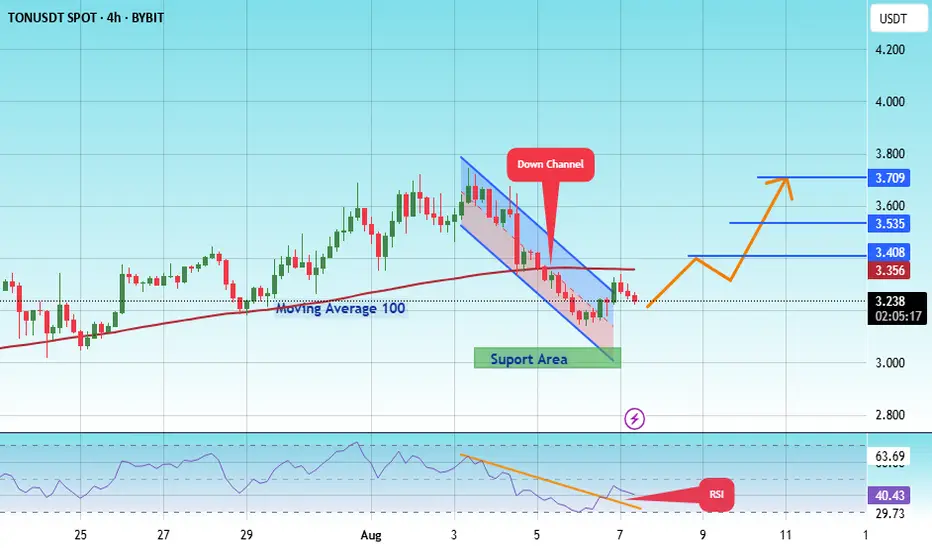
#TON/USDT#TON
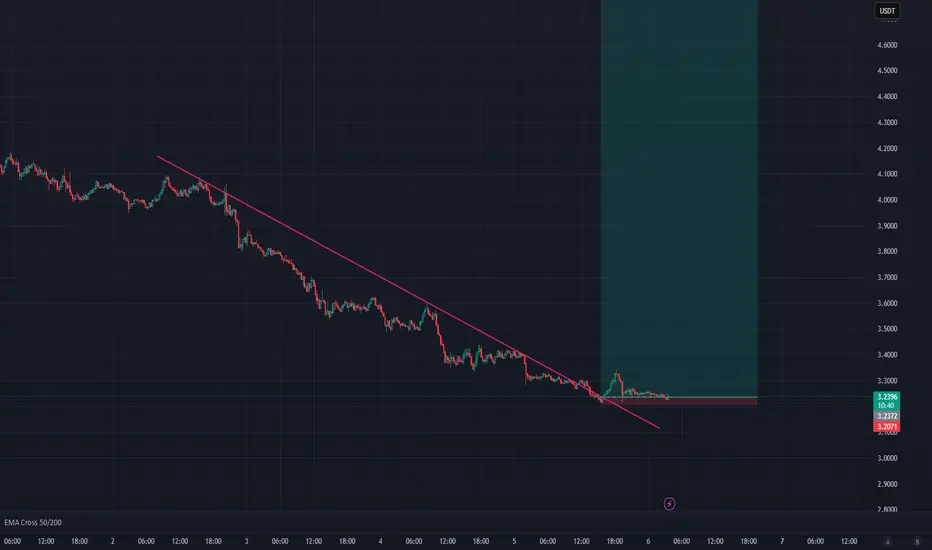
The price is moving within a descending channel on the 1-hour frame, adhering well to it, and is heading for a strong breakout and retest.
We are experiencing a rebound from the lower boundary of the descending channel, which is support at 3.20.
We are experiencing a downtrend on the RSI indicator, which is about to break and retest, supporting the upward trend.
We are looking for stability above the 100 Moving Average.
Entry price: 3.30
First target: 3.41
Second target: 3.53
Third target: 3.69

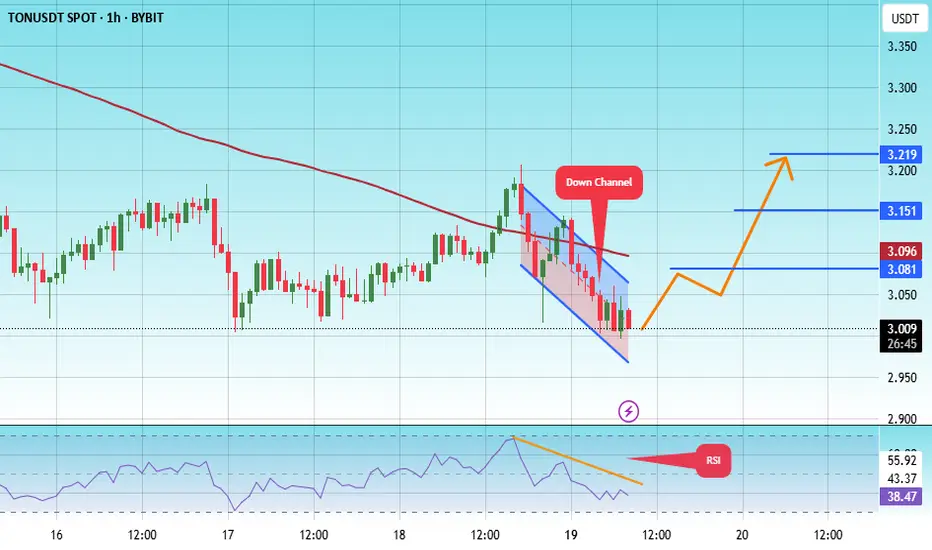
#TON/USDT#TON
The price is moving within a descending channel on the 1-hour frame, adhering well to it, and is heading towards a strong breakout and retest.
We are experiencing a rebound from the lower boundary of the descending channel, which is support at 2.97.
We are experiencing a downtrend on the RSI indicator, which is about to break and retest, supporting the upward trend.
We are looking for stability above the 100 Moving Average.
Entry price: 3.02
First target: 3.05
Second target: 3.15
Third target: 3.22
TONUSDT 1D AnalysisTON ~ 1D Analysis
#TON Buy after successfully breaking this resistance line with a short term target of at least 15%+ from here.
#TON/USDT#TON
The price is moving within a descending channel on the 1-hour frame and is expected to continue lower.
We have a trend to stabilize below the 100 moving average once again.
We have a downtrend on the RSI indicator, supporting the upward move with a breakout.
We have a resistance area at the upper limit of the channel at 3.73.
Entry price: 3.69
First target: 3.60
Second target: 3.515
Third target: 3.40

TONUSDT 3DTON ~ 3D Analysis
#TON Buy back when testing this support with a short -term target of at least 20%+.
TONUSDT long move aheadthe TONUSDT erpetual contract has taken serious damage in this correction so its time for a relief rally upwards, long position open now lest go for some sweet action
#TON #TONUSDT #TONCOIN #LONG #Scalp #Scalping #Eddy#TON #TONUSDT #TONCOIN #LONG #Scalp #Scalping #Eddy
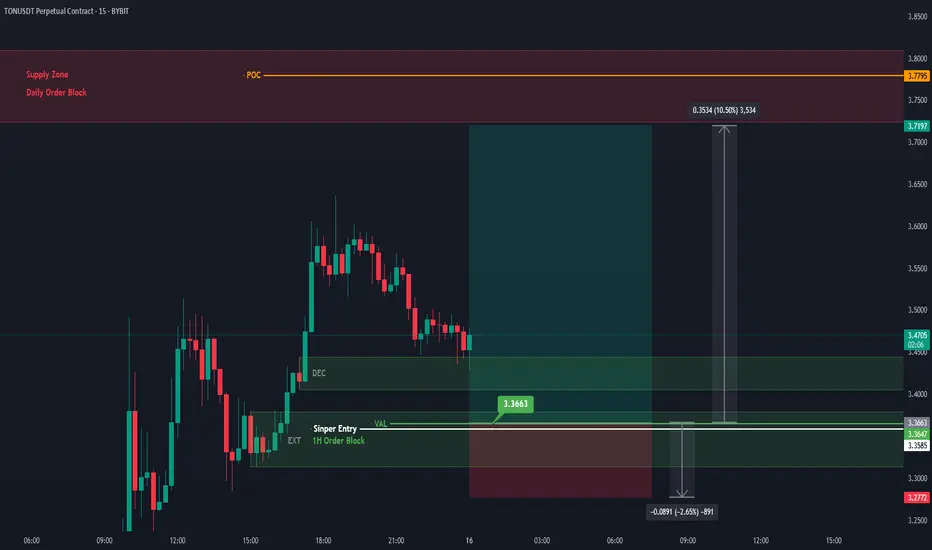
TONUSDT.P Scaliping Long Setup
Important areas of the upper time frame for scalping are identified and named.
This setup is based on a combination of different styles, including the volume style with the ict style.
Based on your strategy and style, get the necessary confirmations for this scalping setup to enter the trade.
Don't forget risk and capital management.
The entry point, take profit point, and stop loss point are indicated on the chart along with their amounts.
The responsibility for the transaction is yours and I have no responsibility for not observing your risk and capital management.
Be successful and profitable.
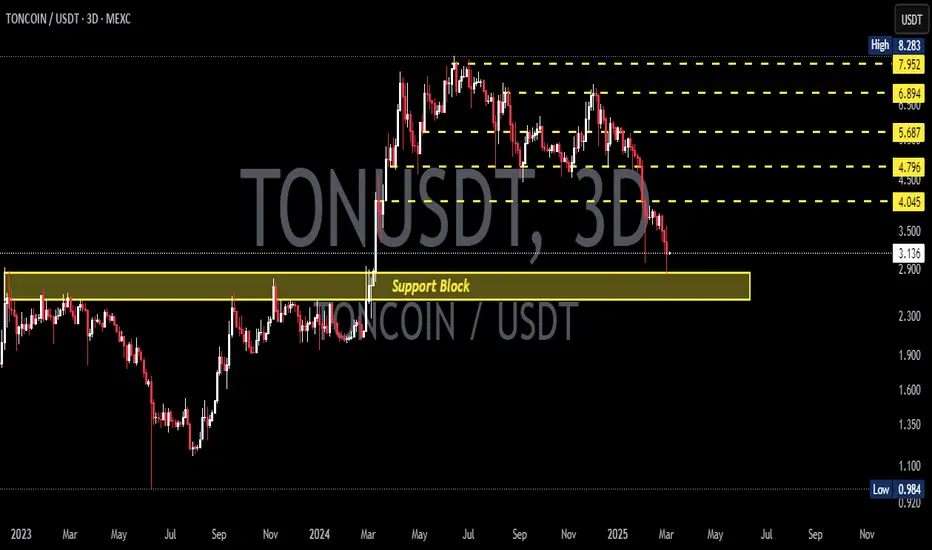
TONUSDT 3DTON ~ 3D Analysis
#TON Support blocks that you might be able to consider to start buying again from here, with a short -term target of at least 15%+.
TONUSDT 2DTON ~ 2D Analysis
#TON Buy gradually from here. This is a very good buy place for now. With a short -term target of at least 15%+.
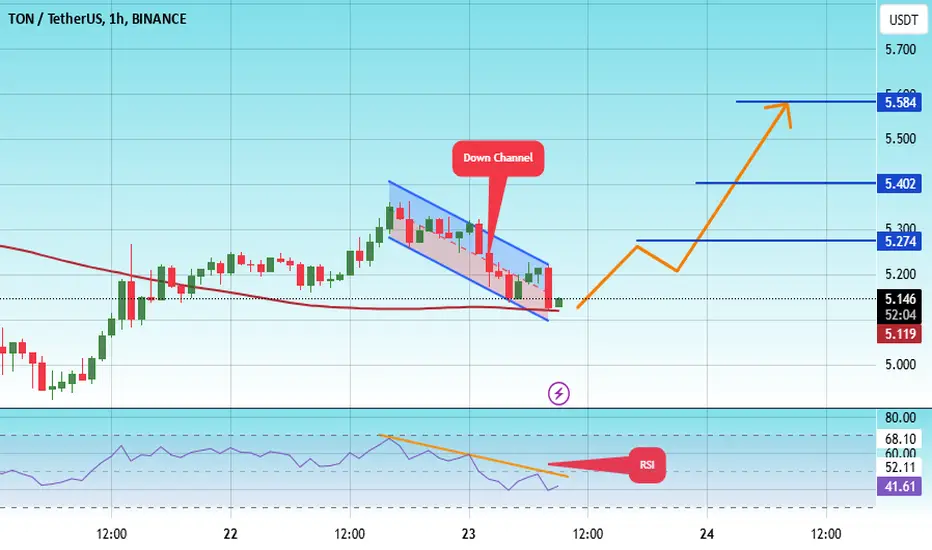
#TON/USDT Ready to go higher#TON
The price is moving in a descending channel on the 1-hour frame and sticking to it well
We have a bounce from the lower limit of the descending channel, this support is at 5.10
We have a downtrend on the RSI indicator that is about to break, which supports the rise
We have a trend to stabilize above the moving average 100
Entry price 5.13
First target 5.27
Second target 5.40
Third target 5.58
TONUSDT 3DTON ~ 3D
#TON If you still have Conviction on this coin,. buy gradually within this support block with a target of at least 20%+

TON, sellers are showing their weakness, it's a good time to buyTON, sellers are showing their weakness, it's a good time to buy
Three times sellers tried to sell the price lower, and the movement each time became smaller, the last movement with no volume showed the complete powerlessness of sellers, and gives a good entry point to buy. I'm going in with a potential of 1:4
🚀 Trade with the professionals of THS - Wave Theory!
🔹 All trades are based on wave analysis.
🔹 Fixed stop loss and take profit for risk management.
🔹 100% automation: copy trades through CopyFX service.
🔹 Reliability and transparency: the results are confirmed by the market.
📈 Don't miss the chance to earn steadily!
👉 Connect to CopyFX with THS and start copying profitable trades right now!
💡 Details on our channel and in the app!
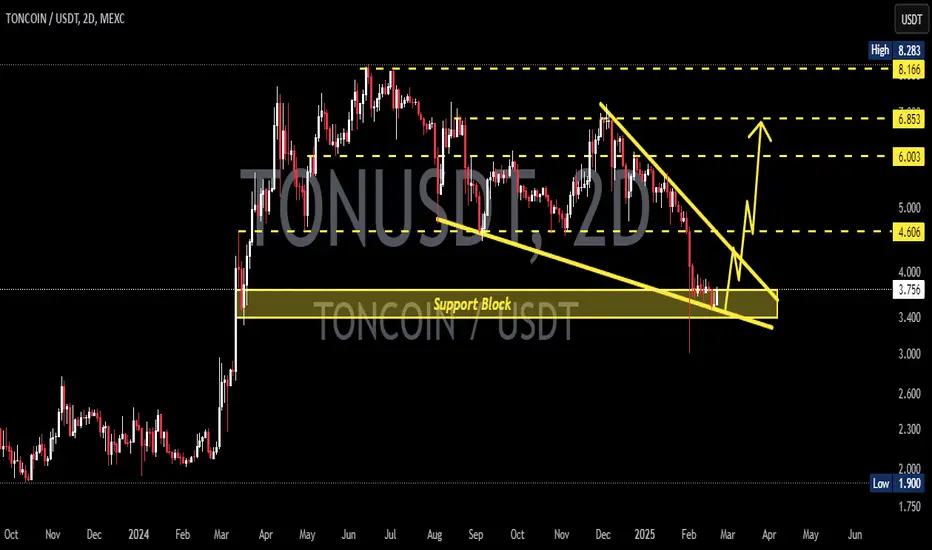
TONUSDT 3DTON ~ 3D
#TON This is a bullish pattern,. Buy gradually inside this pattern,. with a target of at least 20%+ from here. it is only a matter of time that this resistance line is successfully penetrated.
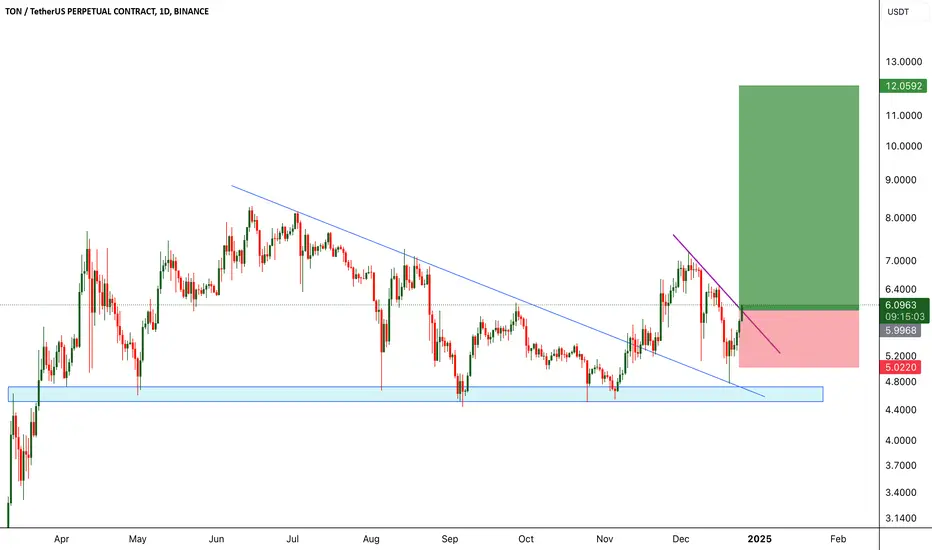
TONUSDT Primed for Liftoff After Rebounding from Key SupportOKX:TONUSDT has shown impressive resilience with a strong bounce off a major support level. This positive price action is further reinforced by a breakout from a prevailing trendline, accompanied by robust trading volume. These technical indicators suggest a potential for significant upward movement in the near future. While the outlook is bullish, it's crucial to manage risk effectively by implementing appropriate stop-loss orders to protect your investment.
OKX:TONUSDT Currently trading at $6
Buy level: Above $6
Stop loss: Below $5
Target : $12
Max Leverage 3x
Always keep Stop loss
Follow Our Tradingview Account for More Technical Analysis Updates, | Like, Share and Comment Your thoughts
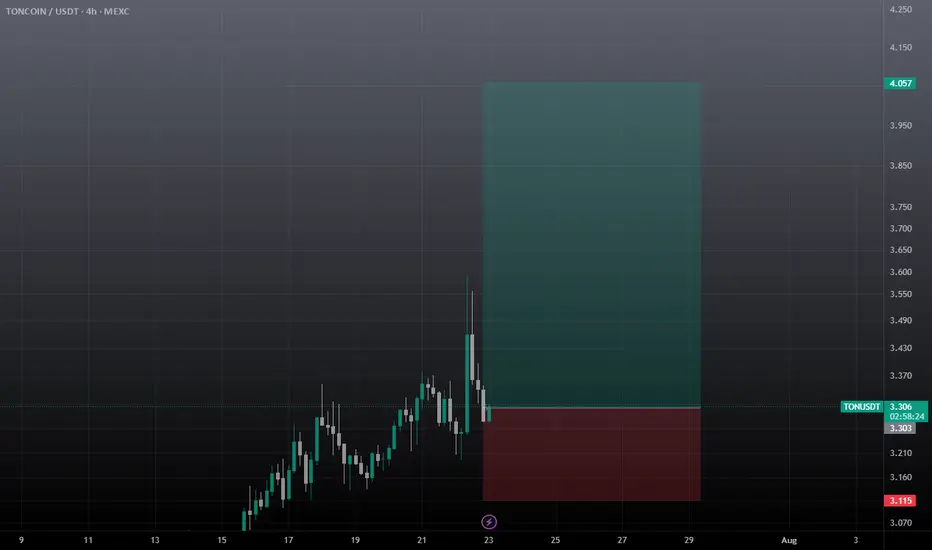
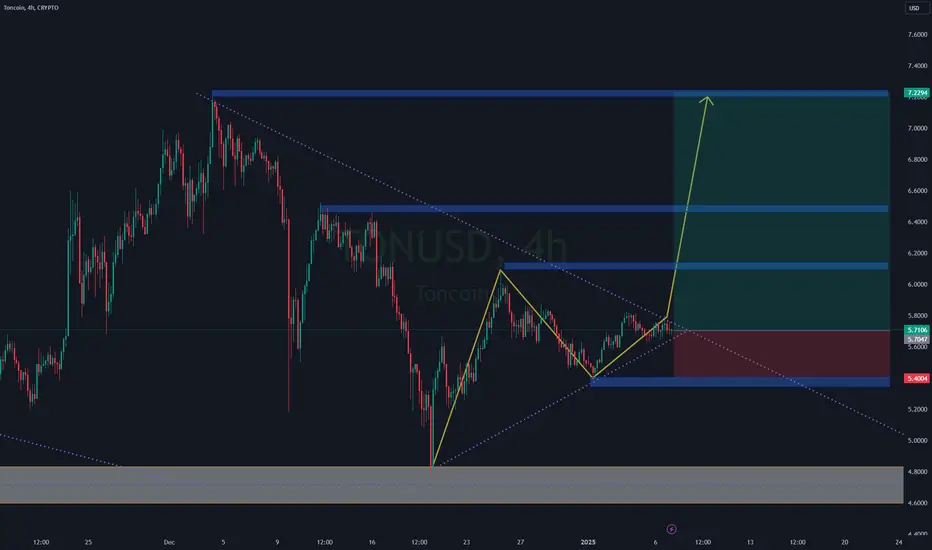
TONUSDT idea follow upHello Traders,
As we mentioned in previous idea, we will wait for a Long setup after hitting the supply zone as shown.
As we can see, it dropped to the buy zone and recover very fast, right now it looks like an accumulation for a Long setup.
If you have interest in this idea, you could monitor it closely from now.
Crypto is highly risky, please do your own research before investing.
Enjoy!

TONUSDT Quick Live Trading / Setup and SettingsOKX:TONUSDT
OKX:TONUSDT
📈Which side you pick?
Bull or Bear
SL1 ---> Low-risk status: 3x-4x Leverage
SL2 ---> Mid-risk status: 5x-8x Leverage
(If there is just one SL on the chart, I suggest, low risk status)
👾Note: The setup is active but expect the uncertain phase as well. also movement lines drawn to predict future price reactions are relative and approximate.
➡️Entry Area:
Yellow zone -
⚡️TP:
5.617
5.782
5.91 (Optimistic)
🔴SL:
5.255
🧐The Alternate scenario:
If the price stabilizes against the direction of the position, below or above the trigger zone, the setup will be canceled.

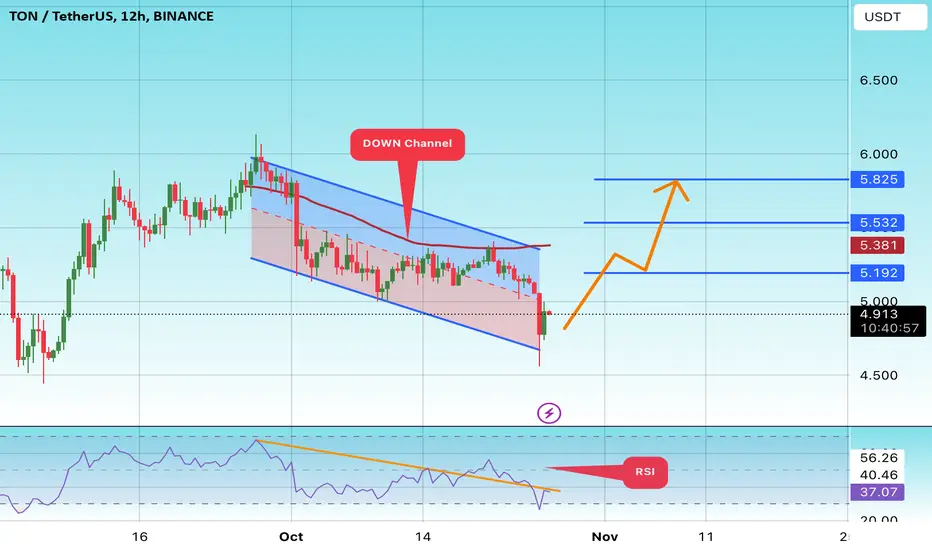
#TON/USDT#TON
The price is moving in a descending channel on the 12-hour frame upwards and is expected to continue.
We have a trend to stabilize above the moving average 100 again.
We have a descending trend on the RSI indicator that supports the rise by breaking it upwards.
We have a support area at the lower limit of the channel at a price of 4.60.
Entry price 4.80.
First target 5.20.
Second target 5.52.
Third target 5.82.
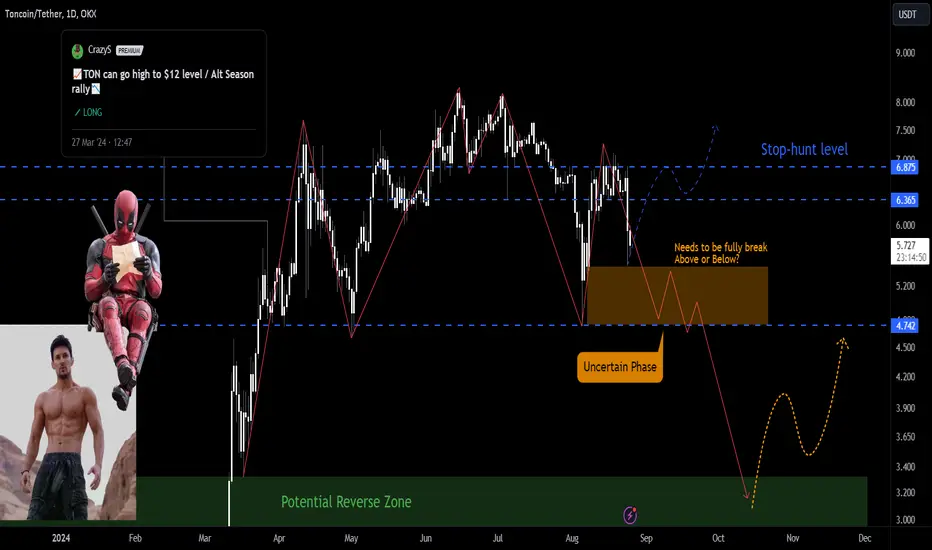
TON Analysis / Do you think Paul can regain controls?OKX:TONUSDT
BINANCE:TONUSDT
CRYPTO:TONUSD
Analysis of the scenarios facing Ton Coin
▶The price has now entered the shock phase and It started a bearish rally from the Stop Hunt range.
If Ton downward movement considered as an excellent buying offers for investors, and the news of Pavel's arrest calms down in the next few hours, the price can touch the Stop Hunt level again.
Of course, this scenario is not at all suitable for trading and analysis, and it's just a hopeful prediction of the price.
📉🔍On the other scenario, the price downward rally is more accurate in my opinion. The news of the arrest is going to disturb the market for some time and this issue will gradually shift the price to lower support levels.
But what do we do?
⚡As I said before, TON price is worth much more than what it is, and it is quite possible to reach the $12 level within the next year. But in the current situation, finding profitable buying levels should be the most important goal of medium-term market traders.
In the above analysis, the PRZ level will provide an excellent buying zone.
Even in a hopeful scenario, the second best level to buy Ton is inside the yellow zone. Of course, I myself prepare a much smaller volume for buying in this area.
After the yellow level, until the price reaches PRZ, I will buy two more steps with the Bollinger Midline indicator or MA 50.
But the main zone for me is near the PRZ area.