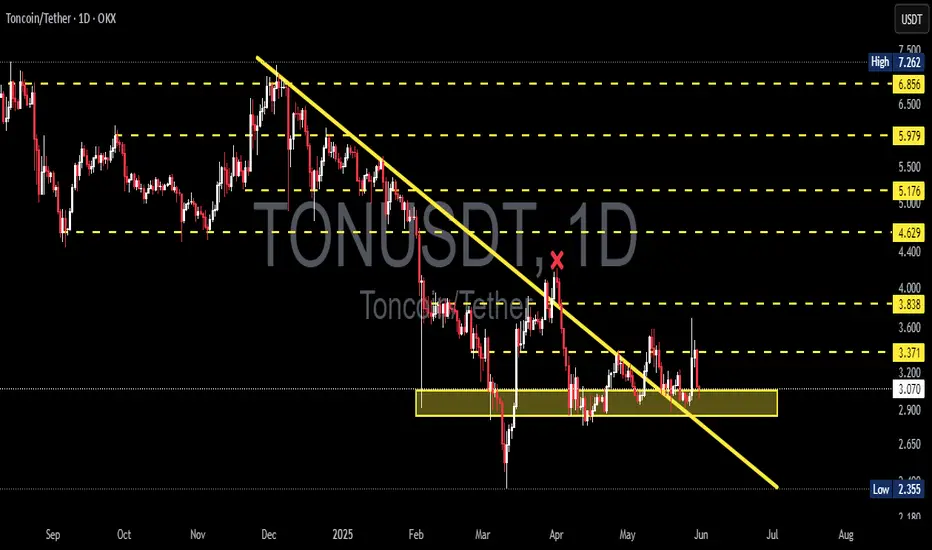
TONUSDT Breaks Out of Bearish Grip! Is a Bullish Rally?🔎 1. Key Pattern: Descending Trendline Breakout + Reaccumulation Zone
After months of downward pressure, TONUSDT has successfully broken above a dominant descending trendline that has been acting as resistance since December 2024.
✅ This breakout occurred with a strong bullish candle and aligns perfectly with a significant historical resistance zone (around $3.00–$3.12).
📌 The area also overlaps with the Fibonacci retracement levels (0.5–0.618) — a zone where trend reversals often occur.
This indicates that the move isn't just noise — it might be the start of a mid-term bullish trend.
---
🧱 2. Consolidation Box = Reaccumulation Zone
TONUSDT spent nearly 4 months ranging sideways between $2.80 and $3.20, forming a clear reaccumulation range.
🔁 This kind of price action often precedes a strong breakout, as smart money accumulates before the next leg up.
🟨 This box now acts as a critical demand/support zone for any potential pullbacks.
---
📏 3. Key Levels to Watch (Support & Resistance)
✅ Bullish Targets (Resistance Levels):
🔹 $3.5404 → Immediate resistance
🔹 $4.0492 → Major resistance to break
🔹 $4.6460
🔹 $5.1961
🔹 $5.9429
🔹 $6.9065
🔹 Local High: $7.2311
🔻 Support Levels:
🔸 $3.1248 – $3.0099 → Key Fibonacci support (0.5–0.618)
🔸 $2.8000 → Bottom of reaccumulation range
🔸 $2.3290 → Major support (also the cycle low)
---
📈 Bullish Scenario (Primary Bias)
If price holds above the key zone at $3.00–$3.12, we could see:
A move towards $3.54 USDT
Breakout above $3.54 opens the door to $4.05 → $4.64 → $5.19 and beyond
A clear structure of higher highs and higher lows confirms trend reversal
Momentum remains strong as long as price respects the breakout zone.
---
📉 Bearish Scenario (Alternative Case to Watch)
If price fails to hold above $3.00 and breaks back below $2.80:
This would suggest a false breakout
Momentum may shift bearish again
Price could revisit the $2.32 support, negating the bullish setup
A return to sideways or even downtrend structure is possible
---
🧩 Strategic Conclusion
TONUSDT has broken out of a key descending trendline and reclaimed a strong structural zone, indicating early signs of a bullish cycle.
📊 Key Levels to Monitor Closely:
Support (validation zone): $3.00–$3.12
Immediate resistance: $3.54
Mid-term targets: $4.05 → $5.19 and higher
> As long as TON stays above the golden zone (Fibonacci 0.5–0.618), bulls have the upper hand.
---
📘 Pro Tips for Traders:
Watch for volume confirmation during retests
Be patient for pullback entries or breakout confirmations
Manage risk — don’t FOMO blindly
#TONUSDT #TONCOIN #CryptoBreakout #AltcoinAnalysis #TechnicalAnalysis #CryptoTrading #TON #Reaccumulation #BreakoutSetup #FibonacciSupport #BullishReversal #TONBullish
Tonusdtsignal

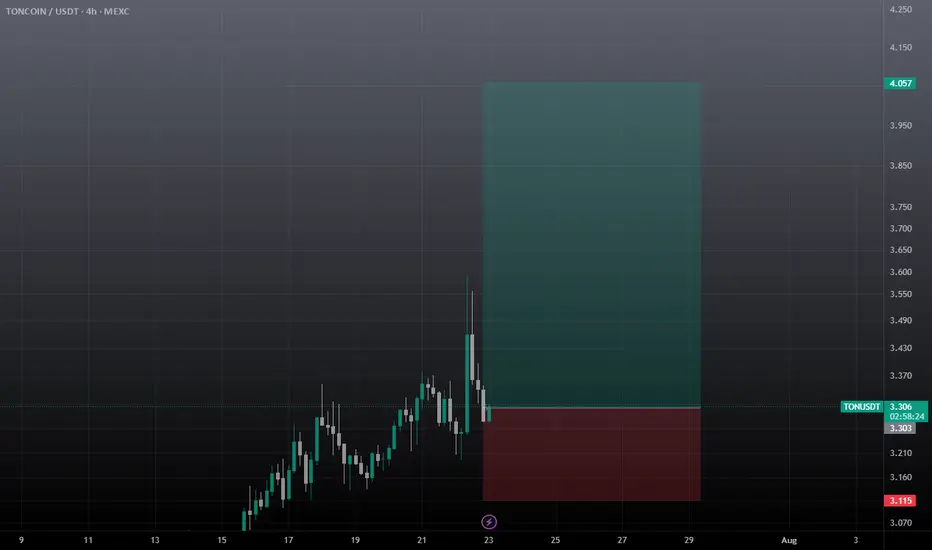
Ton USDT Buy Setup / Long SetupTon entry at current market price 3.305 , SL if 1 day closes below the mentioned zone. Otherwise holding ton for breakout towards 4-4.5$. use low risk amount as BTC can retrace.
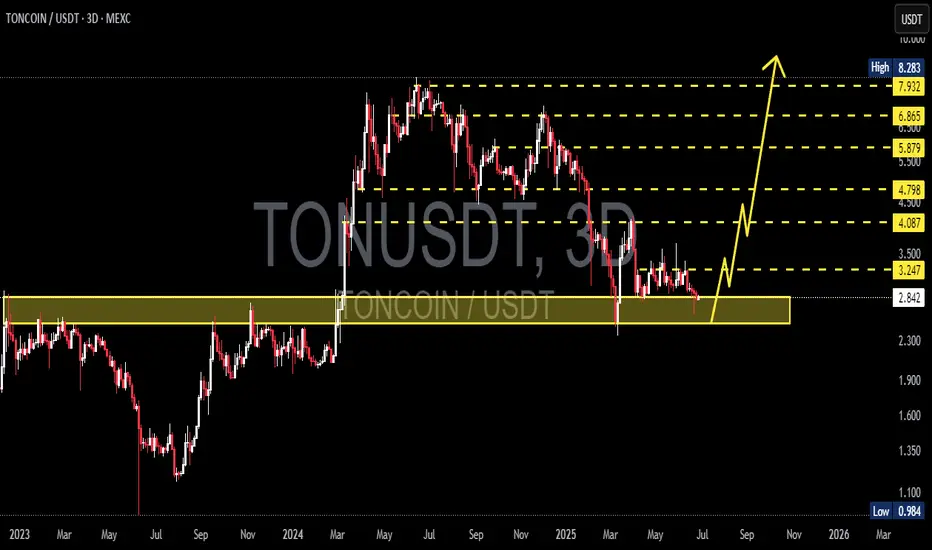
TONCOIN Preparing for Liftoff from the Golden Zone! Potential UpDetailed Breakdown:
🔶 Major Support Zone (Golden Accumulation Area):
TON is currently trading within a strong support zone between 2.839 - 2.300, which previously acted as a key resistance throughout 2023. This zone now serves as a high-probability accumulation area.
🔶 Double Bottom Structure & Reversal Potential:
The price action is forming a potential double bottom pattern, often signaling a major reversal after a prolonged downtrend. This is also supported by sideways consolidation on the support with decreasing selling momentum.
🔶 Bullish Targets (Based on Fibonacci & Historical Resistance):
If a bounce occurs from this golden support area, TON could rally towards the following key resistance levels:
🎯 Target 1: 3.247
🎯 Target 2: 4.087
🎯 Target 3: 4.798
🎯 Target 4: 5.879
🎯 Target 5: 6.865
🎯 Target 6: 7.932
🎯 Ultimate Target (ATH): 8.283
🔶 Maximum Potential Upside:
From the current level (around 2.839) to the all-time high (8.283), TON presents a +190% upside opportunity in a full bullish scenario.
Trading Strategy:
✅ Buy Zone: Accumulate within the golden support box (2.3 - 2.8 USDT)
🔁 Additional Entry: Upon breakout confirmation above 3.25 USDT
❌ Stop Loss: Below 2.2 USDT with strong bearish volume
📈 Take Profit Levels: Use resistance levels as partial TP targets
Conclusion:
TONCOIN is positioned at a technically significant support area, offering a high-risk-reward opportunity for swing traders and mid-term investors. A bullish reaction from this zone could initiate a strong multi-wave rally. Watch for breakout confirmation with volume before entering aggressively.
#TON #TONCOIN #CryptoBreakout #AltcoinSetup #TONUSDT #SwingTrade #BullishPattern #CryptoSignals #FibonacciLevels #TechnicalAnalysis
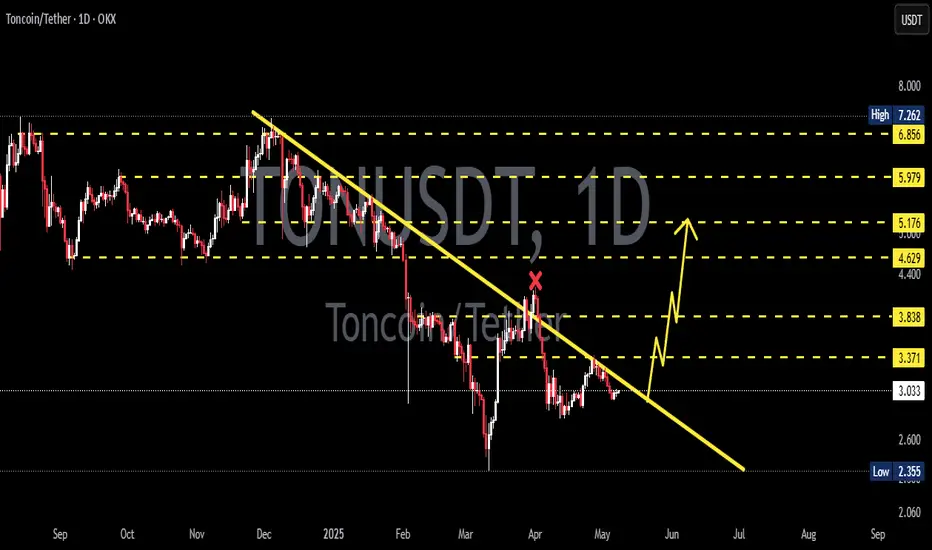
TONUSDT 1D AnalysisTON ~ 1D Analysis
#TON Buy back gradually from here with a short term target of at least 15%+, Long term target $8
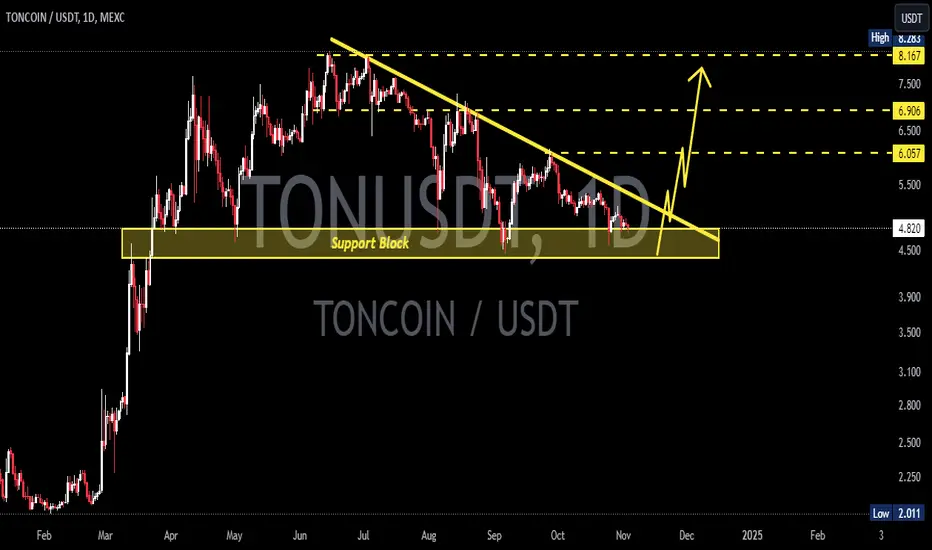
TONUSDT 1D AnalysisTON ~ 1D Analysis
#TON Buy after successfully breaking this resistance line with a short term target of at least 15%+ from here.
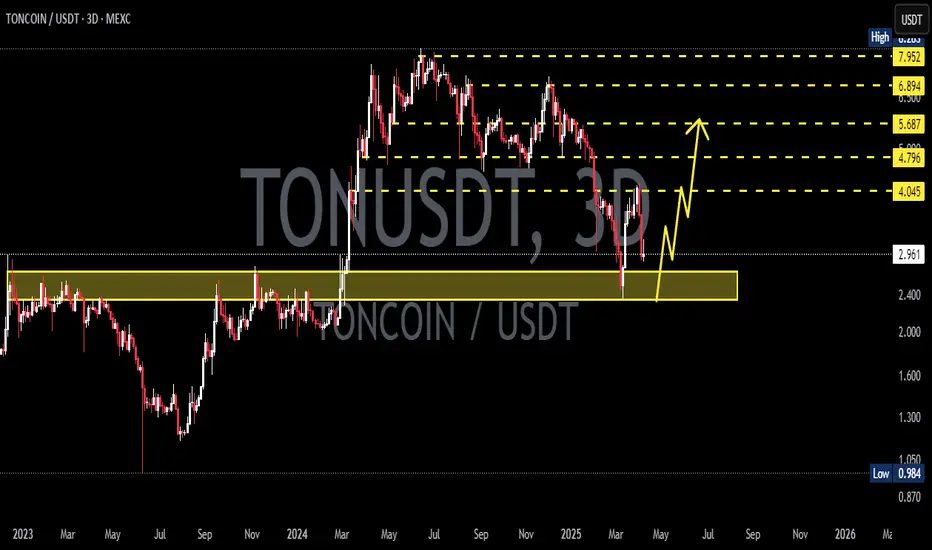
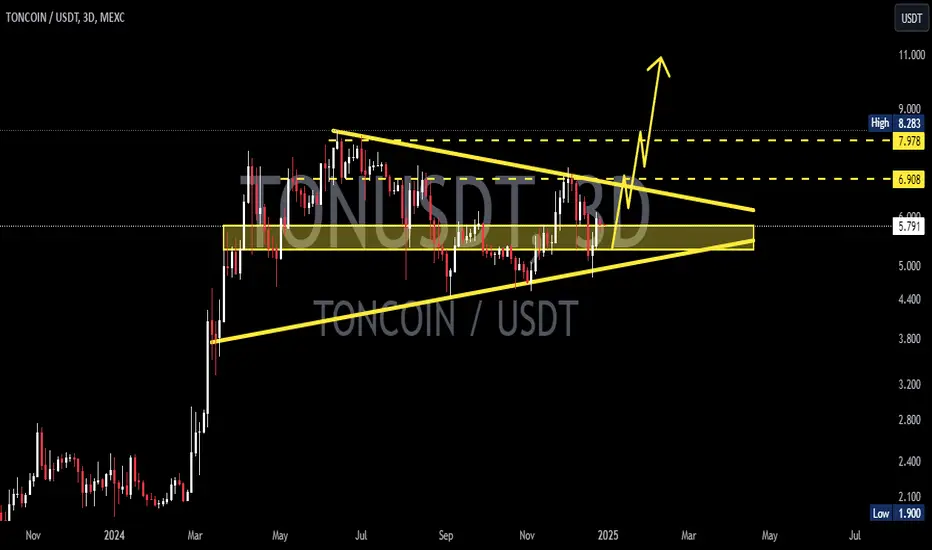
TONUSDT 3DTON ~ 3D Analysis
#TON Buy back when testing this support with a short -term target of at least 20%+.
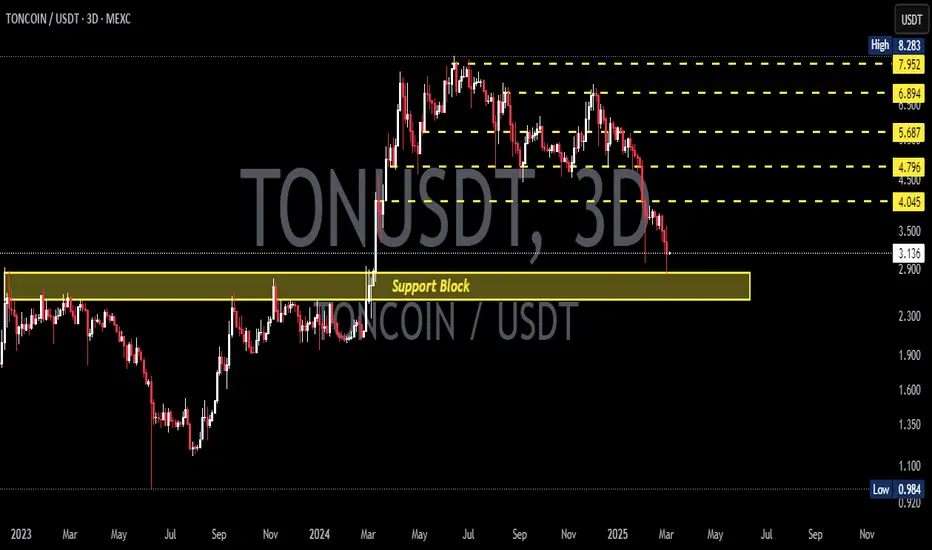
TONUSDT 3DTON ~ 3D Analysis
#TON Support blocks that you might be able to consider to start buying again from here, with a short -term target of at least 15%+.
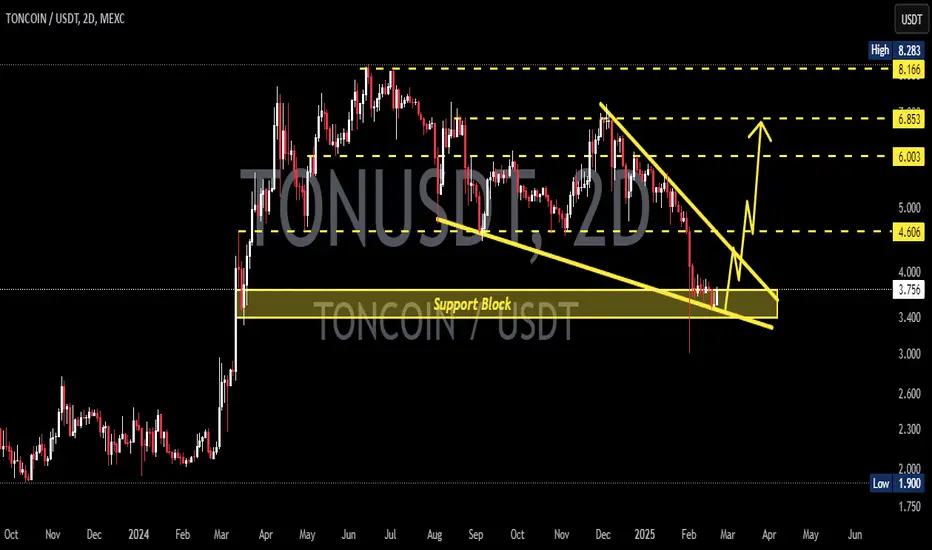
TONUSDT 2DTON ~ 2D Analysis
#TON Buy gradually from here. This is a very good buy place for now. With a short -term target of at least 15%+.
#TONUSDT is testing resistance – expecting a breakout!📈 LONG BYBIT:TONUSDT.P from $3.8920
🛡 Stop Loss: $3.8525
⏱️ 1H Timeframe
✅ Overview:
➡️ BYBIT:TONUSDT.P is testing $3.8880 resistance, and a breakout could lead to further upside.
➡️ Price remains above POC $3.81, confirming strong buyer interest.
➡️ Rising volume supports the potential bullish move.
⚡️ Plan:
➡️ Bullish confirmation requires a strong close above $3.8920.
➡️ If price slows down at $3.9400, partial profit-taking is recommended.
➡️ A drop below $3.8525 invalidates the setup.
🎯 Take Profit:
💎 TP1: $3.9400 – first profit-taking zone.
💎 TP2: $3.9800 – final upside target.
📢 BYBIT:TONUSDT.P Holding above $3.8920 opens the door for further gains. Watch volume closely – if it weakens, price may consolidate.
📢 Partial profit-taking recommended at $3.9400.
📢 If price drops below $3.8525, the setup is invalidated
🚀 BYBIT:TONUSDT.P is testing resistance – expecting a breakout!

TONUSDT 3DTON ~ 3D
#TON If you still have Conviction on this coin,. buy gradually within this support block with a target of at least 20%+

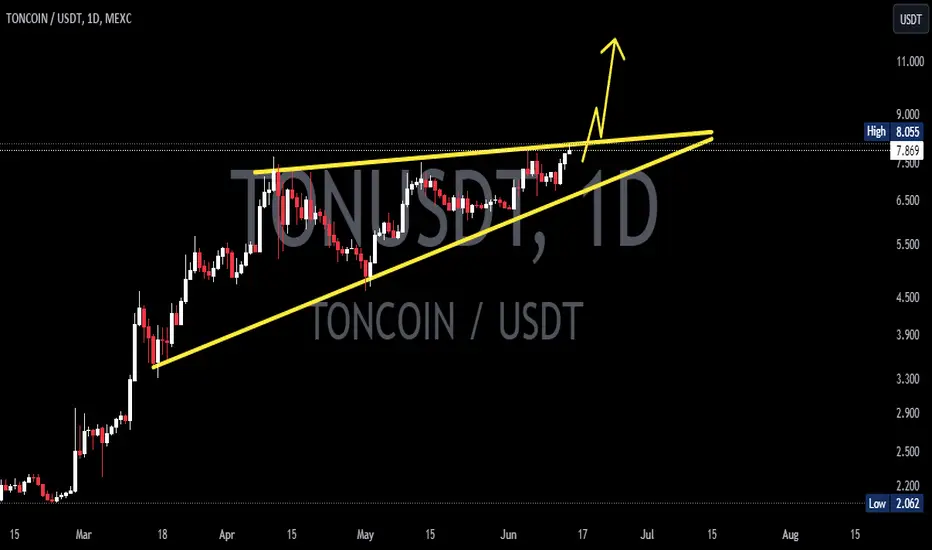
TONUSDT 3DTON ~ 3D
#TON This is a bullish pattern,. Buy gradually inside this pattern,. with a target of at least 20%+ from here. it is only a matter of time that this resistance line is successfully penetrated.
TONUSDTTON ~ 1D
#TON You can pay attention to this Support Block. Maybe a small purchase on this support Block is very interesting with a target of 20%++
TONUSDTTON ~ 1D ✅
#TON You can pay attention to this Support Block. Maybe a small purchase on this support Block is very interesting with a target of 20%++

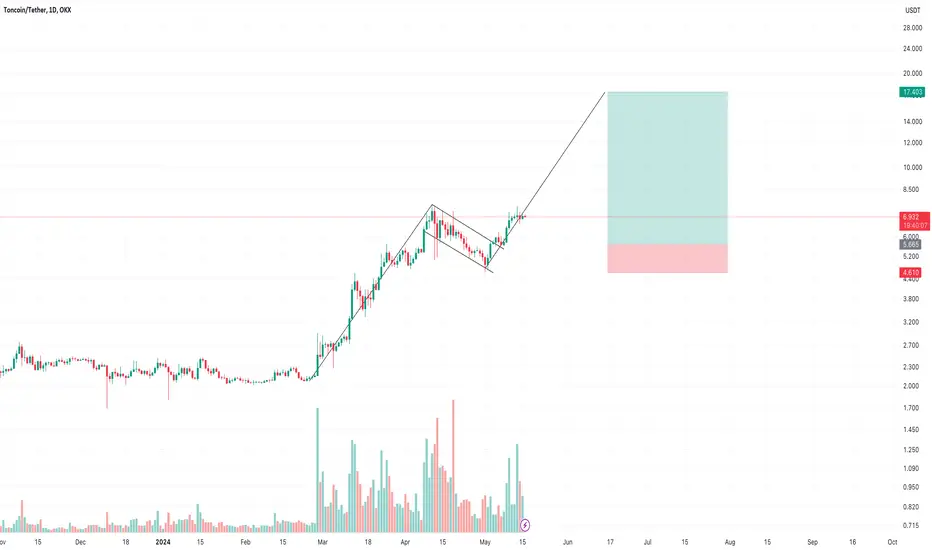
Chart Idea - TONUSDT Swing LongWhat an amazing classic bull flag pattern break out we see here.
Entry: 5.669
TP: 17.39
SL: 4.6
It's a swing trade and could take weeks or even months to playout. Will update the thread here with new comments.
TONUSD 1DTON ~ 1D
#TON So far, this coin has been able to survive the market crash.
We estimate that new ATH will continue to form.
It seems that this will be a very good coin for long-term investment until the end of this year.
🗺️Toncoin(TON) Roadmap🗺️🔥Today, I want to analyze the Toncoin(TON) project for you. I chose this project because the Notcoin(NOT) token is listed in several exchanges today.
💡You might ask, what does the NOT token have to do with the TON token ❗️❓
🙏Please be with me
📚 What is Notcoin(NOT)❗️❓
🔸Around 2018, Telegram developers decided to launch their own layer 1 Blockchain called " Telegram Open Network ," or Toncoin (TON) . After some time, the development and maintenance of this project were entrusted to the TON Foundation, and now a team affiliated with TON has unveiled its new and loud project called Notcoin (NOT) .
🔸 Notcoin (NOT) is a " Play-To-Earn " or P2E cryptocurrency game where users can earn money by playing. Notcoin (NOT) has attracted the attention of a large number of users from the very first days of its introduction.
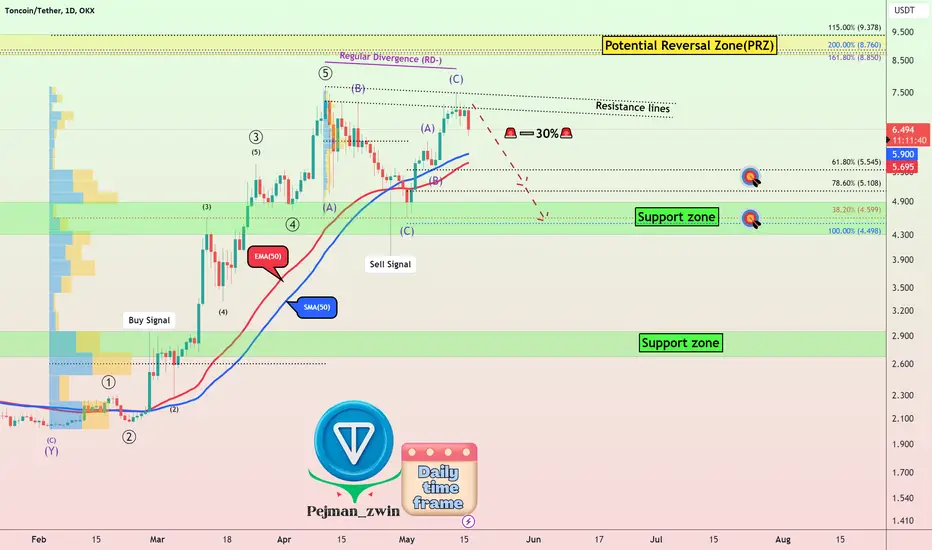
💡 Toncoin(TON) started falling well from the Resistance lines .
🌊According to the Elliott wave theory , Toncoin(TON) has completed the second corrective wave, which had a Zigzag(ABC) structure on the Resistance lines.
💡Also, we can see Regular Divergence(RD-) between two Consecutive Peaks.
💡Another sign that Toncoin(TON) may continue to fall is that the " SELL signal " was issued by moving SMA(50) and EMA(50) .
📈Before the result, let's take a look at the TONBTC chart .
📈It seems that TONBTC has managed to complete 5 impulse waves , and we have to wait for corrective waves now, which means that if Bitcoin starts a downward trend, the TON token will be more affected, and if Bitcoin goes up. If it has, the TON token will take a less upward trend or even become Range.👇
🔔I expect Toncoin(TON) to continue to fall at least to the 🎯 Targets 🎯 I have outlined on the chart( 🚨➖30%🚨 ).
❗️⚠️Note⚠️❗️: An important point you should always remember is capital management and lack of greed.
Toncoin(TON) Analyze (TONUSDT), Daily time frame ⏰.
Do not forget to put Stop loss for your positions (For every position you want to open).
Please follow your strategy; this is just my Idea, and I will gladly see your ideas in this post.
Please do not forget the ✅' like '✅ button 🙏😊 & Share it with your friends; thanks, and Trade safe.
TON Holders! FOLLOW ME~!Hello, friends!
This is ESS team.
We got a TONUSDT chart for you.
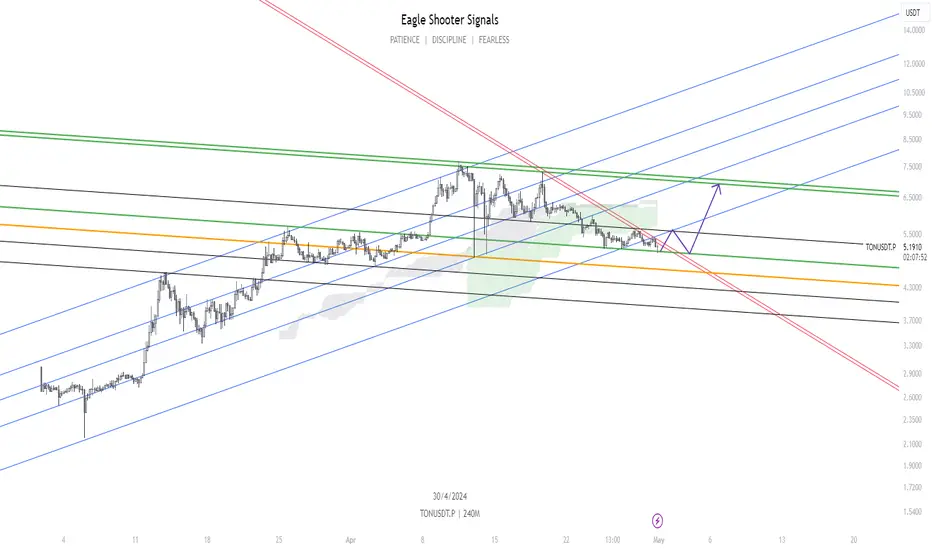
If chart keeps the bottom GREEN uptrend line, It is expected to break through the RED downtrend line.
After the break, It'll reach the top green long-term downtrend line.
If it fails to be supported by the lower green uptrend line, It can advance, after accumulation again, from the orange downtrend line.
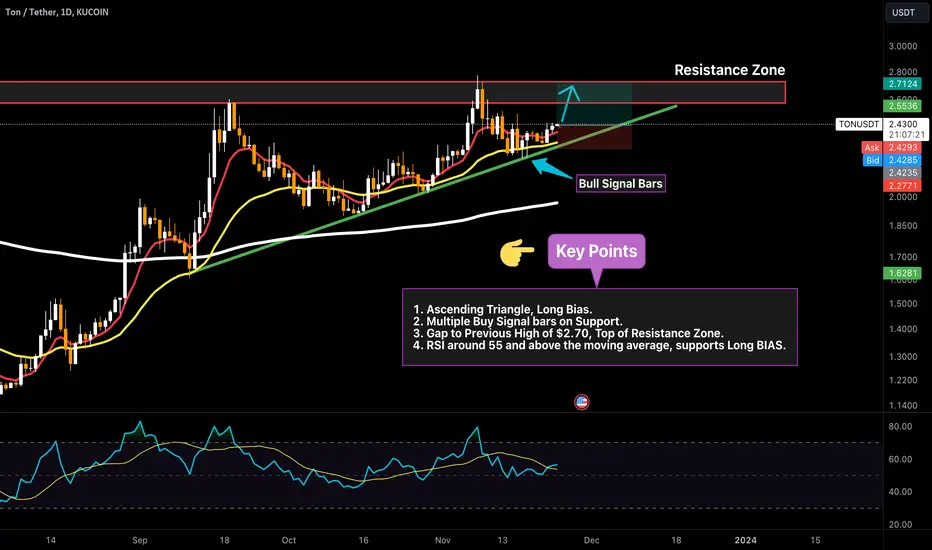
TON Looking to Close the Gap! This Trade Setup Takes AdvantageTON is showing great support along the ascending support line. The last three bars are confirmation bars supporting the bias that the pattern will continue. We're approaching previous highs from early 2023/2022 around $2.70, a resistance zone that stands in the way of the bullish price action.
How do we trade this?
The price currently trending upward and showing support along the ascending support line. RSI is above the moving average and there's a gap to the top of the resistance zone. But what about the resistance zone? From a trade management perspective, we have a 1:2 Risk/Reward ratio and the probability of profit on our side. It's reasonable to long here, setting a protective stop around $2.27 and a take profit around $2.70.
Key Points
1. Ascending Triangle, Long Bias.
2. Multiple Buy Signal bars on Support.
3. Gap to Previous High of $2.70, Top of Resistance Zone.
4. RSI around 55 and above the moving average, supports Long BIAS.
You are solely responsible for your trades, trade at your own risk!
Let us know what you think in the comment section below!
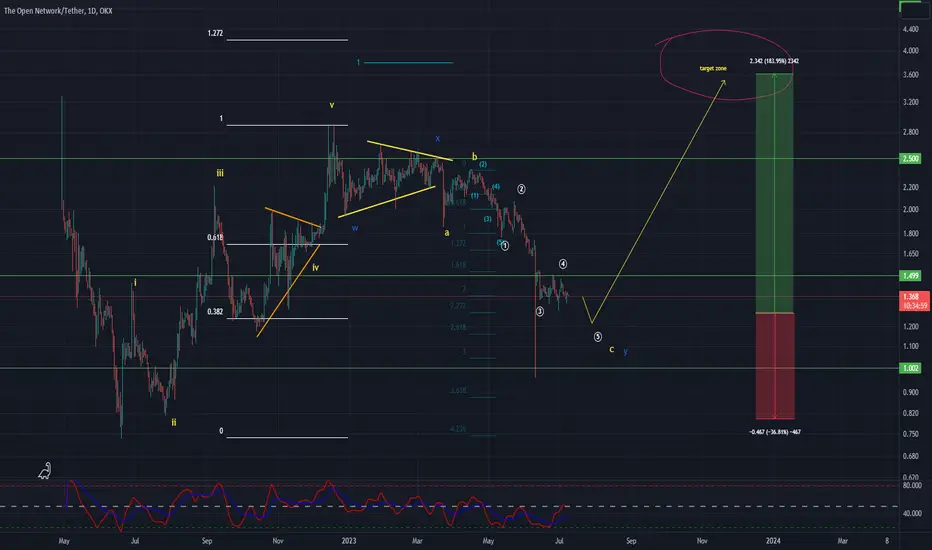
TONUSDT Elliott Waves Analysis (LONGTERM)Hello friends.
Please support my work by clicking the LIKE button👍(If you liked). Also i will appreciate for ur activity. Thank you!
Everything on the chart.
Entry: market and lower
Targets: 2 - 3 - 3.5
after first target reached move ur stop to breakeven
Stop: ~0.8 (depending of ur risk). ALWAYS follow ur RM .
RR: 1 to 5
risk is justified
Good luck everyone!
Follow me on TRADINGView, if you don't want to miss my next analysis or signals.
It's not financial advice.
Dont Forget, always make your own research before to trade my ideas!
Open to any questions and suggestions