TOP
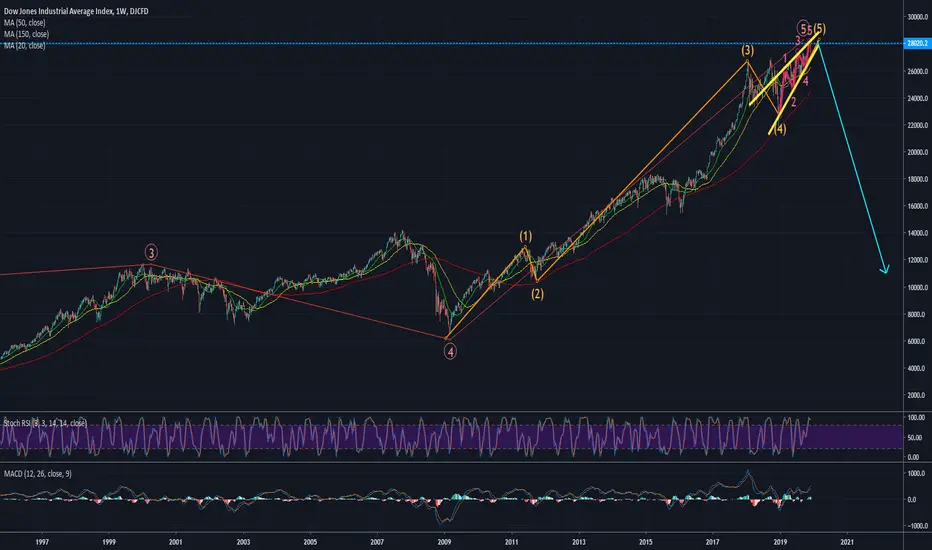
TOP OF THE MARKET!Elliott wave analysis says top of market was hit Nov 27, 2019. Rising wedge to end 5th wave of 5th wave of 5th wave now. Have fun:)
S&P500 Possible TopJust outlining a possible set of zones for the S&P500 to pull back towards (Marked in Green)
FOMC
UK General Election + Brexit
December 15th China/US trade Tariffs
ECB - Christine Lagarde's 1st proper meeting
There are a few key risk events this week, so a pullback is more likely than not.
Overall - the US fiscal flows are positive and larger each year, so this is ultimately the main source of support during these global downturn times.

A peek into the pastMATICBTC neatly moved in a Fibonacci Channel and fell down to 100% bottom of that channel.
Two detectors predicted the top
Golden Ratio Top Detector (UO_GRFM)
Mayer Multiple
Golden Ratio Top Detector also showed the potential bottom correctly.
Future? As long as it coasts above SMA350/6h, I will consider it a bullish opportunity and keep collecting.
Also note that is about to jump to an upper Fibonacci channel(78.60%) from 100% channel-- very bullish if this happens

S&P Topped out - Heading to $1,100Elliot wave analysis top of 5th wave of 5th wave. Bearish pin bar adds to confirmation. Cycle lines added to project correction over next 10 years. Have fun:)

Has Apple Reached A top?Looking at the resistance levels for Apple, this stock looks like it could pretty easily take a nice dip to the $243 - $219 level. Let's see what happens

A speculative hedge against Soy.Now, generally, I think giga-shorting indices as they push all-time-highs every single day is a bad idea.
Trends shall remain irrational longer than you can remain solvent, the Federal Reserve is incessantly printing away your purchasing power which means there's more money to pump your stonks, and trends, namely the centuries-long bull trend, have been so permanent in the legacy markets that bears are either cocky and un-informed, or they've lost the majority of their market shirt already.
Linked below as the related idea is my thesis on the upcoming economic recession which won't show up much on the index charts.
However, sometimes speculative hedges are necessary and as we head into the holiday season, the consumerist mania increases as does the mental illness and the $soy.
Utilizing some deep proprietary magic with the 1.618 fib as a confluence tool for surgical position leveling, I have marked all the levels and level clusters otherwise I've deemed important, giving us a nice picture of the market field ahead of us.
Looking for an extreme blowoff top for the best possible risk/reward, earlier entries are also acceptable, but the stop leveling is very important.
Sketched out with the pen tool is how I would see it breaking down into the levels below.
A hedge is just a hedge, and betting big counter-trend is one of the riskiest things you can do.
Stay safe out there, keep your people safe, and dodge the $soy.

SPY - SHORT SETUPWORKING ON TRIPLE MAC D DIVERGENCE ON DAILY FOR SPY. HITTING STRONG RESISTANCE AT THIS TREND LINE AS WELL.


IDXX Breaks to the DownsideIDXX stepped down after reaching a new all time high. The stock is under moderately heavy Dark Pool Quiet Rotation™ at this time. The bottom red line indicates the top completion level support.

CERN Short-Term Top Finds SupportCERN has shifted to a sideways pattern well above the gap support level. The stock is under moderate Dark Pool Quiet Rotation™.

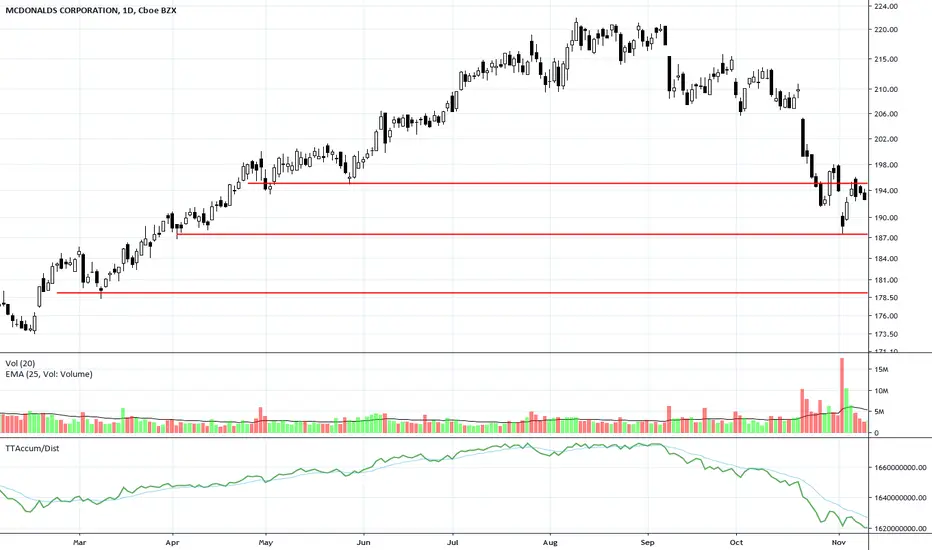
MCD Broken Step Topping FormationMCD continues to break to the downside, dropping easily through the top completion level and heading down to test a lower low.
KO Rounding Top Nears Completion SupportKO broke to the downside and is continuing down to the support level of a top completion. This aligns closely with the prior gap up.

USDCAD, Short (double top) USDCAD has seen the development of what seems to be a rising wedge pattern within an ascending channel. The double top rejection at resistance gave us a heavy bearish momentum candle that could indicate further downside continuation. A break of the lows with a retest could prove to be a valid entry.

USDCHF - Good Short setupPlease refer to text on chart.
We tried to short once before but stopped out for a small loss. This is a 2nd short attempt with another nice R:R.
** Remember, we don't try to predict future price. We react to current market moves based on our interpretations of past data.

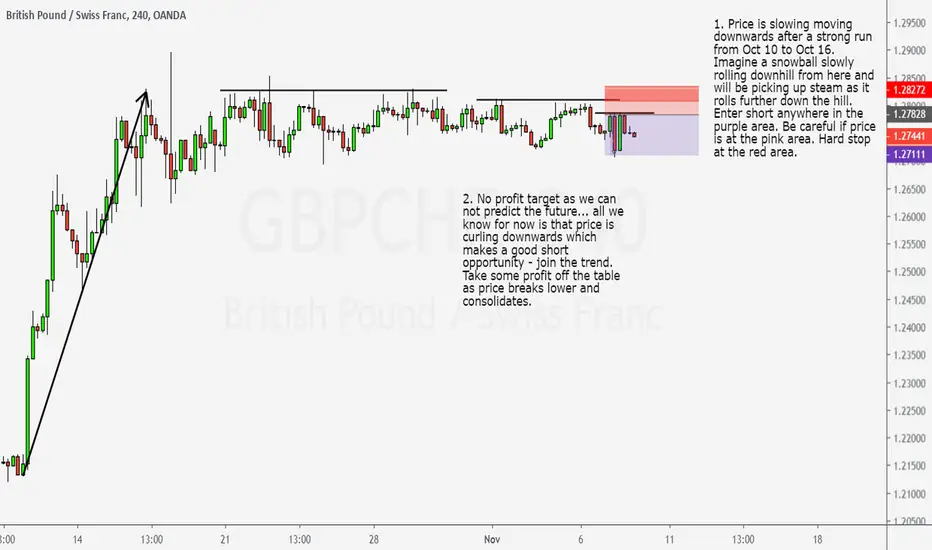
GBPCHF - Short TradePlease refer to text on chart.
Not much to say here, price is slowly moving downwards.. we'll enter with the current trend - down. If price starts moving up, we'll get out. Simple.
** We do not try to predict future price. We simply react to current price movements based on interpretations of past data.
Short position-Triple Top Resistance zone.Hello everyone, i noticed that FX_IDC:AUDEUR has reached the resistance zone between yesterday and today, and this is clearly a strong short signal. Also BB% are extremely high for continuing the uptrend oscillation, and this is the confirmation of a bearish pattern incoming.
Happy trading to all!

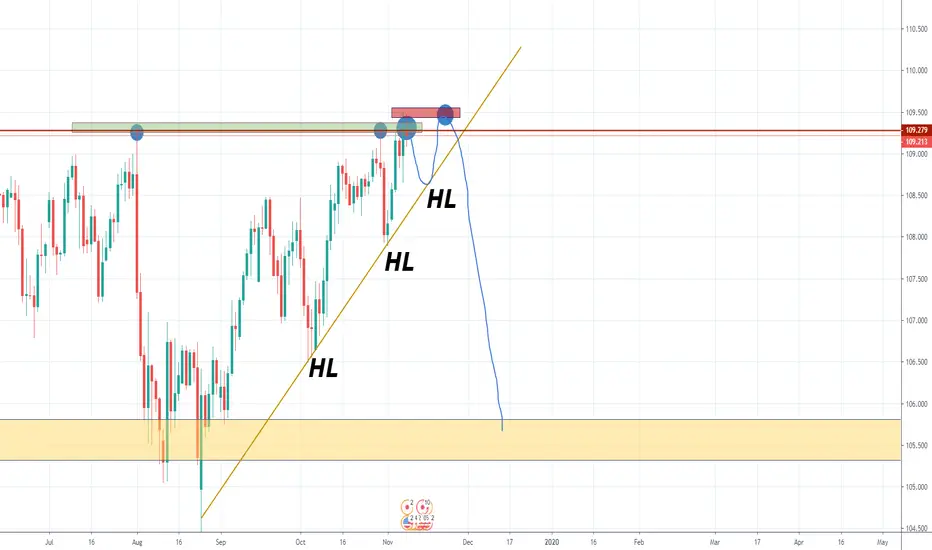
USDJPY | DailyThree touches of 109.279 after which we see that there is a drop in price. Maybe he'll do another HL touch then it will reach 109,480 and he will form double TOP if that happens and if it breaks that uptrend it will go down
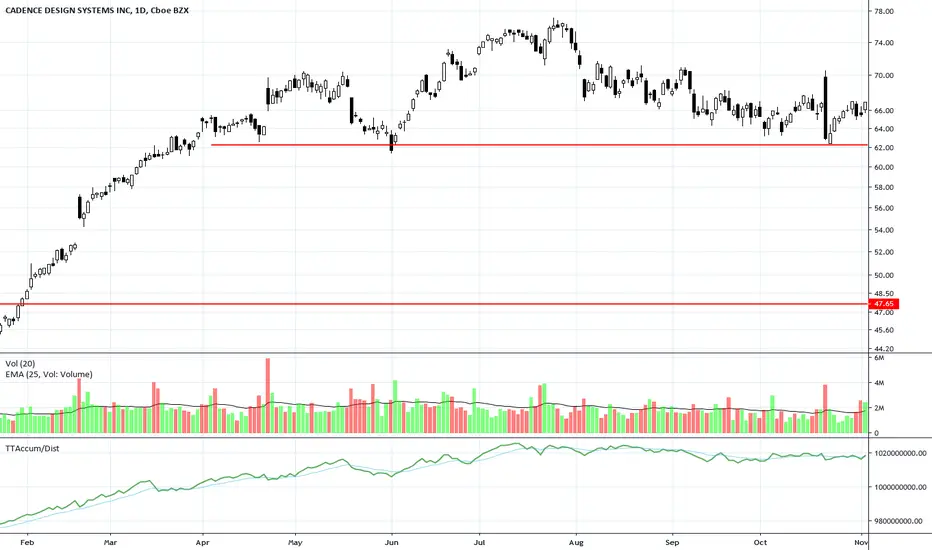
CDNS Bounces Off of SupportCDNS is at risk of a topping formation, but has bounced on its top completion support level. If the stock breaks through this support, the next level of support is below $50.
EURJPY buying soon!Hello everyone, FX:EURJPY is entering support zone wiht thew 1h chart view... Also BB% indicator is telling us to buy... I'd keep this one for one or two days max.
Happy trading to all!

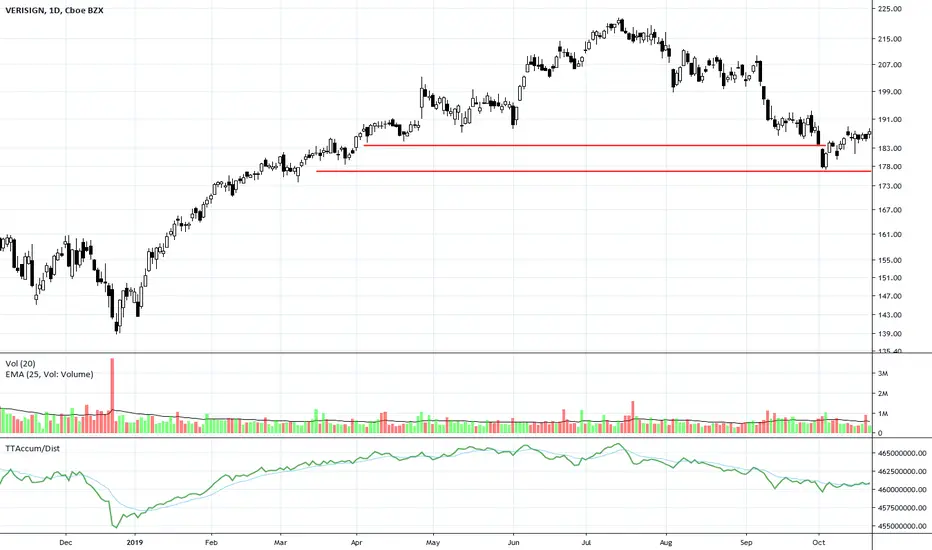
VRSN at Topping Completion LevelVRSN has a bounce up at a support level that is technically within the topping formation completion level. The stock has recently consolidated above the prior low for this top.
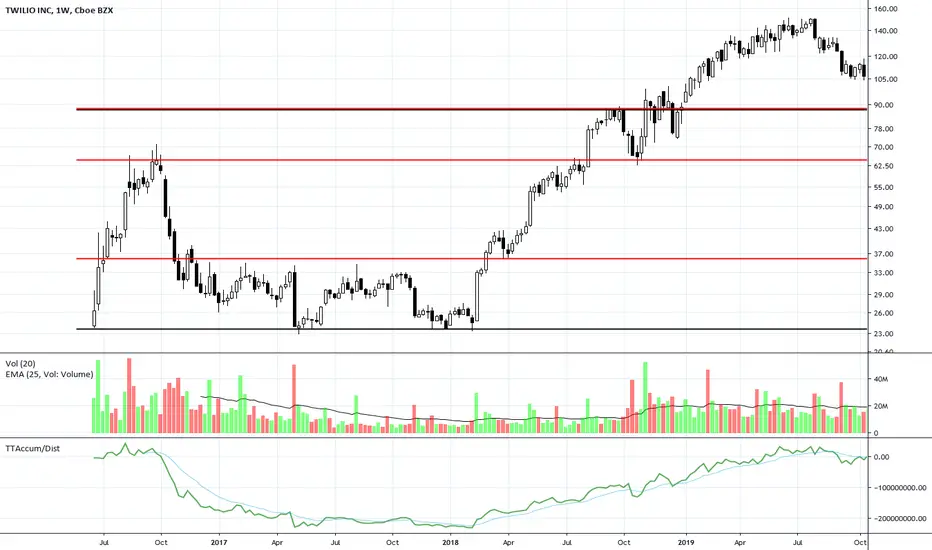
TWLO Rounding TopTWLO is forming a short-term Rounding Top Formation with support nearby. There is some Dark Pool Quiet Rotation™ that is increasing the rounding action on this chart.
$sqqq : hedge the moneyAfter a wonderful week of trades including $tsla, $zion, $intc, $hal, and many more, profits locked, I opened spot and options positions before the close.
I believe that this is one of the potential blow-offs, run the Friday close at or close to ATHs before running it back down considerably before POTUS run and worsening trade climate turns market for the worse.
In on spot from 29.05, stop 28.21, 84 cents of invalidation.
Additionally, I have :
11/15 31$ calls, in at .69$.
12/20 32$ calls, in at 1.42$.
12/20 34$ calls, in at 1.1$.
May fortune favor the bold.
