SPAR GROUP INC- Top GainerSPAR has been on a 'sprint' lately giving itself a lot of upwards momentum in such a short period of time, meanwhile not having a strong balance from the previous chart patterns. What I am trying to say is that the position that SPAR is holding on to right now is a very weak position, much like Aquabounty which I also wrote about. SPAR may not fall down as drastically as Aquabounty but it will surely win itself a spot in the top losers sometime soon, but the action will not stop there. There will DEFINETELY be another run in this same quarter ((or maybe at the worst in the very beginning of next quarter)) where SPAR will go on another run where right after it will become the top loser.
TOP

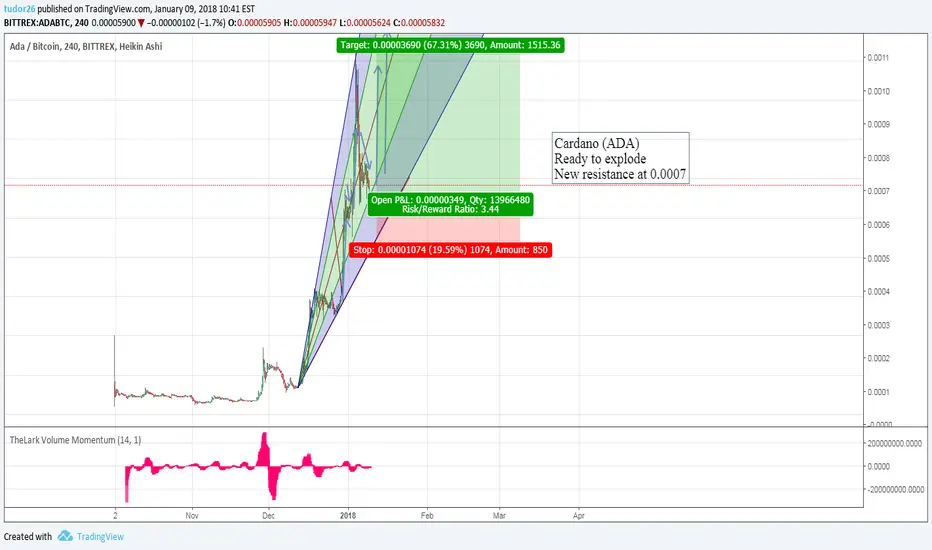
CARDANO (ADA) ticking to explode!BITTREX:ADABTC As we can see the graph has slowly melt down like an ice cream. But we are the freezer and we will resuscitate this resitance in next hours !
WE all LOVE CARDANO chart, as we can see nothing is stopping the next bullish.
Short term profit at least +30 %
Long term trade TO THE MOON
The lark Volume Momentum is ticking, and the new buyers are at the door.
Glad to trade, happy to be here!
Namaste!

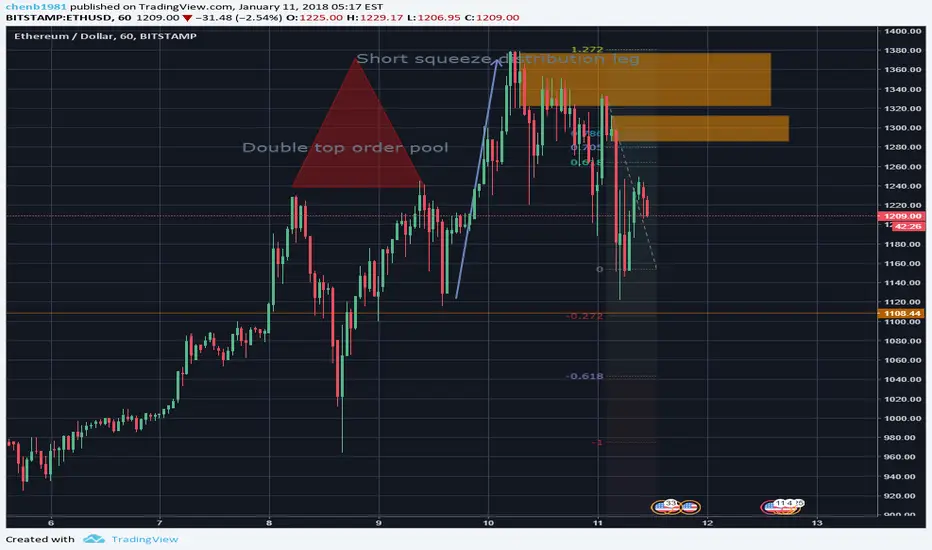
ETHUSD has formed a distribution topThe pattern at the top is a classical three drive distribution top formation. The double top to the left seems to be the top, but the market maker to drive through that formation one more time to sell their holdings to the short sellers who are covered at the high and the unsuspected speculators who are chasing the high.
After it broke down from the third leg, the price has encountered heavy distribution when it tried to trade back to the ICT bearish order block. This has signified to me that the bull trend is over for now. Until the traders are trapped at the highs are washed out, we are going to see price being capped below 1300.
I would be interested in selling the retest of another, smaller, ICT bearish order blocks when it retraces higher.
VertCoin Back To Previous High?On the 6th of December VertCoin established an all-time high against USD, hitting $10.7 price. After that, a corrective wave down follow where the price dropped down to $6, and consolidation has begun. During the past month, VTC/USD has been trading within that range, without showing much weakness nor strength.
Although on the 2nd of January price broke above the descending channel, 200 Moving Average and the resistance at $6.8. It seems that VertCoin could be getting higher once again, although it is unclear whether it will be the final wave up before the correction, or a continuation of the uptrend.
The key resistance is at $10.4 where 361.8% Fibonacci retracement applied to the corrective wave down after the resistance breakout. It could happen that VertCoin will produce a double top near the $10 psychological resistance, which is the key resistance area at this point. Break above, or a rejection should provide more clues about the further direction. On a downside note, break below $5.5 support should invalidate bullish outlook.

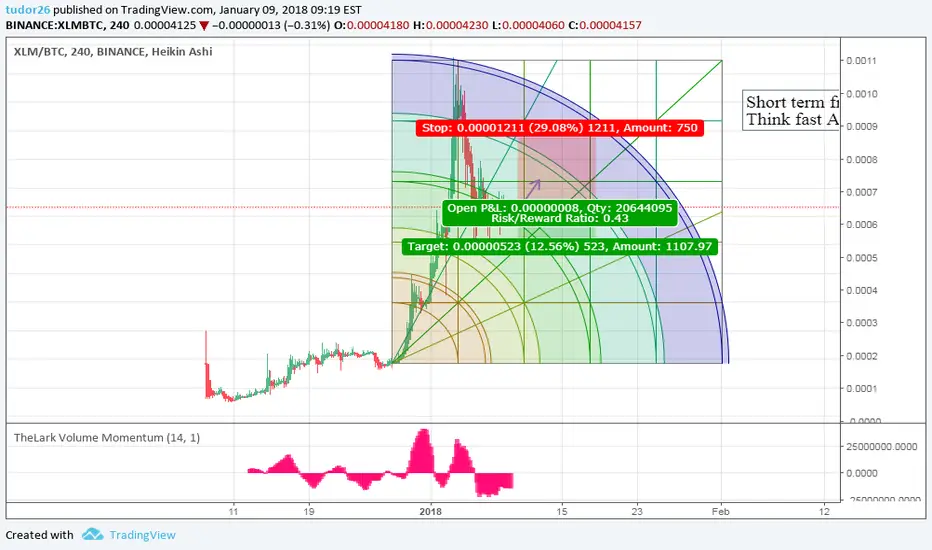
Steallar Lumes (XLM) Fast Opportunity Buy! 20% in 4-12 HThink fast Act now!
Stellar Lumes after the big bump at the top of 6350 is recovering.
The H 4 Grapgh looks incredible !
For fast earning buy some lumens and you ll dont regret !
Buy in 4100
Sell short 4500
Few days 6250
1 month To the moon >9000
NAMASTE!
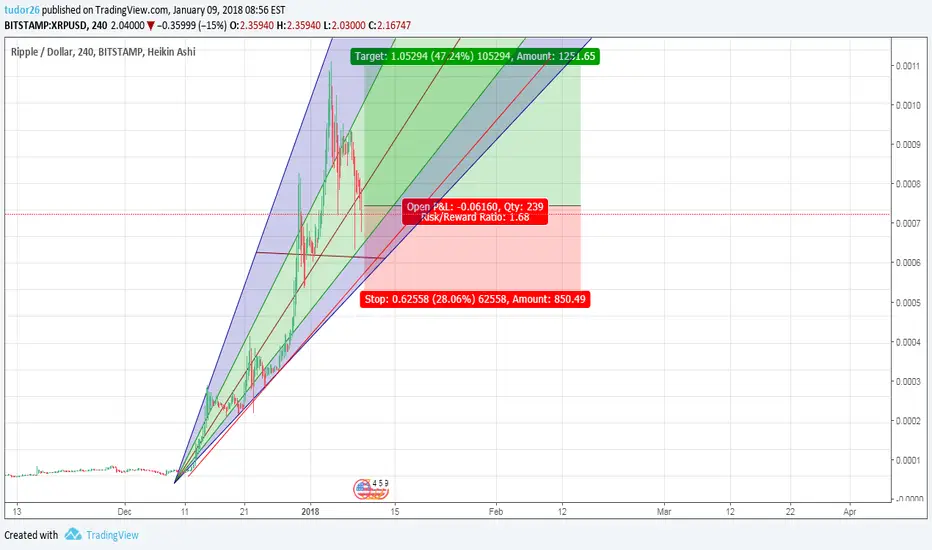
RIPPLE (XRP) / DOLLAR ($) Good buy in! You gotta love the ripple graph!
It s just gorgeous!
My call is to buy right nou, last days we saw very often fluctuation in XRP / $ also in BTC / XRP.
But dont freak out !
Cause Ripple got under control this! And we ll soon see a strong bullish.
Too much hype on the first week of the year on altcoins kinda altereted the normal graph of evolution, much money in - much more out !
I can call this coin both SHORT and LONG TERM INVESTMENT!
Short term 10-25 % in 1-3 days
Long term TO THE MOON
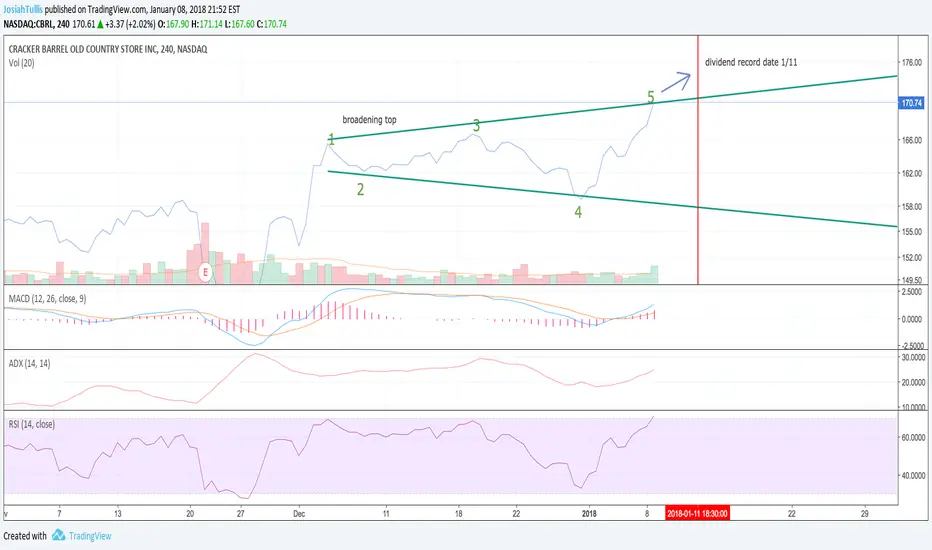
CBRL Broadening Top and Upcoming Dividend! (Price target: ~$176)The Broadening Top pattern forms when the price progressively makes higher highs (1, 3) and lower lows (2, 4) following two widening trend lines. The price is expected to move up or down past the pattern depending on which line is broken first. A bit of a toss up since the broadening top formation appears much more frequently at tops than at bottoms, and therefore usually has bearish implications. In this case, however, we see a strong up-trend with an Average Directional Index just shy of the 25 mark. Set limit order above market price to be sure we are looking at a bull broadening top, or for added risk buy the retracement when RSI corrects below 70. For best results take 50% position at each. Consider stop-loss below breakout price.
Added confidence from the fact that Cracker Barrel is recording a $1.20/share dividend on Jan 11th, issued on Feb 5th. Dividend hunters could help drive this trend up. CBRL reports earnings 02/20 BMO and Estimize revenue expectations are 0.77% higher than Wall Street's.
Follow me on Twitter: twitter.com
Qtum VS Bitcoin Rising To Form Double Top?Qtum managed to break above the descending channel and 200 Moving Average suggesting that is it ready to continue trending upwards. QTUM/BTC producing higher highs and higher lows while trading within the ascending channel.
The overall trend is definitely bullish and Qtum should be moving higher to test 227.2% Fibonacci retracement level applied to the corrective wave after the descending channel breakout. This resistance is based at btc 0.0056 which is very close to the previously formed top in August last year.
The btc 0.0056 is the very first strong resistance for Qtum and it would be interesting to see the price action around this level, which should provide more clues about the further direction of QTUM/BTC. At this point, Qtum could continue trading within the ascending channel and could even move back to test the 38.2% Fibonacci support, which in fact has been already rejected. In the worst case scenario price could drop towards the 200 Moving Average, but only break below it should invalidate bullish outlook.

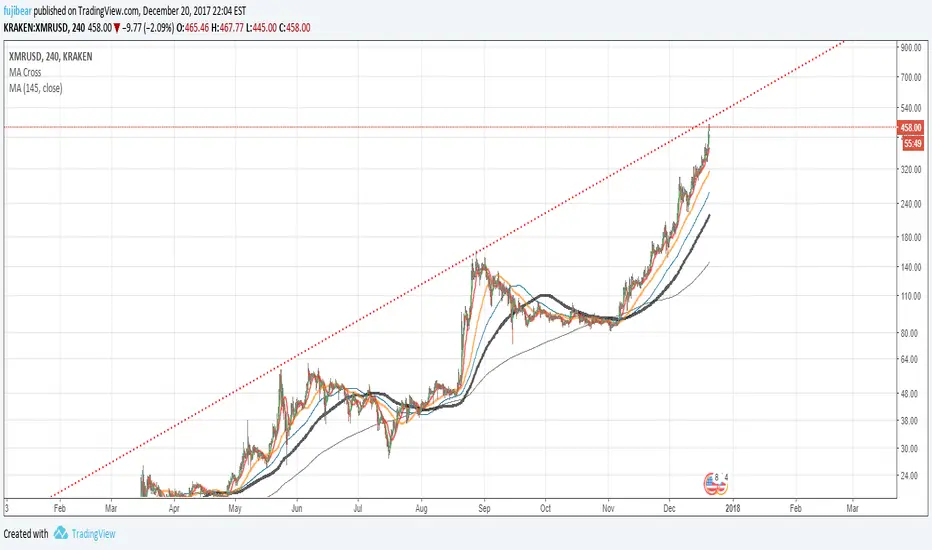
XMR approaching logarithmic top around ~$500 or soWill most likely hit close to 500 dollars, or possibly higher on a short candle then break up trend within a few days to a week at most. Good time to sell, or short your XMR.
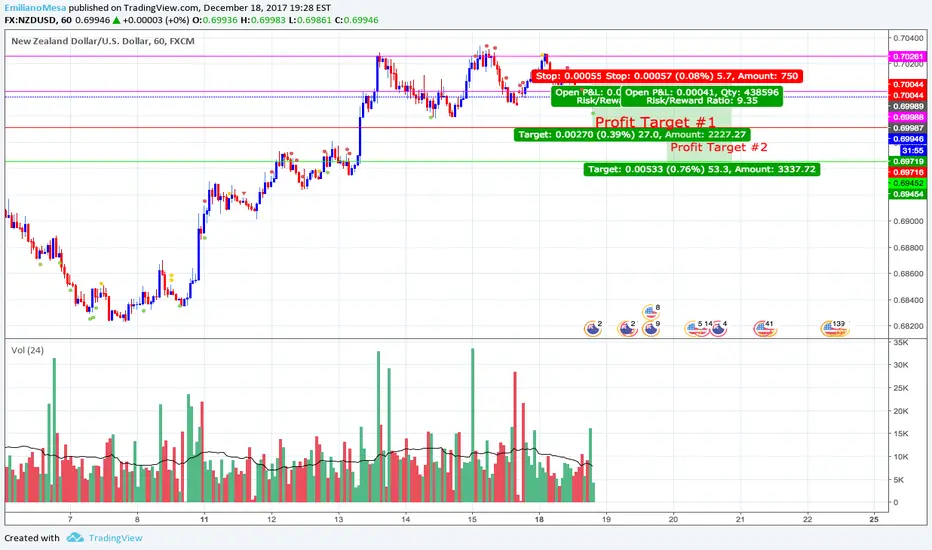
Triple Top NZDUSDA clear triple top. It will most probably decrease to Target Profit #1, if it does there is a chance it can even decrease to profit target #2. In fact you can see it rise extremely quick on the 1st top, doing so means it will also reverse extremely quick. Be ready.
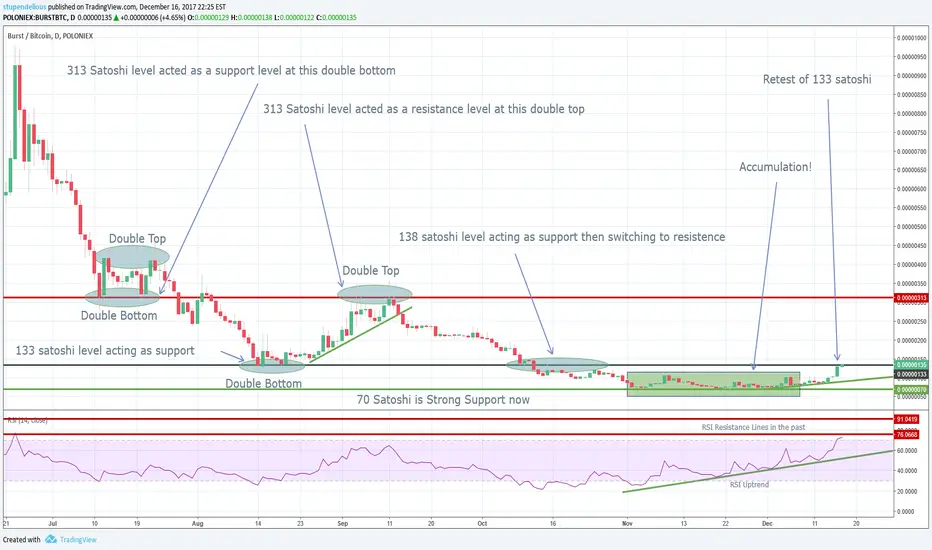
3 Month Analysis of BurstcoinAn analysis of Burstcoin's recent history :)
Edit on chart: the fourth bubble should say 133 satoshi level, not 138.
Thanks and Happy Trading :)
Please donate if you like what I do! :)
bitcoin: 1NTkRex1gE2iJ63sFQHNpFYkBoeZ3w69FZ
burstcoin: BURST-S9HQ-84BX-CXX8-4RKBC

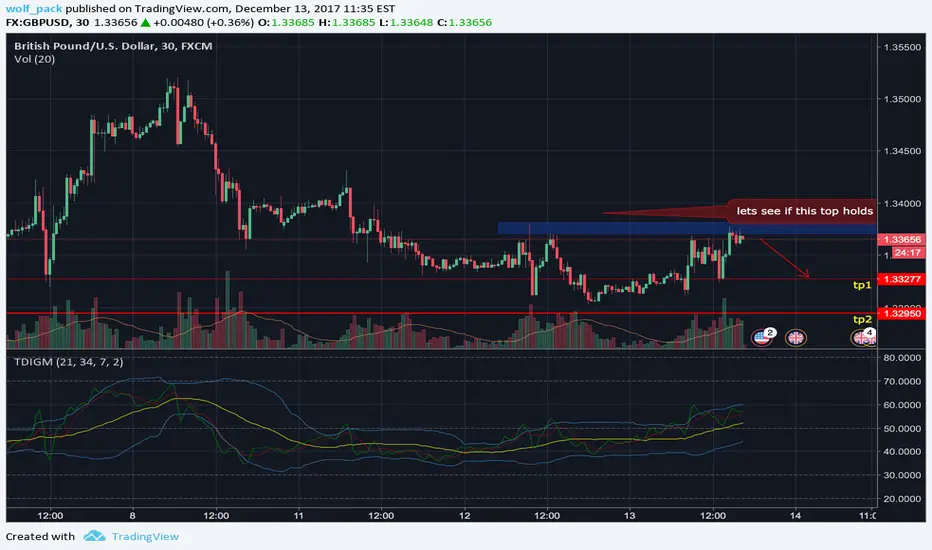
gbpusd setuplets see if this double top hold at 1.33790 if so we can expect a fall to 1.33354 minimum to possibly 1.32950
today is interest rates so market will be extremely volatile so anything can happen
Bitcoin Double Top? Don't Bet On It.BTCUSD update: 17579 is a new high, but barely compared to 17171. This is the double top variation scenario that I wrote about in my previous report. Is the top in place?
After watching the kind of vertical moves that have occurred in ETH and LTC, this appears to be an anything goes market so even though these conditions are rare and high risk, the strength is clear and must be acknowledged. This means the bearish signs that do appear do not carry as much weight.
In the case of this market, I wrote about the double top variation which is what is unfolding at the moment. Price makes a new high, but not much higher within the reversal zone (below 18300). In a normal market this would be a sign of coming weakness and even offer potential short signals on smaller time frames. The problem is this is NOT a normal market.
I realize there are a lot of people itching to short this market because reward/risk is attractive at these levels and even a relatively small move lower is worth a couple of thousand points. And if you have the risk tolerance and ability to put a short position on, this would be a better time to try compared to the previous price action. Just remember keep this in mind: Weak markets do not sit and consolidate near highs. They reject resistance fast which is not happening right now.
This is why acknowledging the bigger picture is so important because it sets expectations that are more in line with the intent of the market. Newer traders see a bearish pattern and jump on it with high expectations while the position may offer some profit, but expectations should be limited until this market shows significant signs that a broader correction is more likely which it is not doing right now.
Until this market breaks some significant support levels like 12400, it is more likely to consolidate and attempt to go higher. In this bullish environment, support levels are more likely to hold.
As far as swing trades go, I want to see price retest the 12400 area (.382 of bullish structure measured from the 4k low) and then show reversal patterns for a retest of the high. Also the 14280 level is an interesting area because it is a .382 of the bullish structure measured from the 8821 low. IF the market retests these levels, it could be setting up a head and shoulders formation on a large time frame which would then imply a short term top is in place, but right now it is too early to tell while the broader structure still exhibits strength. If I am going to take swing trade I want to be in line with the bigger picture, not against it.
In summary, a -500 or more day in a market that has the ability to move 2k is not much. Maybe the futures are beginning to have the effect that I have been writing about as far as bringing more of a balance. We can sit here and speculate about how and why, but again the market doesn't care what we think. As a price action trader, I am always comparing current price action to previous structure and history, and evaluating that information in light of the bigger picture which carries the most weight. So using what is available now to answer "is the top in place?" the answer is no, because there is not enough supporting evidence to make a strong argument. Remember making money in vertical markets does not require skill, but keeping that money is a different story. If the market is not coming to you, there is no need to put on a trade. Flat is a position too.
Questions and comments welcome.

ETHUSD At Top Of its Tree in Near TermETHUSD At the top of its tree in near term
Although ETH has struggled for a large part of the last 30 days, it has now doubled from a low at 313 to today's high
at 626. Not bad for a straggler. But it's probably at its upside limits in the near term here and needs to
consolidate some more below the upper parallel before it can go again. May well hammer out a small flag for the
next few hours, especially if 617 keeps stopping the next advance. To clear the way for the next advance from
hereETH would have to find enough power to beat the upper parallel and then to turn it into support on the next
retest from above once broken through. Can either close out longs here and lock in profits and be ready to buy on a
successful near term break above the upper parallel or potentially to buy again from lower down, from 577-551 range.
