EURUSD Top-Down Analysis-BearishTaking into account that the higher timeframes dictates the price movement I started to analyze
the Monthly and Weekly chart first.
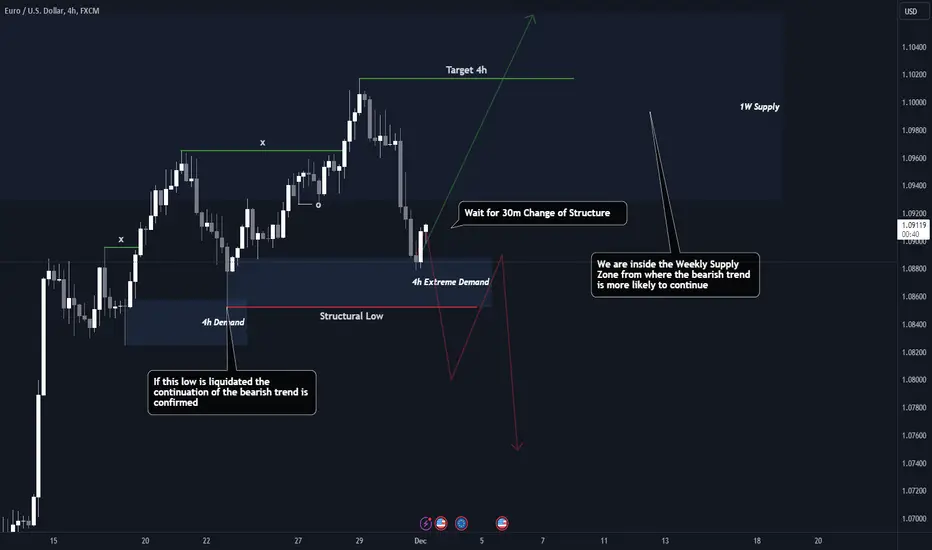
I noticed that on Monthly the order flow is Bearish and that we are right now in a Supply Zone .
On Weekly the price Changed the Structure from the big monthly Supply by liquidating a Structural Low .
Then I noted the Supply Zones in the weekly Range.
I dropped down on the 4h chart to see what the price is doing inside the weekly Supply Zone.
On 4h chart the trend is still bullish but can confirm the bearish continuation by closing below the structural low .
On the 30m chart the trend is bearish but we can take longs on 15m chart until the Supply zone on 30m is reached.
Then we will need to wait for either a confirmation that the trend will continue bearish or a change of structure to confirm the bullish continuation on 4h.
Topdownanalysis
EURUSD trade idea for 14/NOV/2023This is a detailed analysis of eurusd which I started from the daily timeframe all the way down to the 1h timeframe (for the weekly timeframe analysis, visit yesterday's video on my profile). I talked about what I expect the market to do today and the levels I will be looking out for before I take any trade. If you like this kind of videos, please follow and give me a boost. Thank you.

13/NOV/2023 EURUSD ANALYSISThis is a fully detailed top down analysis on eurusd. In the video, I talked about the pair from the weekly timeframe, showing what I expect the price to do over the next week and also explaining how it relates to what I expect the price to do today. I dropped down the daily and 4h timeframes and also explained their relationship and why I expect the price to drop today. Finally, I dropped down to the 1h timeframe and talked about the levels I'm going to be watching out for before I take any trade on the pair. I also talked about what the market could do that will make this analysis become invalid.
I bet this video will be of value to you.
If you liked this video, please give me a boost. Also follow so that you can get my videos or trade ideas immediately I post them.

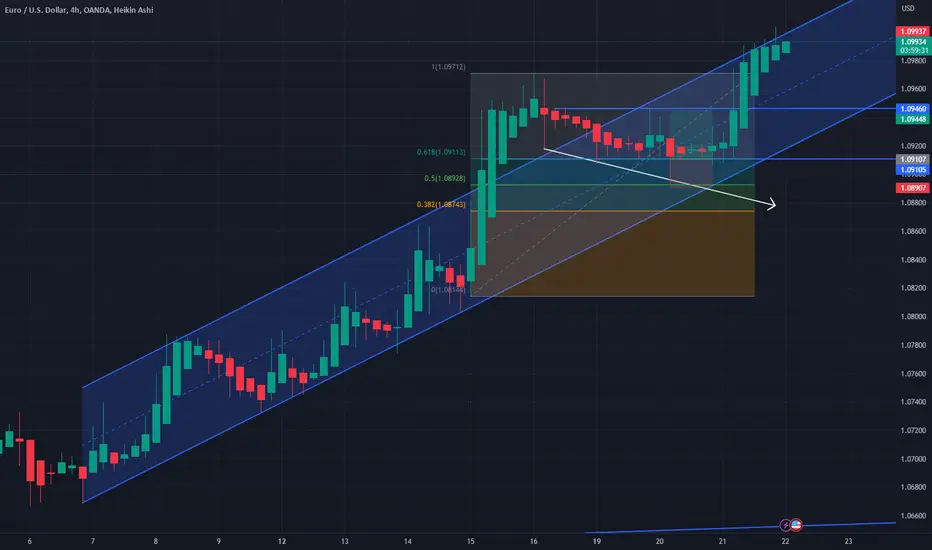
EURUSD TOP DOWN ANALYSIS FOR 13/NOV/2023From the daily timeframe, you can see that eurusd is in an upward channel. I will expect to see the channel last for the next few weeks because there's a possibility that the price will touch a weekly resistance zone for a retracement up above. However, the price moves in trends and made a higher high two weeks ago. Throughout last week, the price has been on a retracement move downwards and I expect the retracement to continue even lower than last week's low before the next impulse for the higher high comes.
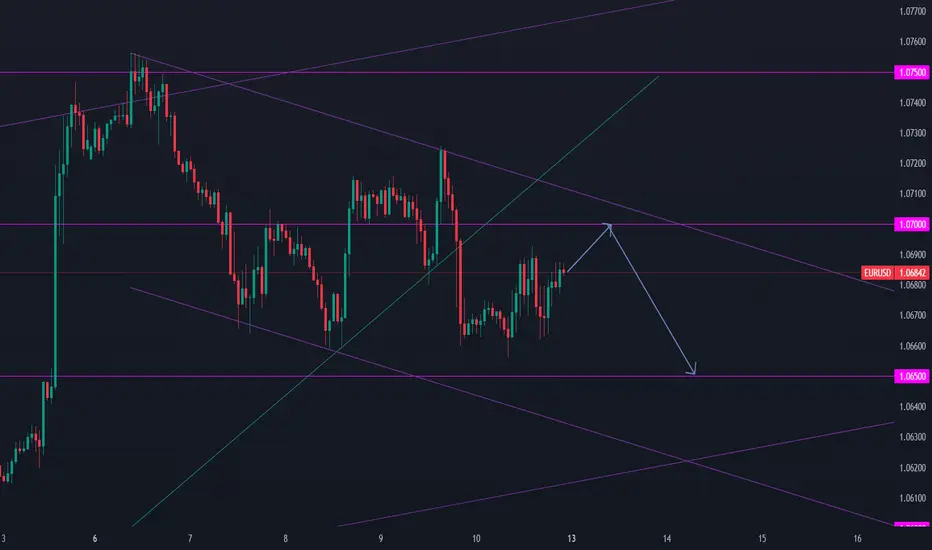
On the 4h timeframe, we have a temporary downward channel which we expect the price to respect all the way down to 1.06500 or even lower within this week before the next move upwards again.
On the 1h timeframe, that's where I look for trading levels and from what I can see, the price is trading between 1.07000 and 1.06500. Like I already said, I expect to see the price drop so before I will take any trade, I will expect to see the price rise to the most recent resistance which is the 0.07000 level which will meet with the descending trendline resistance and act as a confluence for a possible move downwards.
In a nutshell, I will expect to see the price rise to the 0.07000 level before I start looking for selling opportunities down to last week's lows and ultimately 0.06500.
Tune in by 6:30am WAT for a video analysis on the pair.
EURUSD FORECAST 10/NOV/2023This is a detailed analysis on eurusd based off pure price action. In this video, I started my analysis from the daily timeframe and ended it on the 1h timeframe. I talked about the way the market reacted to my analysis of yesterday and how I will react to what the market will do today. I talked about the levels I'm going to be looking out for before taking a trade.
If you enjoyed this video and you would love to support me, please just follow and give me a boost, it goes a long way. Thank you very much for watching. See you in the next video.

EURUSD Analysis and setup for 07/Nov/2023This is a detailed analysis which shows the levels I'll be watching out for from the daily time frame all the way down to the the 1h timeframe. It's a full top-down analysis that is purely based off of price action.
Remember that forex is risky so everything you see in this video is purely for educational purpose and is my Idea. It doesn't act as investment advice. If you trade based on the analysis in this video, you are doing it at your own risk.

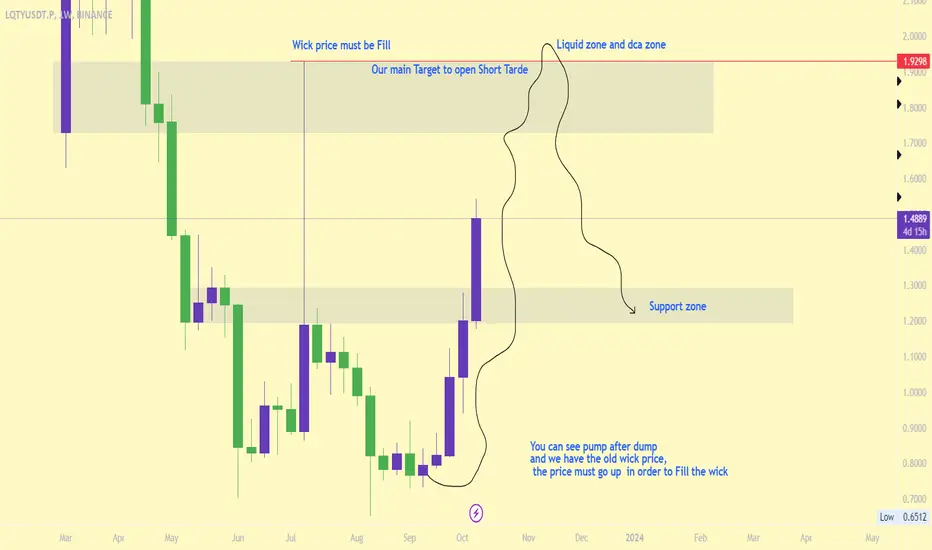
LQTYUSDT.P Bearish wick filling price BINANCE:LQTYUSDT.P Now we are on the way to open Short Trade, we have wick price around
$ 2$ price must be fill this price after that we go on our bearish target until 1,30$ & 1,15$
1,92 and 2$ our strong Resistence zone also, Our Technical analysis is weekly Timeframe so that we need to wait more in order to reach our main Target
BINANCE:LQTYUSDT.P MEXC:LQTYUSDT.P BYBIT:LQTYUSDT.P BITGET:LQTYUSDT.P
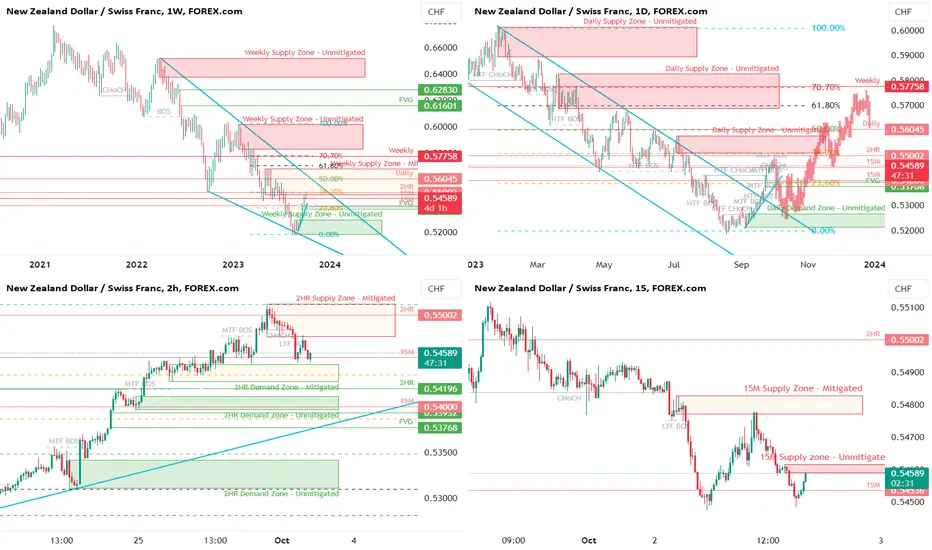
A Smart Money 'How To' for Multi-time frame TradingNZD/CHF
Below in the updates I will break down my analysis of NZD/CHF and how I use Multi-time frame analysis to confidently and healthily create a bias and build a story that lead to short term and long term (and non-objective) trade setups.
Further detailed analysis and charts below
Happy Trading!
- FourXtrader
Learn What Time Frame to Trade
If you just started trading, you are probably wondering how to choose a trading time frame . In the today's post, I will go through the common time frames , and explain when to apply them.
1m; 5m, 15m Time Frames
These 4 t.f's are very rapid and are primarily applied by scalpers.
If your goal is to catch quick ebbs and flows within a trading session, that is a perfect selection for you.
30m, 1H Time Frame
These 2 are perfectly suited for day traders.
Executing the analysis and opening the trades on these time frames,
you will be able to catch the moves within a trading day.
4h, Daily Time Frames
These time frames are relatively slow.
They are mostly applied by swing traders, who aim to trade the moves that last from several days to several weeks.
Weekly, Monthly Time Frames
These time frames reveal long-term historical perspective and are mostly used by investors and position traders.
If your goal is to look for buy & hold assets, these time frames will help you to make a reasonable decision.
📝When you are choosing a time frame to trade, consider the following factors :
1️⃣ - Time Availability
How much time daily/weekly are you able to sacrifice on trading?
Remember a simple rule: lower is the time frame, more time it requires for management.
2️⃣ - Risk Tolerance
Smaller time frames usually involve higher risk,
while longer-term time frames are considered to be more conservative and stable.
3️⃣ - Your Trading Goals
If you are planning to benefit from short term price fluctuations you should concentrate your attention on lower time frames,
while investing and long-term capital accumulation suite for higher time frames.
Time frame selection is nuanced and a complex topic. However, I believe that these simple rules and factors will help you to correctly choose the one for you.
❤️Please, support my work with like, thank you!❤️

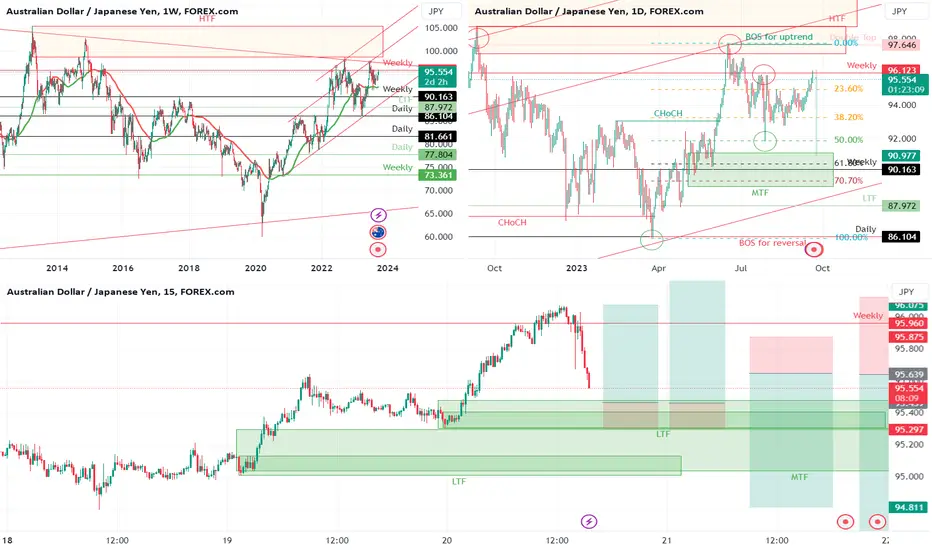
AUD/JPY - Analysis and trade setupsAUD/JPY – 9/20/23
As always, I initially begin my analysis process by noting any key economic events taking place for the pair within the coming days. This information could be key to understanding the movement of the charts on a deeper level.
- In the pair we’re analyzing today, we’ll see that we’re approaching a strong area of resistance that has failed multiple times on the weekly level – however, with key inflation data and reports coming out of Japan tomorrow we could use this information as a reason why we may be able to push out of this triangle and above our resistance zone.
1. HTF (Weekly & Daily) Analysis – Identifying key support and resistance levels and patterns on the Weekly and Daily time frames. This includes current trend and any recent CHoCH.
a. Identifying Trend: Looking at the HTF Charts, we see that we have been in a sustained Uptrend. However, after our most recent higher high (which mitigated our HTF supply zone (see below) we created a major CHoCH on the daily TF. We then failed to create a higher high and instead formed a double top at an already strong weekly level.
i. In order for price to continue its uptrend, it will need to create a higher high
ii. In order for price to reverse into a downtrend, it will need to create a HTF Break of structure.
b. Currently at a very strong weekly resistance level
c. Nearing zone of recent weekly double top and mitigated liquidity grab (which happened at the top trend line in a symmetrical triangle pattern)
d. Highlighted key support and resistance points in red and green to identify recent liquidity zones
i. One of these levels was a retrace of the current uptrend which has a massive wick and strong resistance at the 50% fib retracement, leading me to believe buyers are very much present and willing to attempt another break of resistance. Positive inflation news out of Japan tomorrow could be the catalyst to gain the necessary volume for such a push.
Having all this HTF information, I can now form a bias as to where I expect price to go long term. Using this bias, I would typically then switch to a middle or lower time frame to scout out key liquidity zones.
- In my trading strategy, it is enough for me to look to enter a trade if a MTF such as 4hr and 2hr liquidity zone is hit. However, if a HTF such as weekly and daily liquidity zone is hit, that puts a larger emphasis on the zone.
Since we saw a mitigation of a strong weekly supply zone, that would be our signal to switch over to a Middle Time Frame (MTF) such as 4Hr and 2Hr to look for key liquidity zones that we could use to find further liquidity. Only after this step would we move to the LTF of 15 and 5 minutes to look for an entry. If we looked for zone entries on the HTF, our stop loss would be too large.
In our case today however, since that weekly supply zone has already been mitigated and we missed our initially entry, we must look for MTF liquidity zones where price may want to go next (if trend and bias is still consistent) to then find LTF entries on.
2. MTF (2HR and 4HR) Analysis - As we move down to our middle time frames, we notice that the massive weekly supply zone created in 2013 was tapped for liquidity in Sept. 2022 emphasizing this resistance level and creating further qualifying supply zones for future sellers. This proved correct recently when this supply zone was retested and mitigated in June 2023 creating a double top and pushing price down to retracement levels up to 50%.
a. After identifying our MTF unmitigated Liquidity (supply and demand) zones, we have a better idea of where price may need to go in order to tab more liquidity.
i. For buyers, price will want to mitigate demand zones below in order to replenish liquidity from sellers.
ii. For sellers, price will want to mitigate supply zones above in order to replenish liquidity from buyers
The case for buyers:
Confluence:
1. HTF Bullish CHoCH
2. Strong bounce & Support off 50% retracement
3. HTF Uptrend
4. Unmitigated supply zone above
For a short term buying opportunity without requiring a break of a strong resistance level, price will want to mitigate the supply zone above in order to sustain a move downward toward a HTF BOS.
- In this case, we would look for a move up to the 96.500 psychological level. Since we are in a LTF (15 min) uptrend, for entry into this trade we would await a pullback to recent unmitigated demand zones below. Our stop loss would be below the zone and take profit 1 at next BOS with take profit 2 being our MTF Supply Zone above.
o This would yield us a roughly 3.62 R:R trade opportunity for TP1.
o This would yield a roughly 5.85 R:R trade opportunity for TP2.
The case for Sellers:
Confluence:
1. HTF resistance points: Weekly resistance, double top, and top of trend line (6 previous rejections)
2. HTF Bearish CHoCH
3. Unmitigated demand zones below
For a short term or long term selling opportunity we would need to see a failed retest and subsequent BOS to the downside with convincing volume. Without this, we could be stuck in a consolidation phase prior to an upside breakout.
- In this case, since we just bounced off the weekly resistance with strong volume, we will now look for a LTF CHoCH, identify the LTF supply zone that caused it, and look for an entry with a reentry into that zone. Our stop loss would be above the zone and TP1 at our next BOS. Take profit 2 would be our unmitigated demand zone below
o This would yield us a roughly 3.63 R:R for TP1.
o This would yield us a roughly 9.63 R:R for TP2.
As always, this can go any which way and we need to hold off on trading until the reaction and settling of inflation data tomorrow.
Happy Trading 😊
Your ULTIMATE Guide For Time Frames in Trading
If you just started trading, you are probably wondering what time frames to trade. In the today's post, I will reveal the difference between mainstream time frames like daily, 4h, 1h, 15m.
Firstly, you should know that the selection of a time frame primarily depends on your goals in trading.
If you are interested in swing trading strategies, of course, you should concentrate on higher time frames analysis while for scalping the main focus should be on lower time frames.
Daily time frame shows a bigger picture.
It can be applied for the analysis of a price action for the last weeks, months, and even years.
It reveals the historical key levels that can be relevant for swing traders, day traders and scalpers.
The patterns that are formed on a daily time frame may predict long-term movements.
In the picture above, you can see how the daily time frame can show the price action for the last years, months and weeks.
In contrast, hourly time frame reflects intraweek & intraday perspectives.
The patterns and key levels that are spotted there, will be important for day traders and scalpers.
The setups that are spotted on an hourly time frame, will be useful for predicting the intraday moves and occasionally the moves within a trading week.
Take a look at the 2 charts above, the hourly time frame perfectly shows the market moves within a week and within a single day.
4H time frame is somewhere in between. For both swing trader and day trader, it may provide some useful confirmations.
4H t.f shows intraweek and week to week perspectives.
Above, you can see how nicely 4H time frame shows the price action on EURUSD within a week and for the last several weeks.
15 minutes time frame is a scalping time frame.
The setups and levels that are spotted there can be used to predict the market moves within hours or within a trading session.
Check the charts above: 15 minutes time frame shows both the price action within a London session and the price action for the last couple of hours.
It is also critical to mention, that lower is the time frame, lower is the accuracy of the patterns and lower is the strength of key levels that are identified there. It makes higher time frame analysis more simple and reliable.
The thing is that higher is the time frame, more important it is for the market participants.
While lower time frames can help to predict short term moves, higher time frames are aimed for predicting long-term trends.

Attention Traders. DON'T Make This MISTAKE in Top-Down Analysis
Most of the traders apply multiple time frame analysis completely wrong. In the today's article, we will discuss how to properly use it and how to build the correct thinking process with that trading approach.
The problem is that many traders start their analysis with lower time frames first. They build the opinion and the directional bias analyzing hourly or even lower time frames and look for bullish / bearish signals there.
Once some solid setup is spotted, they start looking for confirmations , analyzing higher time frames. They are trying to find the clues that support their observations.
However, the pro traders do the opposite .
The fact is that higher is the time frame, more significant it is for the analysis. The key structures and the patterns that are spotted on an hourly time frame most of the time will be completely irrelevant on a daily time frame.
In the picture above, I underlined the key levels on USDJPY on an hourly time frame on the left.
On the right, I opened a daily time frame. You can see that on a higher time frame, the structures went completely lost .
BUT the structures that are identified on a daily, will be extremely important on any lower time frame.
In the example above, I have underlined key levels on a daily.
On an hourly time frame, we simply see in detail how important are these structures and how the market reacts to them.
The correct way to apply the top-down approach is to start with the higher time frame first: daily or weekly. Identify the market trend there, spot the important key levels. Make prediction on these time frames and let the analysis on lower time frames be your confirmation.
❤️Please, support my work with like, thank you!❤️

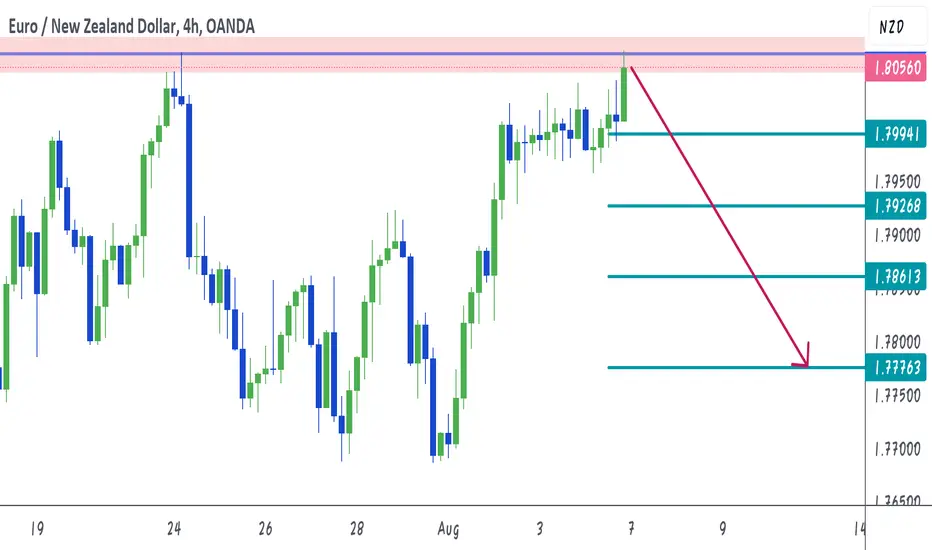
EURNZD SELL OPPORTUNITY Hey traders,
We have a nice opportunity to sell this pair
Let's see those reasons
Daily chart
Daily candle did not close above resistance
Hourly Chart
Before touching the resistance zone market made a small consolidate area,
And that touch would be the rejection
We have multiple targets
Trade safely with money management
Be happy
If you agree with our idea,
Please leave a <> to encourage us
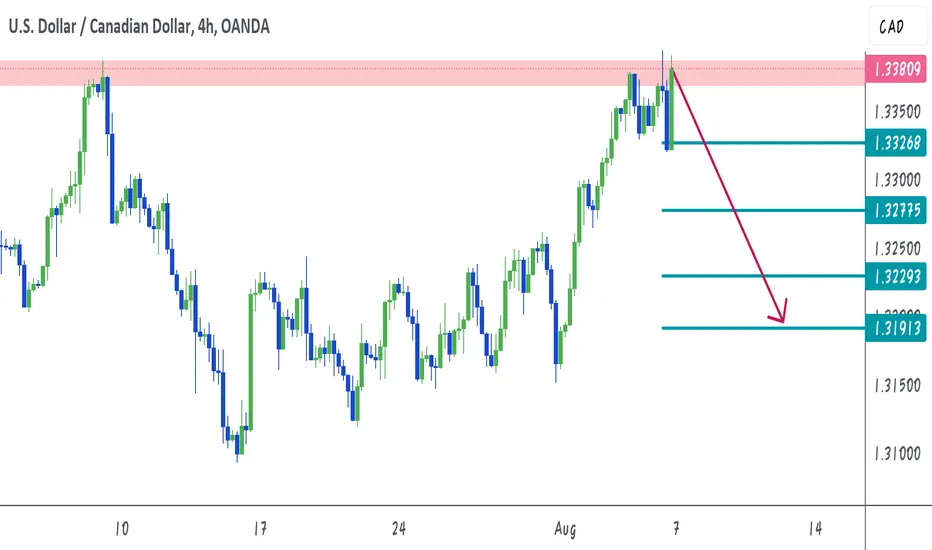
USDCAD sell opportunity Hey Traders
We have a trading opportunity here, Let's see those reasons,,,,
Daily chart
Daily candle did not close above the resistance area and forming a nice rejection
Hourly chart
Market formed a Double Top pattern and retesting resistance area
We have multiple targets
Trade safely with money management
Be happy
If you agree with our analysis
Please leave a <> to encourage us
Learn Why You Should Study Multiple Time Frame Analysis
In my daily posts, I quite frequently use multiple time frame analysis.
If you want to enhance your predictions and make more accurate decisions, this is the technique you need to master.
In the today's post, we will discuss the crucial importance of multiple time frames analysis in trading the financial markets.
1️⃣ Trading on a single time frame, you may miss the important key levels that can be recognized on other time frames.
Take a look at the chart above. Analyzing a daily time frame, we can spot a confirmed bullish breakout of a key daily resistance.
That looks like a perfect buying opportunity.
However, a weekly time frame analysis changes the entire picture, just a little bit above the daily resistance, there is a solid weekly resistance.
From such a perspective, buying GBPUSD looks very risky.
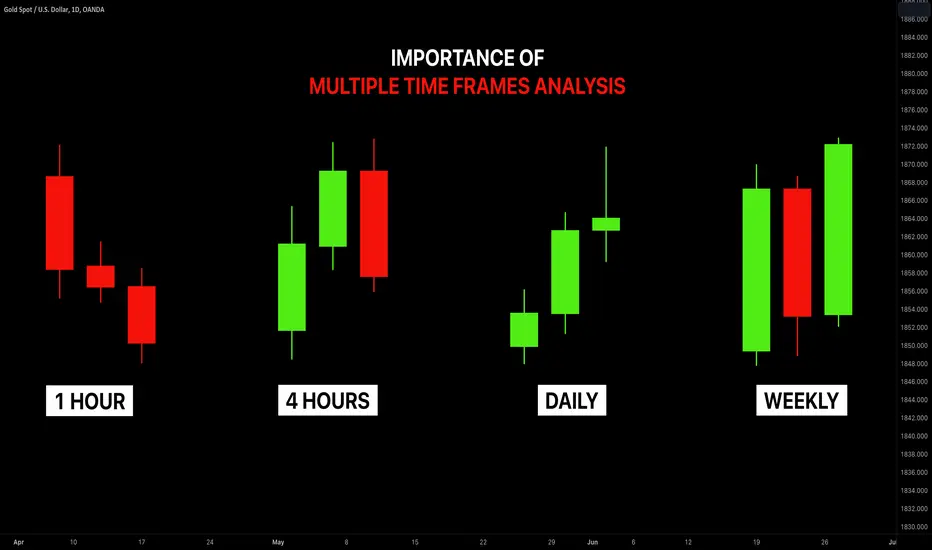
2️⃣ The market trend on higher and lower time frames can be absolutely different.
In the example above, Gold is trading in a bullish trend on a 4h time frame. It may appear for a newbie trader that buyers are dominating on the market. While a daily time frame analysis shows a completely different picture: the trend on a daily is bearish, and a bullish movement on a 4H is simply a local correctional move.
3️⃣ It may appear that the market has a big growth potential on one time frame while being heavily over-extended on other time frames.
Take a look at GBPJPY: on a weekly time frame, the market is trading in a strong bullish trend.
Checking a daily time frame, however, we can see that the bullish momentum is weakening: the double top pattern is formed and the market is consolidating.
The sentiment is even changing to a bearish once we analyze a 4H time frame. We can spot a rising wedge pattern there and its support breakout - very bearish signal.
4️⃣ Higher time frame analysis may help you to set a safe stop loss.
In the picture above, you can see that stop loss placement above a key daily resistance could help you to avoid stop hunting shorting the Dollar Index.
Analyzing the market solely on 1H time frame, stop loss would have been placed lower and the position would have closed in a loss.
Always check multiple time frame when you analyze the market.
It is highly recommendable to apply the combination of at least 2 time frames to make your trading safer and more accurate.
❤️Please, support my work with like, thank you!❤️
Topdown Analysis w/ Fib PullbackEntered at 1.27313. Monthly, weekly, and daily charts are trending up. Just follow the trading plan and let it play out.

Topdown analysis. Fibonacci pullback. Topdown analysis from month, week, day, 4hr, 1hr. There was an uptrend going on for the monthly and weekly time frames. Entered on 1hr/15min for the perfect Fibonacci pullback. Need to learn to be patient, trust myself, trust my stop loss and let the trade play out.
EURGBP: Detailed Plan Ahead of FOMC & FED 🇪🇺🇬🇧
Multiple time frame analysis on EURGBP.
Price action & key levels.
Directional bias & thoughts.
❤️Please, support my work with like, thank you!❤️

Learn How to Trade Multiple Time Frame Analysis
Hey traders,
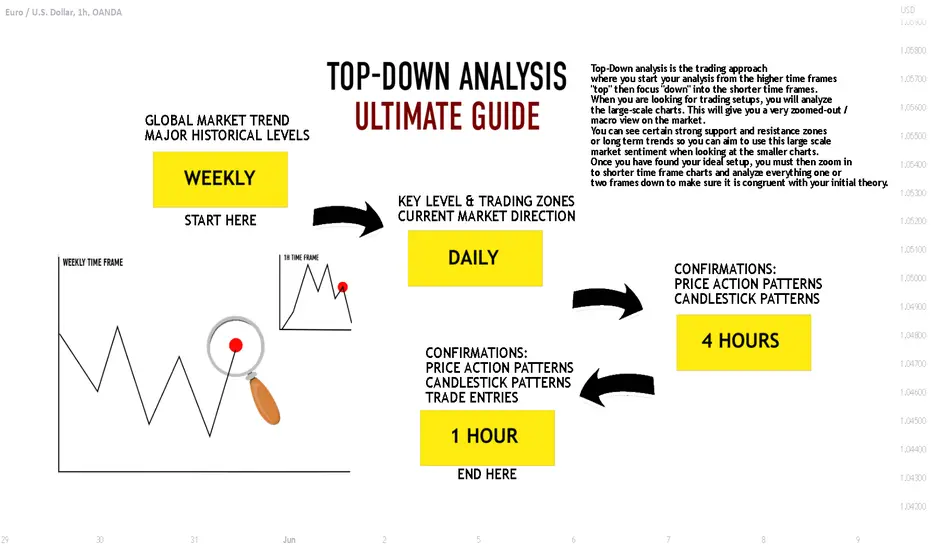
🔝Top-Down analysis is one of the most efficient ways to analyze & trade different financial markets. In this post, we will discuss the time frames to watch and the main steps to go through to execute a Top-Down trading strategy properly.
Being a Top-Down trader your task is to assess the global market perspective and identify the zones, the areas from where it will be relatively safe for you to trade it following the trend or catching the reversals.
➖Weekly time frame shows you the price action during the last couple of years. It unveils the major zones of supply and demand and indicates the long-term direction of the market.
Your task is to spot these zones and underline them.
The strongest market moves most of the time initiate from these zones.
At the same time, you must remember that on a weekly time frame the market is extremely slow. Being beyond the key zones 90% of the time, it takes many weeks, even months for the market to reach them.
➖Once you completed a weekly time frame analysis,
the next on your radar is a daily time frame.
Daily time frame shows you 1-year-long price action.
It indicates a mid-term sentiment.
And again, here your task is to simply identify the market trend and underline major key levels.
*It is highly recommendable to apply different colors for highlighting weekly/daily levels.
Completing weekly/daily time frame analysis, your task is to set the alerts on at least two closest support/resistance clusters. You must patiently wait for the moment when the price reaches one of them.
Once the underlined key level is reached, you start the analysis of intraday time frames.
➖The intraday time frames on focus are 4H/1H.
Your task here is to spot the price action/ candlestick patterns.
With such formations, the market unveils its reaction to the key level that it is approaching.
You are looking for a pattern that confirms the strength of the level.
Spotting the pattern you are looking for a trigger to open a trading position. Most of the time it is a breakout of a trend line or a horizontal neckline.
The breakout confirms the willingness of buyers/sellers to buy/sell from the underlined support/resistance . Only then a trading position is opened.
Here is the example how I analyzed and traded Gold using multiple time frame analysis:
1. I have analyzed weekly chart and spotted a key horizontal resistance
2. On a daily time frame, I found a rising trend line that matched perfectly with the underlined weekly structure.
3. Testing the confluence zone based on a trend line and a horizontal resistance, the price formed a double top pattern on 4H time frame. Its neckline breakout was my confirmation to open a short positing.
Entry point was a retest of a broken neckline.
The market dropped sharply, producing a very nice profit.
Of course, in practice, Top-Down analysis is very complex and many things and concepts must be learned in order to apply that strategy properly. Follow the steps described in this post, learn to identify key levels and recognize the price action patterns and you will see how efficient this strategy is.
Do you apply a Top-Down trading strategy?
Let me know, traders, what do you want to learn in the next educational post?
The Yen to take a Dump vs the Dollar. BUY UJ tomorrow AMUSDJPY is overwhelmingly bullish now that price has retraced on the Daily timeframe to form a Higher Low. From the top down its very evident that higher highs are on the horizon. There was some weekly indecision at the high last week at a strong resistance level. After a Daily bullish correction trendline was broken price retraced bearish to re-test the back of a trendline, 78.6 Fibonacci level, as well as a 3rd trendline bounce. This is all confluence for a long set-up. Last Thursday (5/4) and Friday 5/5) created two indecision candles on top of structure as well as a reversal signal in the mix. This is a recipe for a Long bias. A clear daily set up. Higher high. Higher low. Indecision on top of support. Price is currently on the buy side of two strong trendlines. I'm looking for a re-test to go long. for another Higher high, potentially to the next weekly Level.

BTC - Detailed Video Analysis From Weekly To H1 📹Hello TradingView Family / Fellow Traders. This is Richard, also known as theSignalyst.
Here is a detailed update top-down analysis for BTC.
Which scenario do you think is more likely to happen? and Why?
Always follow your trading plan regarding entry, risk management, and trade management.
Good Luck!.
All Strategies Are Good; If Managed Properly!
~Rich

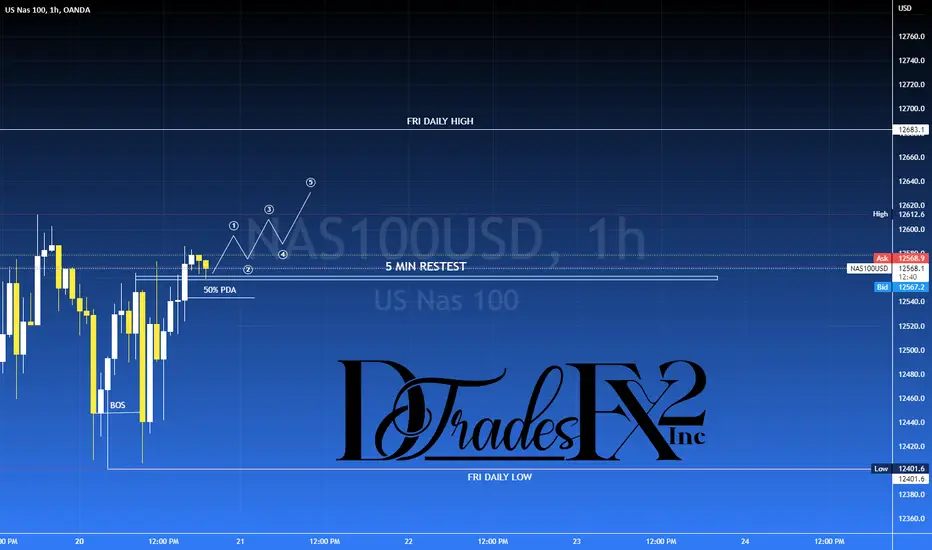
NAS100$NAS100USD After looking at QQQ and it breaking through the "Gap Fill" to the upside and the DXY being weak i'm looking for NAS100 to also continue to move to the upside.
My bias is long.
Disclaimer: This is not trade advice. Trading foreign currencies, stocks, indices, etc can be a challenging and potentially profitable opportunity for investors. However, before deciding to participate in the financial markets, you should carefully consider your investment objectives, level of experience, and risk appetite. Most importantly, do not invest money you cannot afford to lose!!!
Good luck and Happy trading!
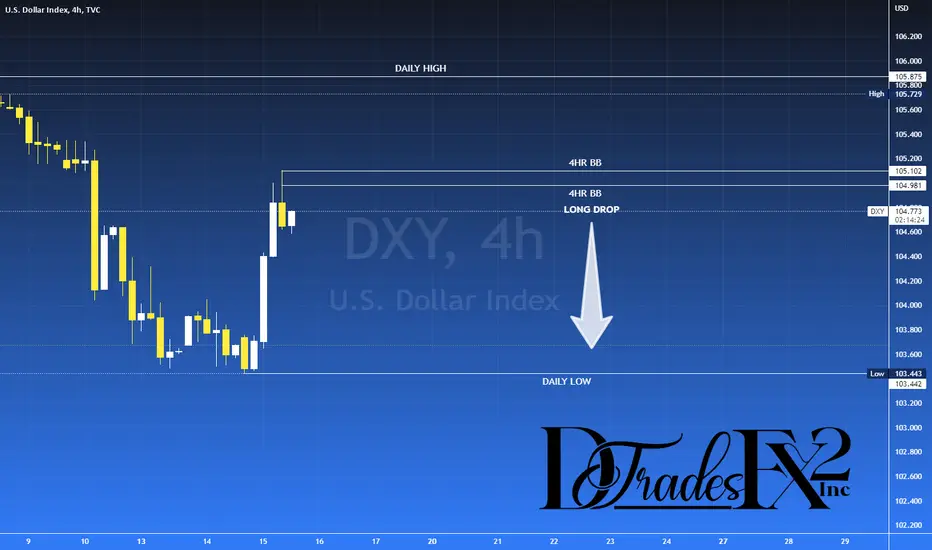
DXY$DXY Dollar Showed Little Reaction to CPI Data so i'm looking for the markets to act normal with no more major news ahead anytime soon.
Therefore, i'm looking for DXY to drop and make a correction.
Disclaimer: This is not trade advice. Trading foreign currencies, stocks, indices, etc can be a challenging and potentially profitable opportunity for investors. However, before deciding to participate in the financial markets, you should carefully consider your investment objectives, level of experience, and risk appetite. Most importantly, do not invest money you cannot afford to lose!!!
Good luck and Happy trading!