Don’t Panic — It’s Just a Healthy Crypto Correction!While the crypto market has seen some red this week, the bigger picture remains intact. Let’s zoom out and make sense of the current correction.
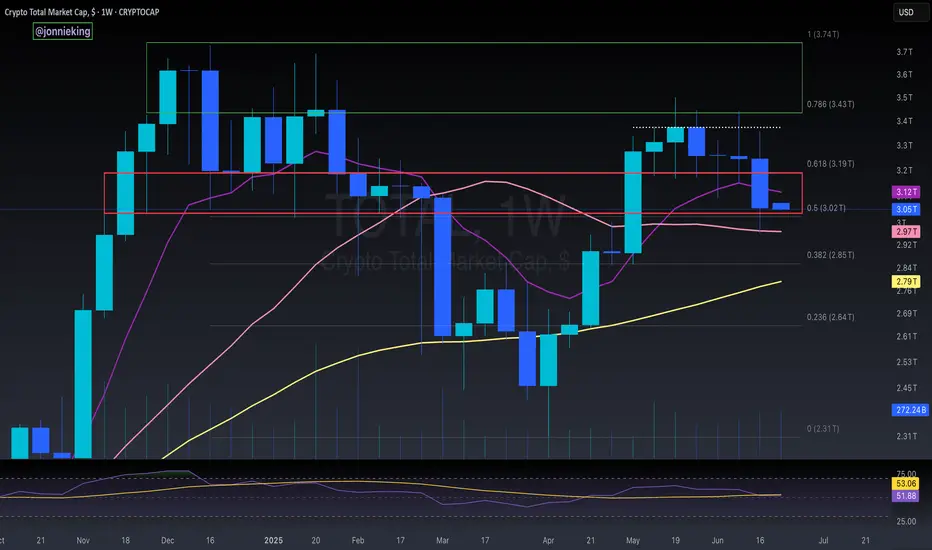
🔸 TOTAL Market Cap (left chart)
The structure remains overall bullish, trading inside the red rising channel.
After a solid rally, the market is currently pulling back toward a strong demand zone – perfectly aligned with the lower trendline. This area is likely to act as a major support, from which the next bullish impulse could kick off.
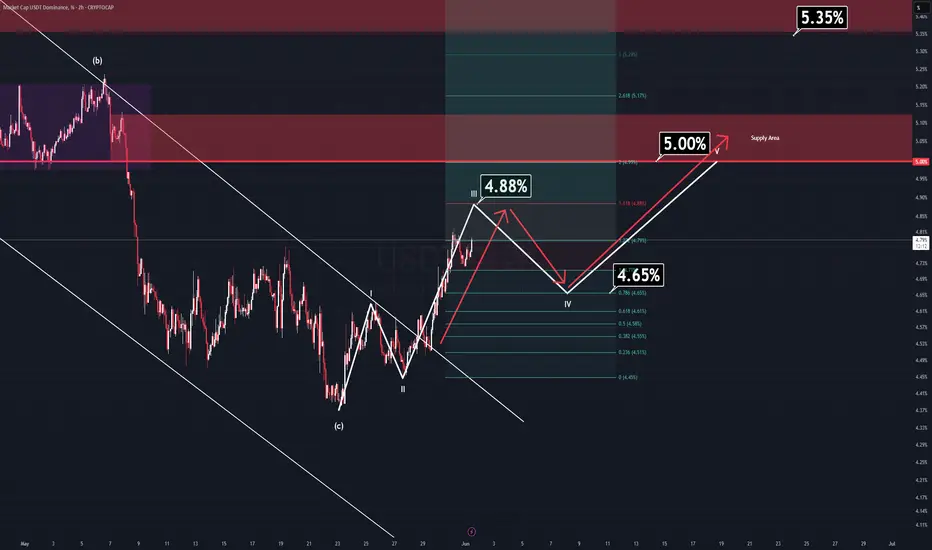
🔸 USDT Dominance (right chart)
USDT.D remains overall bearish, trading inside the red falling channel.
It’s currently pushing higher toward a well-defined supply zone, which also intersects with the upper red trendline. As long as this area holds, we expect sellers to take over again — giving altcoins the space they need to bounce back.
📌 In simple terms:
The market is in a healthy correction. Don’t let short-term dips shake your long-term view. The trend is still your friend.
➡️ As always, speak with your financial advisor and do your own research before making any investment decisions.
📚 Always follow your trading plan => including entry, risk management, and trade execution.
Good luck!
All strategies are good, if managed properly.
~ Richard Nasr
Total

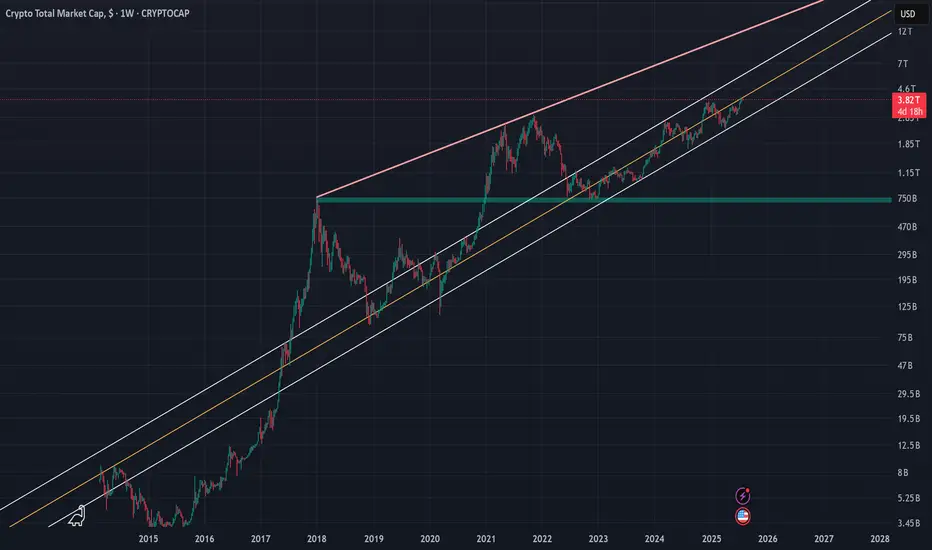
Crypto Total Market Cap (TOTAL) | 1WThe crypto market cap represented by the symbol TOTAL can be considered the most important index for analyzing the cryptocurrency market, although I believe that analyzing Bitcoin itself, given its strong positive correlation with the TOTAL index, would yield similar results. In the attached image, the red line actually indicates the overall resistance level of the symbol, and the drawn parallel channel illustrates the current upward trend of the TOTAL symbol, which is now on the verge of encountering its round resistance at 4 trillion dollars. While we should expect a correction around this level, breaking through the 4 trillion dollar resistance could likely lead to a market cap of 6 to 7 trillion dollars in the next phase. On the other hand, with support at 2.4 trillion dollars based on the 100-week SMA on the weekly timeframe, the 750 billion dollar level—marked by a green zone in the image—can still be considered the most important long-term market support, even before the fifth halving.
I will try to continuously update this analysis of the TOTAL symbol according to market changes and developments. Also, I welcome reading your critiques and comments, so don’t forget to leave a comment!
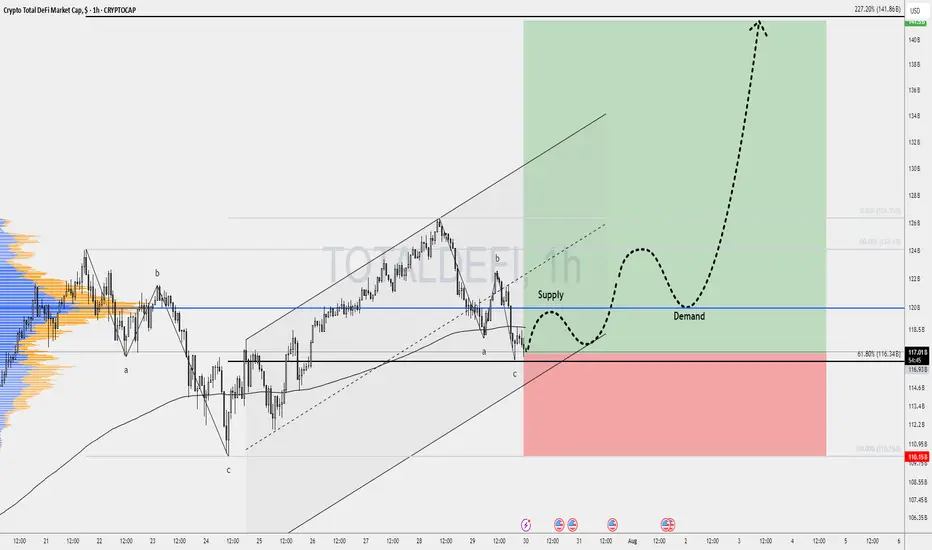
DeFi’s Make-or-Break MomentThe spotlight today is on TOTALDEFI, an index that could become one of the most exciting charts in the crypto market.
While many altcoins look heavy under selling pressure, TOTALDEFI is holding firmly at the 61.8% Fibonacci support near 116B. This zone is often a turning point where strong reversals begin. If the level continues to hold, we might see a 20% move to the upside, signaling renewed strength in the DeFi sector.
This price action could be a sign that decentralized finance projects are ready to lead the next market phase.
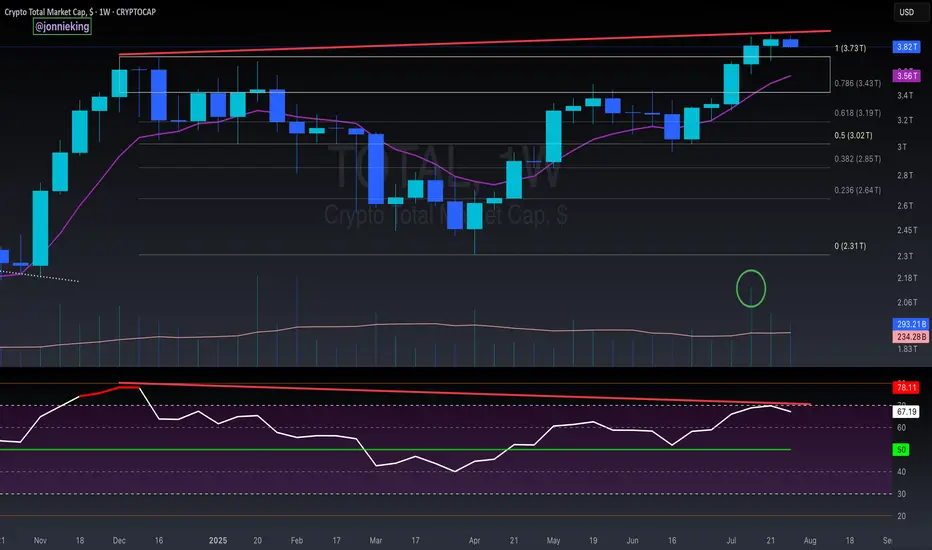
$TOTAL Market Cap Highest Weekly Close - Bearish Divergence?!Once again, highest Weekly Close on the Crypto CRYPTOCAP:TOTAL Market Cap ever.
PA continues to trend above the EMA9 and POI.
It’s worth noting Bearish Divergence on this local level.
I do not believe this is much to worry about however and have discussed this in prior analysis which I will post in the comments.
Strong Volume has shifted in the Bulls favor.
Bulls want to keep PA above $3.7T
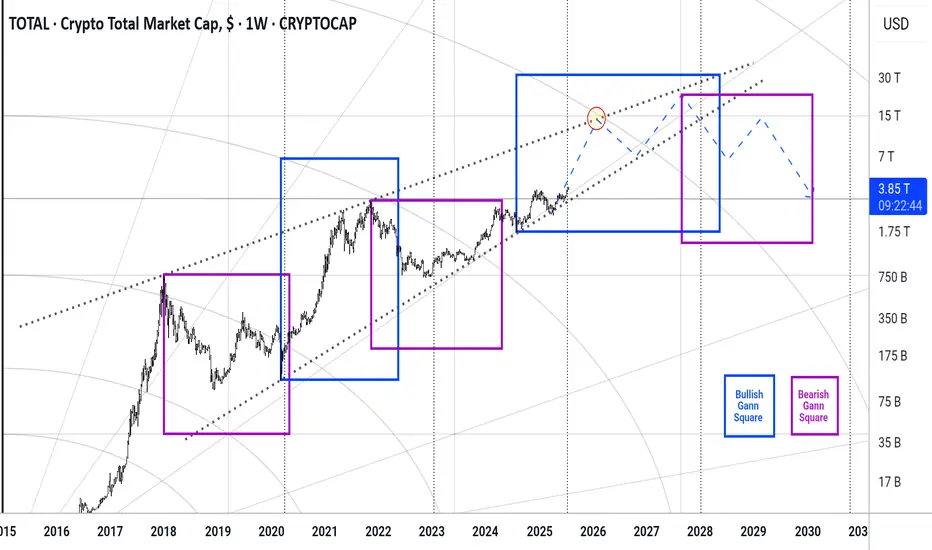
Total #002 ( Look at the Future !!! )Hello dear traders.
Good days.
First of all thanks for your comment and support.
---------------------------------------------------
In beautiful rising wedge of total market cap , the total market in this month broken 0.5 monthly Gann Square price level which means will be ready for test and retest 0.618 for final round befor market collapse.
With refer to the daily Bullish Gann Square ( Blue Square ) and Bearish Gann Square it is expected to within a year market will grow fast .
Safe trades and good luck.
BackTest should be COMPLETEDLet's see what comes next , rally to new ATH ? maybe some other corections along the way , or another wick close to bottom to scare thenpaper hands ? 🤔

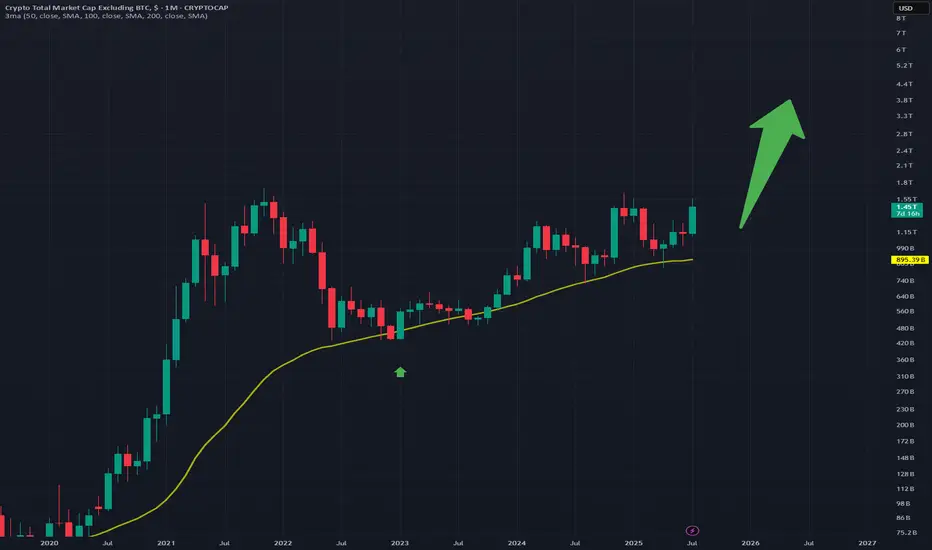
Strong Breakout for AltsBig breakout for the altcoins on this chart
It seems the bull market is starting, right now i think that XRP is the front of this race.
Great buy right now on this weekly
The SqueezeWhile it is logical to assume that the bulls are the ones about to get squeezed, I am going to be a contrarian and bet on the SHORTs getting liquidated, big time.
Good afternoon my fellow Cryptocurrency trader, how are you feeling this Saturday?
Every now and then, every once in a while the market enters a fight between down and up. When tensions rise, when people become anxious, when greed is strong, that's the time for a market squeeze to develop.
Seeing how good Bitcoin is doing, the strong Ether advance, how the altcoins are moving ahead and the rest, it is easy to rationalize that the market will squeeze all the over-leveraged LONG traders. I will repeat myself again, this is a SHORT squeeze.
Let's wait and see. Prices are going up. 1 Billion in liquidations coming next.
Let the bears run. Let's us start a mini bull-run phase.
Namaste.

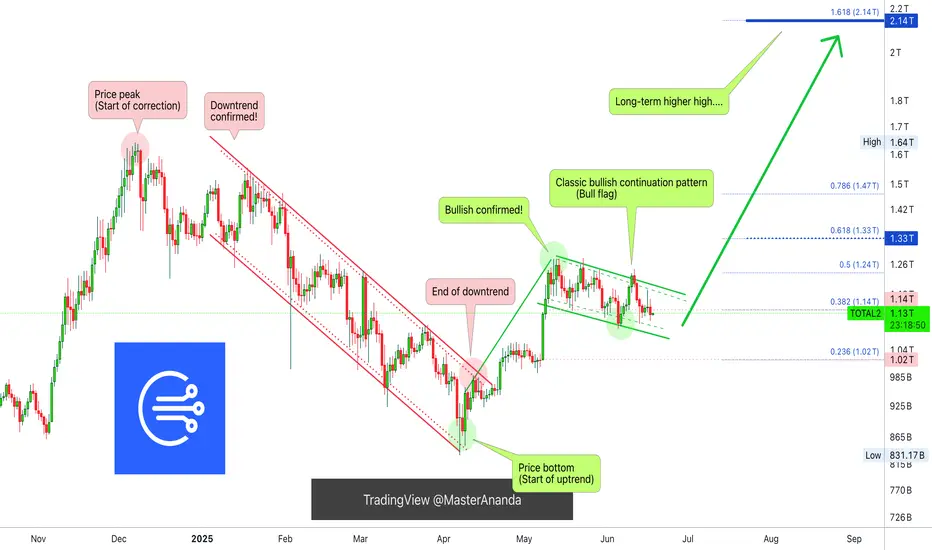
The Correction Is Over! Bull FlagThe bull flag is a popular pattern. Everybody who has seen a chart is familiar with this pattern. It is a continuation pattern.
When I say that the correction is over I am not talking about the short short-term, I am talking about the bigger picture.
Yes, bullish action is expected to start and intensify within weeks, no!, days. But still, with thousands of projects, it takes lots of time before energy (money) reaches all sectors of the market. Allow for strong variations but the correction is over which means growth.
The correction is over means that the low is already in for most pairs and will be in, in the coming days for all remaining pairs.
The correction is over means that everything will grow, just as it did after the 7-April bottom low. The difference is that this new wave will be many times bigger and stronger than before.
TOTAL2 produced an advance from early April until late May. The retrace produced a bull flag continuation pattern. The pattern has run its course, it will resolve with a new phase of growth. It won't take long. It will be obvious in a matter of days. No need to pray, Crypto is going up.
Namaste.
Crypto Market Update – July 14th🔷Market Update – July 14th: Another Winning Move 🧠🔥
Another week, another breakout – and we’ve been tracking it every step of the way.
💸 Entries? Perfect.
✅ Targets? Hit.
🧠 Psychology? Nailed.
Today, we reached 122,795 , hitting a key target with precision. From there, we took partial profits — and are now watching the next leg toward 127K+ .
We’ve had 4 amazing entries lately, all executed with structure, risk control, and vision.
Today’s move? Just the latest in a series of well-calculated trades.
📉 Support now rests at 120,500 , with deeper support still valid around 114,921 .
This isn’t just a lucky guess — it’s the outcome of following levels, structure, and behavior.
But if you want to go deeper into what’s really happening beneath the surface ...
📊💸 Read the NEW Deep Dive Part III:
The Next BIG Whale Play Unfolds →
Inside it:
🐳 How the bear trap is being set
🧠 Why this is a disbelief rally
⚠️ Why shorting now = adding fuel to the fire
💥 And why this may be the first leg of a much bigger run...
Stay sharp. Stay structured. Stay ahead.
One Love,
The FXPROFESSOR 💙
Disclosure: I am happy to be part of the Trade Nation's Influencer program and receive a monthly fee for using their TradingView charts in my analysis. Awesome broker, where the trader really comes first! 🌟🤝📈
📊💸 And don’t miss Deep Dive Part III – The Next BIG Whale Play Unfolds:

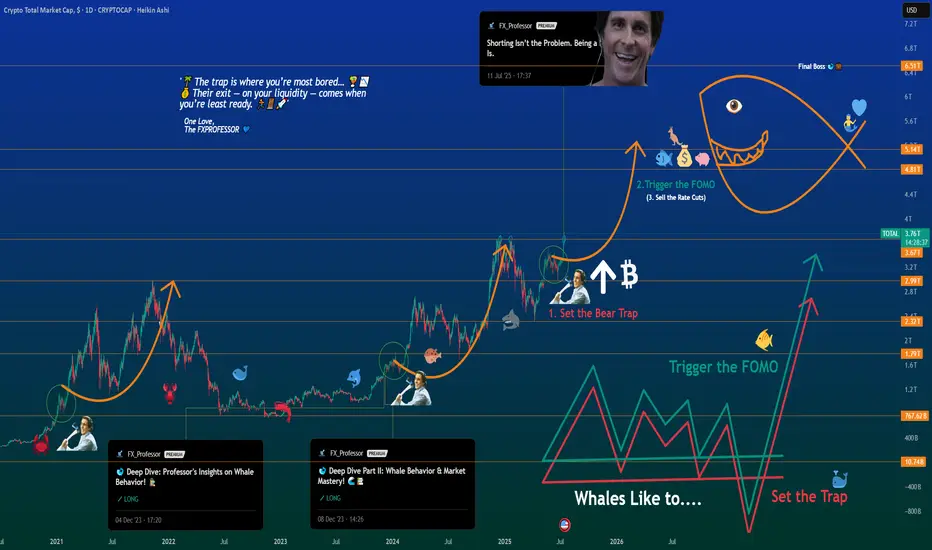
Deep Dive Part III – The Next BIG Whale Play UnfoldsDeep Dive Part III – The Next BIG Whale Play Unfolds
📍In Parts I & II of this Deep Dive, we broke down the psychology of whale behavior — from “Buy the Rumors, Sell the News” to the critical breakout zones that echoed historical patterns.
🐋 Back then, we spotted the whales' playbook early. The strategy was simple:
Buy the Rumors – Sell the News.
🧠 But now, the script has changed.
“The trap is where you’re most bored… 🌴📵
Their exit — on your liquidity — comes when you’re least ready. 💰🏄♂️💼”
Let’s break this moment down into what’s really unfolding.
We are officially entering the next stage of the cycle — not just in price, but in psychology.
This is no longer just about charts.
This is about human behavior on autopilot.
Here’s what I see happening right now — broken into three truths:
1️⃣ People Are On Holiday 🌞
From my community to the broader market, the energy is low.
People are either sunbathing on a beach or mentally checked out.
The focus is not there. The reflex to take action is dulled.
📉 The trap is where you’re most bored… 🌴📵
💰 Their exit — on your liquidity — comes when you’re least ready. 🏄♂️💼🚀
We’re seeing it unfold now:
1. Set the Bear Trap
2. Trigger the FOMO (will be down the road, yes)
3. Exit on Liquidity (the closing act of the play)
🕶️ But when everyone is away or asleep, that’s when the trap is laid.
It’s during these quiet, lazy days that the big moves get built.
2️⃣ This is a Disbelief Rally 🎢
The market trained everyone with a rhythm:
pump ➝ dump, pump ➝ dump, pump ➝ dump…
So what happens now?
People don’t trust the breakout. They’re frozen.
“We’ll dump again,” they say.
Except… what if this time, we don’t?
That disbelief becomes fuel.
It becomes hesitation — and hesitation becomes missed opportunity.
3️⃣ Bears Are Shorting Into Strength 🧨
This is key. While retail is confused, the bears are pressing in hard.
Their shorts are adding fuel to the pump they don’t see coming.
That’s why I posted recently:
“Shorting isn’t the problem. Being a psycho bear is.”
It’s not about being bullish or bearish —
It’s about timing , discipline , and narrative awareness .
Whales love this moment.
They lure in shorts, set the trap, then ignite the breakout straight into FOMO.
🧠 The Game:
Set the Trap → Trigger the FOMO → Exit on Liquidity 💥
This is what you’re seeing on the chart.
Not just price action — psychological choreography.
🕰️ In 2020–2021, we saw the exact same structure.
Part I warned about early accumulation and baiting behavior.
Part II showed how whales manipulated expectations with layered waves of doubt.
Now in Part III — the explosion few are ready for.
Zoom into the chart and it’s all there:
The curve, the trap, the trigger… and yes — the Final Boss.
🎯 The Final Boss: 6.51T
That’s the ultimate liquidity zone.
If this cycle plays out, we’re headed toward it.
“Sell the Rate Cuts” will be the new “Sell the News.”
It’s not the headlines that matter — it’s who’s left holding the bag.
🔚 Final Thought
The real exit — the one that traps most of retail — will come not when you’re euphoric,
but when you’re still saying:
“Surely we must dump now…”
So stay sharp.
Trade the chart — but don’t forget to read the behavior.
One Love,
The FXPROFESSOR 💙
Part1:
Part2:https://tradingview.sweetlogin.com/chart/idea/VgMBPsp3/
The Bear Trap:
Disclosure: I am happy to be part of the Trade Nation's Influencer program and receive a monthly fee for using their TradingView charts in my analysis. Awesome broker, where the trader really comes first! 🌟🤝📈
$TOTAL CRYPTO MARKET CAP BREAKOUT CONFIRMEDWhat a FILTHY Weekly Close back within the POI 🚀
Bulls are back in biz, for at least the next few weeks.
I’m expecting a bit of sideways chop here, and the next leg up the first or second week of August.
This is in no way, shape or form a call for “ALT SEASON”, yet.
Still need to see what happens in the next few weeks,
BUT IT LOOKS PROMISING 🙏

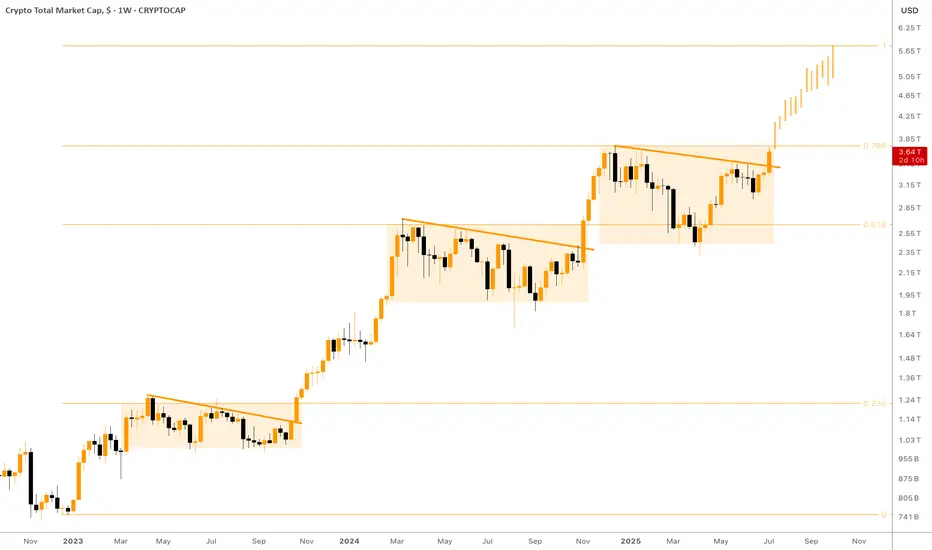
[CRYPTO] - Last Pump of the BULL CYCLE is ComingWe can see a highly organised bull cycle , with each multi-month consolidation wedge followed by a major leg upward, ending in breakout and continuation.
At the moment the CRYPTOCAP:TOTAL is breaking through the descending resistance again and ready to break thorough the 0.786 Fibo level as well - clear sign of the new up-rally beginning. Prior patterns (Q3 2023 and Q2 2024) led to vertical rallies , and the current structure suggests another leg may target the $6T+ zone in coming quarters.
What makes this different from past cycles is the underlying strength in Ethereum and other Altcoins. CRYPTOCAP:BTC.D has started to roll off highs, while projects like CRYPTOCAP:SOL , CRYPTOCAP:SUI and AI-related chains ( NYSE:FET , GETTEX:TAO , EURONEXT:RNDR ) are gaining TVL and developer traction. This is not just retail speculation—institutional capital is increasingly driving flows.
Moreover , Bitcoin ETF keeps getting huge daily inflows, the narrative of Coinbase including in S&P500 and Stablecoins velocity rising helps in spreading the crypto narrative between insituational & retail investors.
You can read more about why I expect a ton of money to inflow crypto in the next 6 - 12 months in one of the previous ideas: Again/
Overall , the chart structure, macro catalysts, and expanding adoption point toward a potential parabolic leg into late 2025 or early 2026. As long as the market holds above $3.3T, the breakout is valid and bulls are in control. The target is $5.5T —and possibly higher.
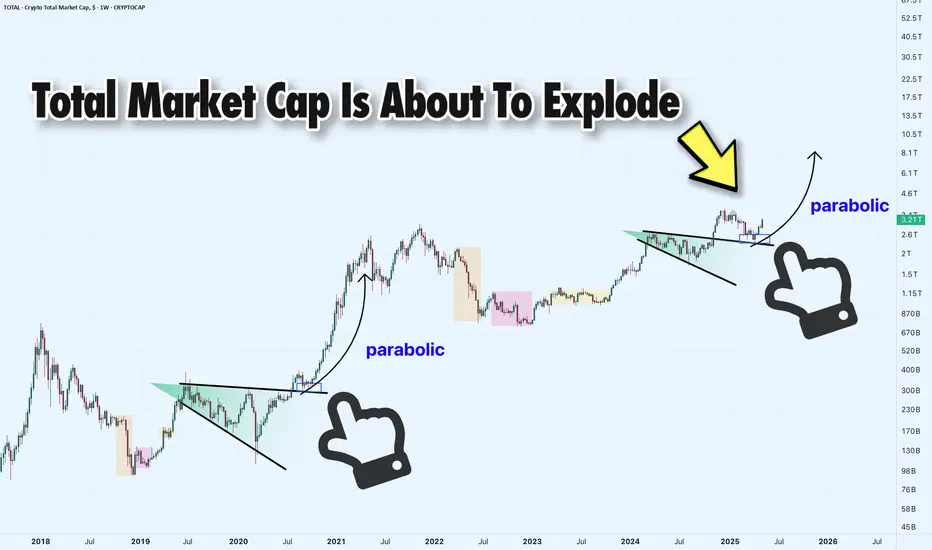
Total Market Cap Weekly Chart: Ready to Explode?Hey traders! Let’s dive into this weekly TOTAL Crypto Market Cap chart. The headline says it all— Total Market Cap Is About to Explode , and we’re here to break it down!
We’re seeing a massive expanding triangle formation, with the market cap currently at 3.21T , right at retest of triangle resistance. Historically, these patterns have led to parabolic moves — check out the 2019 - 2020 breakout! If history repeats, a breakout could send the market cap soaring toward 8.0T or even higher!
However, if the breakout fails, we might see a pullback to the previous level of support around 2T .
Key Levels to Watch:
Resistance: 3.66T (ATH)
Support: 2T
Breakout Target: 8.1T+
Breakdown Risk: 1.20T (latest strong resistance below 2.6T)
Is the market cap about to go parabolic, or are we in for a fakeout? Let’s hear your thoughts below!
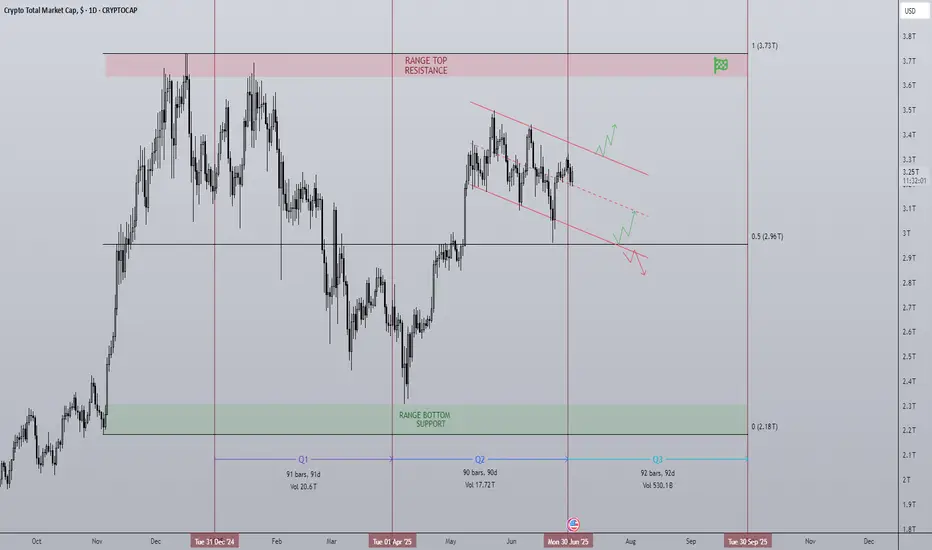
TOTAL Q3 As Q2 closes, Q3 begins...
The 2nd quarter of 2025 made up for a lot of the losses of Q1 peaking at $3.5T in the middle of the quarter. Since the peak a steady downtrend channel has formed and continues to be the case going into Q3.
What can we expect to see in the next 3 months in the crypto market? For me there are two different scenarios that are bullish, and one that is bearish IMO:
Bullish scenario 1 - The most likely scenario I think is a breakout above the downtrend channel and a move towards the range top. My reasoning for this comes from what we know about the driving forces in the market. Just last week BTC ETFs had a $2.2B net inflow, MSTR bought another 4,980BTC for $531.9m, various ETFs on the way for other majors such as SOL. Crucially the M2 money supply is at a record ATH. What that means is huge demand and the means to purchase with a what feels like a deadline closing in.
Bullish scenario 2 - We see a trend continuation until the range midpoint which has provided support before. It would coincide with the bottom of the trend channel and therefor I believe would provide a good launchpad for long positions.
Bearish scenario - For me this is the least likely situation but one that must be prepared for, a loss of the range midpoint would be a major setback, one that would mean a potential revisit of the range low in a symmetrical move down mirroring Q2s move up. The reason I believe this is the least likely is there is just too much in favor of risk on assets like crypto currently, I've mentioned the fuel that is the M2 money supply piling up to be deployed. A US interest rate cut all but confirmed for September and the institutional race for acquiring these assets before it is too late.
In conclusion just keeping it simple on the chart, a breakout above the trend channel is a great long opportunity to target the highs.
If BTC continues the grind down a great place for it to turn bullish is the range midpoint as has happened previously.
In the event BTC loses the midpoint a retest of the weekly low would make sense to me.
TOTAL SELL SIGNAL 25/Jul/9The TOTAL chart has shown a structural change in the 4-hour timeframe, indicating weakness in the bullish trend. Don't rush into buying and avoid falling into FOMO.
⚠️ This Analysis will be updated ...
👤 Sadegh Ahmadi: GPTradersHub
📅 2025.Jul.9
⚠️(DYOR)
❤️ If you apperciate my work , Please like and comment , It Keeps me motivated to do better

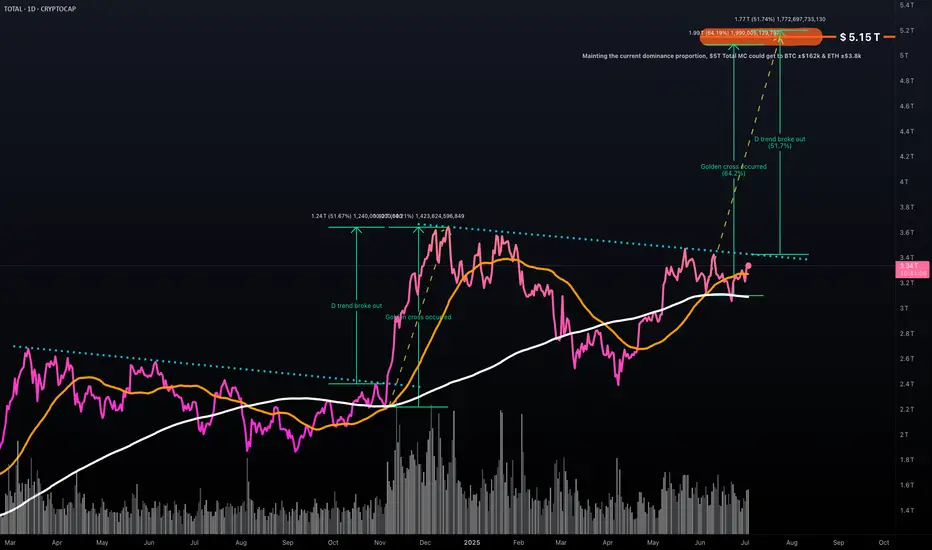
Crypto Tide Rising: Will TOTAL Market Cap surf past $5T?In November 2024 the crypto ocean was calm, hovering near $2.25T . Then, in a short time, fresh capital poured in, daily volume spiked, and the tide lifted us to $3.65T by mid-December .
Two bullish buoys popped up:
▶️ The daily down-trend snapped on Nov 4th, triggering a 51 % climb;
▶️ The 50-day MA (orange) crossed above the 200-day MA (white) on Nov 7th, after a 64 % rally.
Fast-forward to June 4th 2025 . Another Golden Cross has just flashed, and price is again nudging that descending trend-line. If History rhymes: the line breaks and momentum matches 2024’s move, the TOTAL MC could vault toward $5T .
Keeping today’s dominance ratios, that target implies roughly $162 k BTC and $3.8 k ETH . Add rising Global M2 and stablecoin liquidity, a supportive macro backdrop, and we may be staring at the next great crypto swell.
Will the market catch this wave or will macro headwinds keep the tide in check?
Not financial advice. DYOR, Arrr!
Crypto $TOTAL Market Cap Hopeful Weekly CloseWhat a wild close to the Week for the Crypto CRYPTOCAP:TOTAL Market Cap
Closed just above the 50% Gann level within the POI, but failed to close above the EMA9.
Strong bounce off the SMA20 still shows bull have some gas left in the tank, but I suspect we go lower with such a massive bearish candle on the week.
SMA50 is ~2.8T
TOTAL 2 Analysis (6H)The TOTAL2 chart — representing the altcoin market cap excluding Bitcoin — currently shows signs of weakness. A double top formation has emerged and is actively playing out. In addition, a micro trend change of character has clearly appeared, further validating short-term bearish pressure.
Technical Observations:
Price recently retested a broken support level and failed to reclaim it — a typical bearish confirmation.
In such scenarios, it’s common for the price to decline at least the depth of the double top formation.
However, it’s important to note that macro trend indicators still remain bullish, so entering aggressive short positions is not advised. Instead, consider setting alerts at the key reversal zones marked on the chart — these levels are likely to trigger a strong rebound.
If TOTAL2 breaks above the $1.23T resistance, this double top analysis becomes invalid.
— Thanks for reading.
USDT Dominance Update (2H)The USDT Dominance (USDT.D) chart — often referred to as the “reverse chart of crypto” — is currently showing signs of strength. On the micro time frame, a new impulsive wave structure has emerged, and we are likely progressing through wave 3 of this formation.
Wave 3 appears to be targeting the 4.88% level.
A minor correction (wave 4) may follow.
Ultimately, wave 5 is projected to reach the 5.00% zone.
Market Implications:
If this scenario unfolds as expected:
Bitcoin could down toward the $100,000–$101,000 range.
However, altcoins may face a sharp correction, with potential losses of 15–20%, exacerbated by the rising BTC dominance and capital flow concentration.
⚠️ While macro bullish momentum remains intact for the market, this short-term USDT.D surge could present a temporary but significant shakeout, especially across the altcoin sector.
— Thanks for reading.
$TOTAL – Is This Another Bull Trap in the Making?The total crypto market cap ( CRYPTOCAP:TOTAL ) has surged from $2.32T and is currently trading around $3.25T, continuing its upward trajectory. On the surface, things look bullish—but is there more to the story?
Looking at the chart, the current market structure bears a striking resemblance to previous cycles:
• 2021: Massive bull run
• 2022: Painful bull trap
• 2024: Another explosive rally
• 2025: …potential bull trap?
If history is any guide, we could be nearing a critical turning point. The pattern suggests caution—could this rally be setting up for another steep correction?
My Take: Momentum is strong, but the similarities to past cycles are too close to ignore. If the market stalls at current levels, the risk of a bull trap becomes very real.
What do you think—repeat of history or a new chapter for crypto?
Please support this idea with a LIKE👍 if you find it useful🥳
Happy Trading💰🥳🤗

TOTALCAP — The Next Trillion Crypto Move: Are You Ready?When people analyse the crypto market, they often default to Bitcoin and for good reason. It’s the one and only, the king. But sometimes, to see the forest instead of just the tree, you need to zoom out and study the broader picture.
That’s where the Crypto Total Market Cap (TOTALCAP) chart comes in. It’s essentially the mirror of Bitcoin, but it offers powerful macro insight — not just price, but scale. Looking at trillions instead of dollars changes how you frame support, resistance, and overall sentiment. Let’s dive in.
🧠 Why TOTALCAP Matters
TOTALCAP aggregates the value of every coin and token — the complete valuation of the entire crypto industry.
And while it often moves in sync with Bitcoin, it carries a different weight.
Shows the “big picture” of institutional and retail money flow
Offers clearly defined round-number zones (Trillions) as psychological S/R
Removes coin-specific anomalies and focuses on collective momentum
In bull and bear markets, these trillion-dollar thresholds act like major checkpoints. Watching how TOTALCAP interacts with these levels can give early signals that BTC or alts alone can’t.
Historical Key Levels & Structure
Let’s break it down by macro phases:
✅ November 2021 — Peak of Last Bull Market:
TOTALCAP peaked exactly at $3 Trillion.
This level acted as a ceiling — once hit, the market reversed sharply.
This marked the top of the 5-wave impulsive move (Elliott Wave theory).
📉 November 2022 — Bear Market Bottom:
TOTALCAP dropped below $1 Trillion, bottoming at $727 Billion.
This was almost a 0.786 fib retracement from peak — similar to BTC’s historical retracements.
The $1T mark was retested as resistance before being reclaimed as support.
📈 2023–2025 — The Bull Awakens:
$1 Trillion flipped into solid support throughout 2023.
A clear sign the macro market structure had shifted bullish.
Once $2T was breached, things moved fast.
🚀 Current State:
The market surged above the previous $3T ceiling.
TOTALCAP has hit a new ATH: $3.73 Trillion
Now, the question is: Is this the start of a new leg higher, or a bull trap before a correction?
🔍 Fibonacci Confluences — Why $3.7T Was Key
The sharp rejection at $3.7T wasn’t random. It aligns with:
1.0 Trend-Based Fib Extension: From 91.24B → 3T high → 727B low = 1.0 = 3.65T ✅ precise hit
1.272 Fib Extension of the macro move
Upper Pitchfork Resistance
Channel Top Rejection
→ All signals converged to mark that level as major resistance
🌀 Elliott Wave Macro Count
Looking at the weekly timeframe, we can see a clear impulsive 5-wave movement from the 2022 lows:
Wave 1: $727B → $1.26T
Wave 2: Correction to $975B ($1T) (support confirmed)
Wave 3: Massive rally toward $2.72T
Wave 4: Pullback toward $1.69T (VWAP retest)
Wave 5: $3.73T ATH
What does this imply?
According to classical Elliott Wave theory, after a full 5-wave move, the market tends to enter an corrective phase.
🔍 Some key levels to watch:
$3T: Historical S/R (was the 2021 top, now acting as a key level)
$2.31T: Recent swing low
$2T: Psychological and structural support
📌 Zone of Interest for Longs: $2.31T–$2T
This zone holds:
Previous consolidation zone from mid-2024
Fib retracement confluence
Likely forming Wave C bottom if this is a full ABC
🎯 Upside Targets — What If We Continue Higher?
Looking ahead:
🔸 1.618–1.666 Fib Extension = $4.42T–$4.53T
🔸 1.618 TBFE from previous cycle = ~$5.45T
📌 Rounded Targets: $4.5T, $5T and $5.5T
These are the next likely macro cycle targets — but only after a healthy correction and consolidation.
☀️ Macro Context & Summer Seasonality
Historically, summer tends to be a weaker period:
Lower volume
Institutional rebalancing
Geopolitical and macroeconomic uncertainty
📚 Educational Insight: TOTALCAP as a Tool
Treat TOTALCAP like the S&P500 of crypto.
Use round trillions as psychological levels: 1T, 2T, 3T, etc.
Always check if BTC’s price is aligned with where TOTALCAP is on the macro structure
Helps judge market strength even when BTC dominance is shifting
It’s especially useful when altcoins pump or dump out of sync with BTC — you can use TOTALCAP to track the real flow of money.
💡 Final Thoughts
We are likely in a corrective phase after a complete 5-wave cycle.
The area between $2.31T and $2T offers high-probability long entries
Watching how TOTALCAP reacts to these levels will help us anticipate the broader market’s next move
Summer slowdown could mean chop — but this also creates opportunities
💬 Let me know your thoughts: Are we entering a deeper correction? Or will TOTALCAP surprise us with a new leg higher?
Don’t forget to zoom out. The charts always tell the story.
_________________________________
💬 If you found this helpful, drop a like and comment!
Want breakdowns of other charts? Leave your requests below.

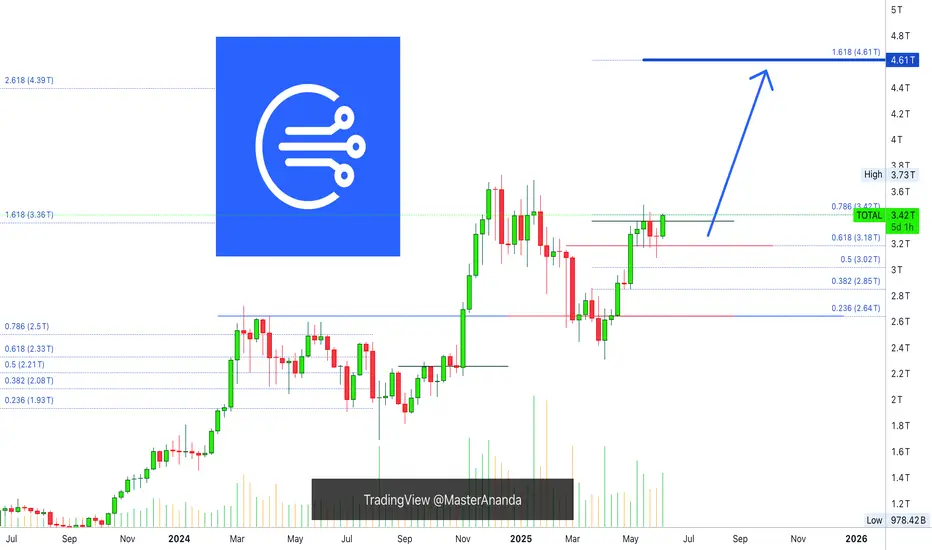
The 23 Years Long Cryptocurrency Bull Market CycleWe are looking at Crypto Total Market Cap. Index (TOTAL).
The weekly session trades at the highest level based on candle body since January 2025. The recovery has been swift. It started in April and after three green weeks there was a red week. Then three more green weeks followed by two red weeks. And now we are green again.
If the same pattern repeats, we get three green weeks or more followed by another retrace small in size. The main target for this already big bullish wave stands at 4.61T. This is a very strong bullish period already as it started in early April, it has been going for more than two months.
The market tends to grow and become more and more bullish, that is, bullish momentum starts to grow. When the action is really heating up doubt starts to creep in. Will it really continue higher? Is there a crash just around the corner? The crash happened last week.
If you notice last week's candle, it has a long lower shadow and a very small real body. It is a classic reversal signal. This week being full green confirms this reversal but the week is early.
TOTAL is the entire Cryptocurrency market, then we have individual charts. When we look at some altcoins in isolation, we know the top is far from being in, we know this only too well. Let's look at some examples. Ethereum, far from the top. Litecoin, very far. Dogecoin, Cardano, XRP, etc, etc, etc.
Bitcoin is now a completely different domain and is basically trading at a new all-time high. If this was the case while all the altcoins are also at new ath this would be worrisome, but the truth is that Bitcoin now has institutional demand and that's why it is so strong. There is no point in selling because whales are buying and will continue to buy, money is endless of course and money is becoming cheaper and cheaper all around the world. It is also coming to country near you but it is already happening. Remember, the cycle goes up and then down when it comes to interest rates. It already hit the top, peaked and now it is going the other way. This to say that there is room for so much growth.
Things tend to repeat, cycles tend to repeat until they don't. Literally, you can have a pattern where you do the same daily, weekly, monthly, for years until some time when you stop, it works like this with Crypto and other areas of the world. Bitcoin can produce a certain cycle and a certain pattern for 15 years straight, and then, all of a sudden things change. Not out of nowhere of course, we are seeing the world changing right in front of our eyes. Technology?
Where was the world 80 years ago?
How much change we saw between 1980 and 2010?
How about 2021 and the pandemic? You see, it continues to change.
Now it is money. You can have centuries of the same financial system, the same monopoly, all the same. Then you have credit cards and virtual bank accounts and now it is code, Crypto; nothing new, it is the same old, the only thing permanent is change and the world continues to change.
So Bitcoin can have big drawdowns just a few years ago, and in the present, these become smaller and smaller, the same happened with the stock market and the biggest stocks. It keeps on changing.
It goes from highly volatile, unpredictable and unstable to stability and growth long-term. Humanity is on a rising trend and this will always be reflected across all areas of life, finance, health, education, freedom, prosperity, liberty and the rest.
We are going up. Forever and then some more.
It is great to be alive in this world.
Namaste.