long term uptrendAs long as the price is in the long-term channel
For Bitcoin, we can not imagine a price below $ 30,000
Total

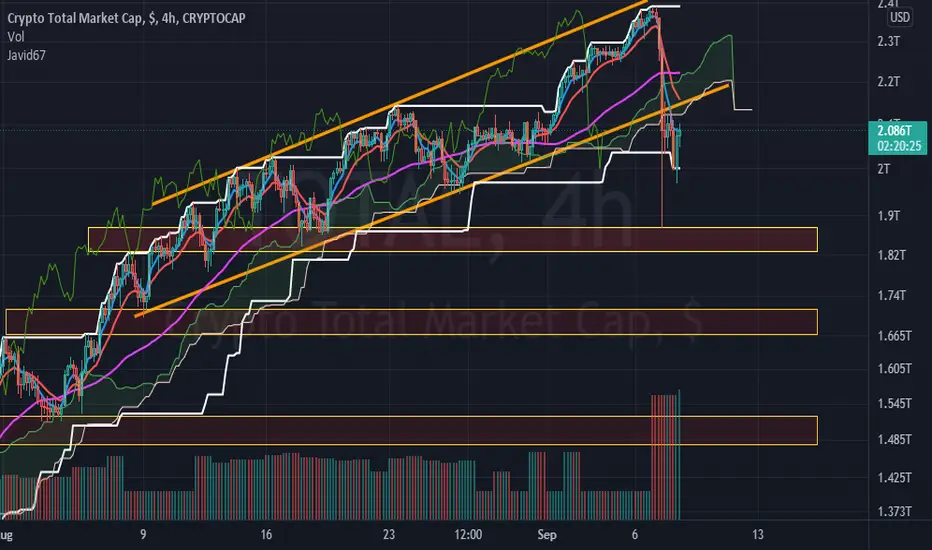
TOTAL MARKETCAP!The Total Index was within the resistance range to which it reacted and experienced a relatively heavy correction market. According to the 4-hour chart, Total was moving within a bullish corner pattern, which, with its loss, seems to have entered a corrective phase in the market.Friends, push the like button, write a comment, and share with your mates - that would be the best THANK YOU.

TOTALThe value of the crypto market has gone out of its uptrend channel
Due to the shape of the Ichimoku cloud and if exciting news is not sent to the market
At best, we will stay in the downtrend for about a month
To return to the first uptrend, there must be absolute fear in the market
In any case, this price drop is just a correction
Do not trade in market excitement and
In the previous sponsorships, buy good COIN step by step
Good luck
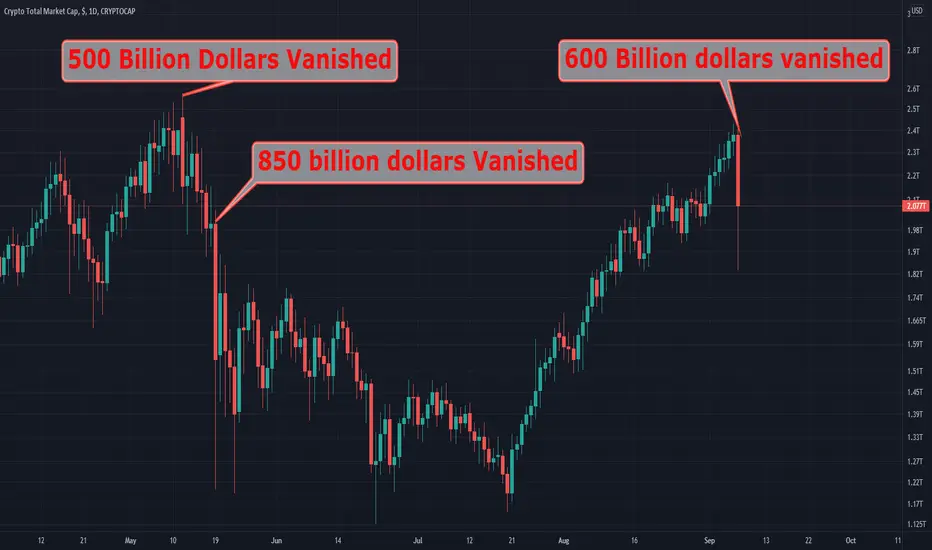
Liquidity Cascade, Whale Effect or a bigger Scheme???In this 5 minute chart, you can see CRYPTOCAP:TOTAL BITMEX:XBT CURRENCYCOM:ETHUSD FTX:SOLUSD KRAKEN:ADAUSD .
This level of coordination couldn't be Liquidity Cascade or Whale Effect.
What is it? I could not find an evidence base reason for it but this phenomenon is so big and fast that could not be Algorithmic trading of institutions or retail traders or what so ever..!
I checked the 1-minute chart as well :
It seems there is a superpower that overrules all other players..!
I am 100% sure this is not the last time this phenomenon happens and it will be repeated again very soon, in less than 100 days..!

Why dont you drop?i don't know why...??!
divergences in any indicator, greedy and fear index, raising wedge on BTC ...
you have fall, but when ?!
Are you waiting for 0.618 time line ??
maybe
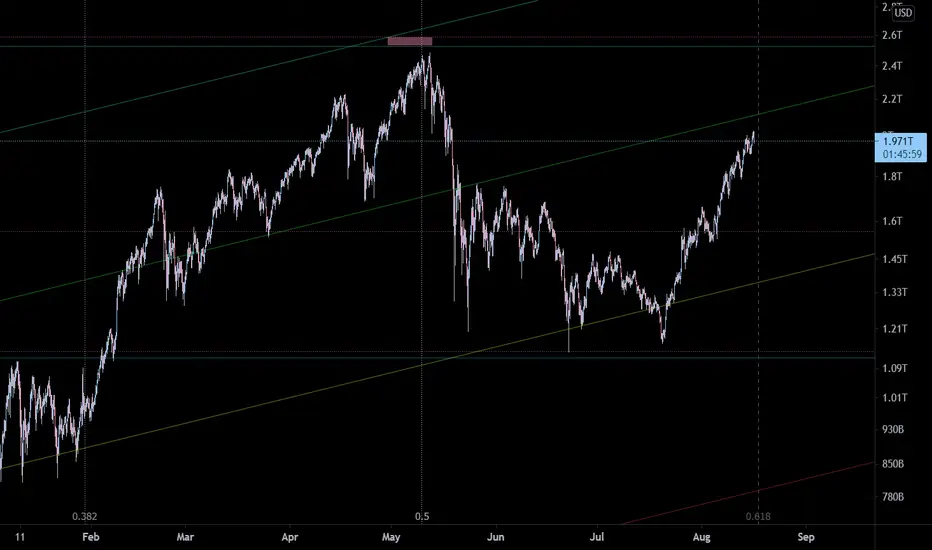
China or United States ??? I believe this could not happen due to Tweets or retail traders' reactions to tweets..!
Is it a War between governments???
Is it a new taxation method???
what do you think is the reason behind it?
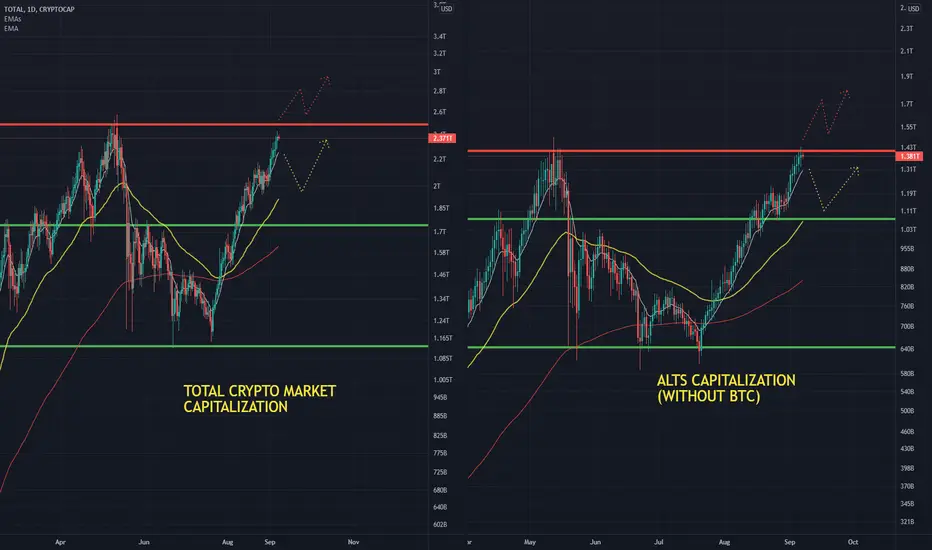
Crypto Market Capitalization is touching last ATH'sCrypto Market with BTC still has a little road to go until last ATH (red line), but TOTAL ALTS capitalization(without BTC) is touching his last ATH, so its at crucial point right now.
Be careful, tomorrow BTC has a fundamental with El Salvador making it legal money, this can lead to a new 2021 Bull Run or could be the start of a correction, as BTC is touching 68.70% Fibo right now at 52.500.
Regards.
Eng Alexa.
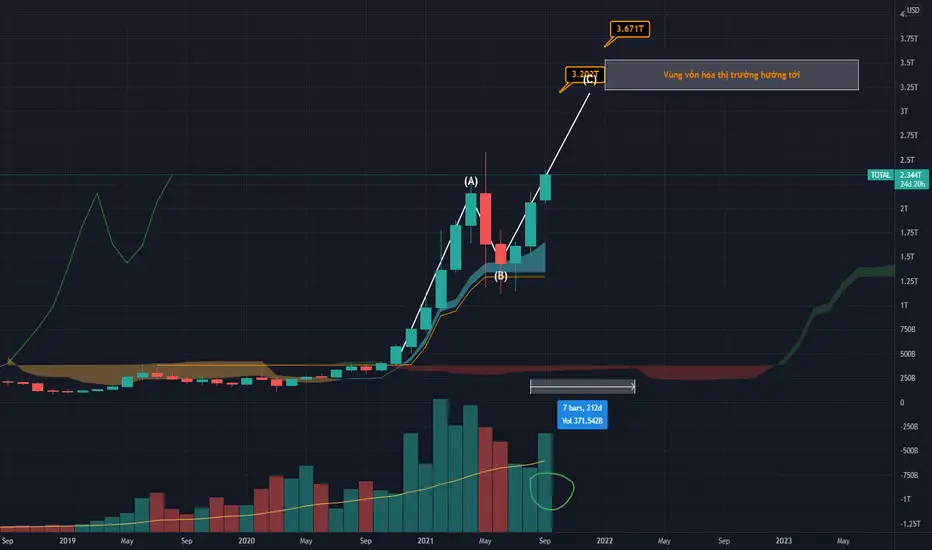
Total market - Target 3200B $. Total market chart Month - Total market break out Ichimoku cloud.
Target 3200 B$
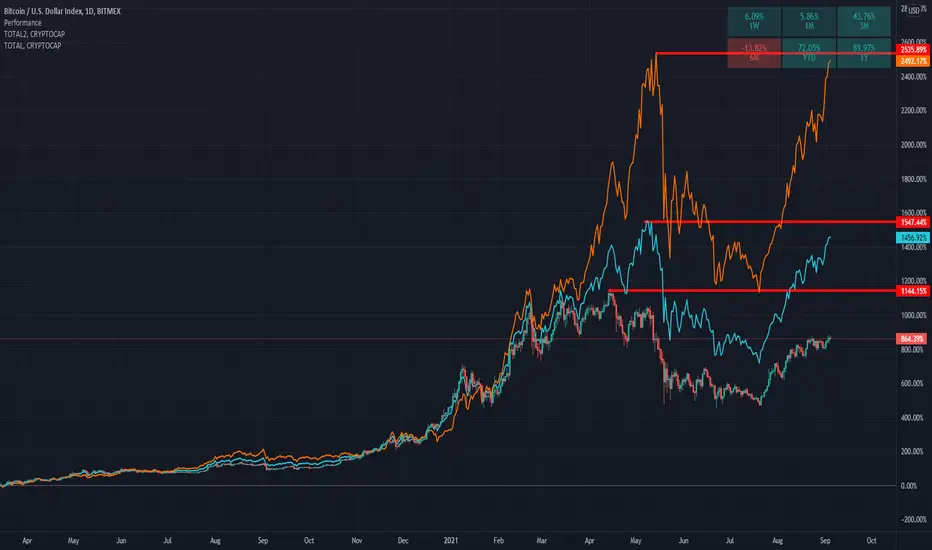
Bitcoin or Altcoins?April 2020 - April 2021 :
Total outperform Bitcoin by 27%
April 2021 - September 2021:
The gap is still 27%
Now let's look at Total 2 and compare it with Bitcoin:
April 2020 - April 2021 :
Total outperform Bitcoin by 660%
April 2021 - September 2021:
The gap is 60%
This comparison clearly shows people tend to invest and trade altcoins..! while Total2 is approaching its all-time high, bitcoin is 25% below its All-time high..!
The story for Ethereum is different!
DISCLAIMER
I’m not a certified financial planner/advisor nor a certified financial analyst nor an economist nor a CPA nor an accountant nor a lawyer. I’m not a finance professional through formal education. The contents on this site are for informational purposes only and do not constitute financial, accounting, or legal advice. I can’t promise that the information shared on my posts is appropriate for you or anyone else. By using this site, you agree to hold me harmless from any ramifications, financial or otherwise, that occur to you as a result of acting on information found on this site.
I was close. Double Top or Bump and Run to Cup and Handle? ATHWill it pop? We're getting close to a saucey cup. What do you think?

total markets mapOverview of the whole market in the medium term Of course, if the canal ceiling breaks, the issue will be different

TOTAL (Crypto Total Market Cap)As we can see, we can expect more Fall from the Crypto market cap ...
Crypto Total Market Cap, CRYPROCAPHello traders. Everything is clear on the chart for you like always, The market under resistance and seems prone to correction. Overall, this is good for the market. consider it. Good luck.
If you like the idea, do not forget to support with a like and follow me for next analysis :)
Write your comment and opinion here for me

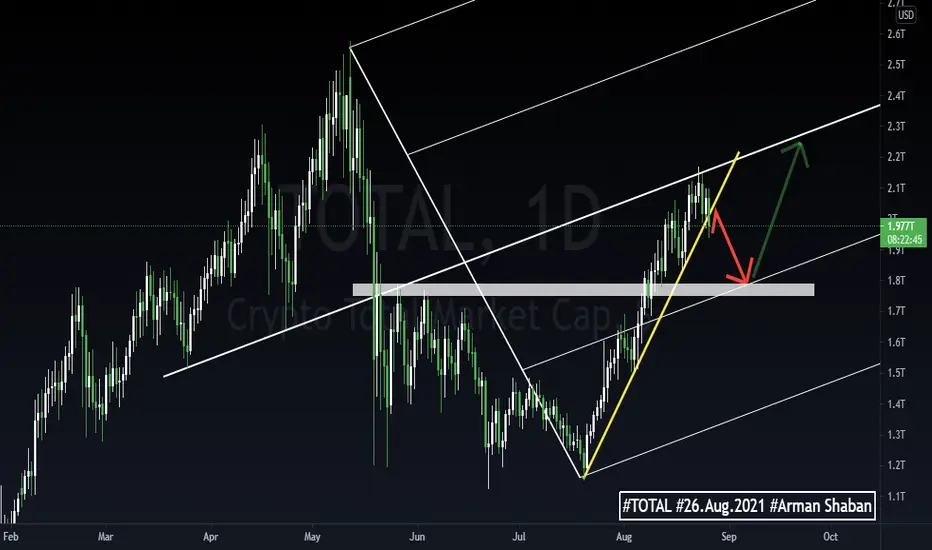
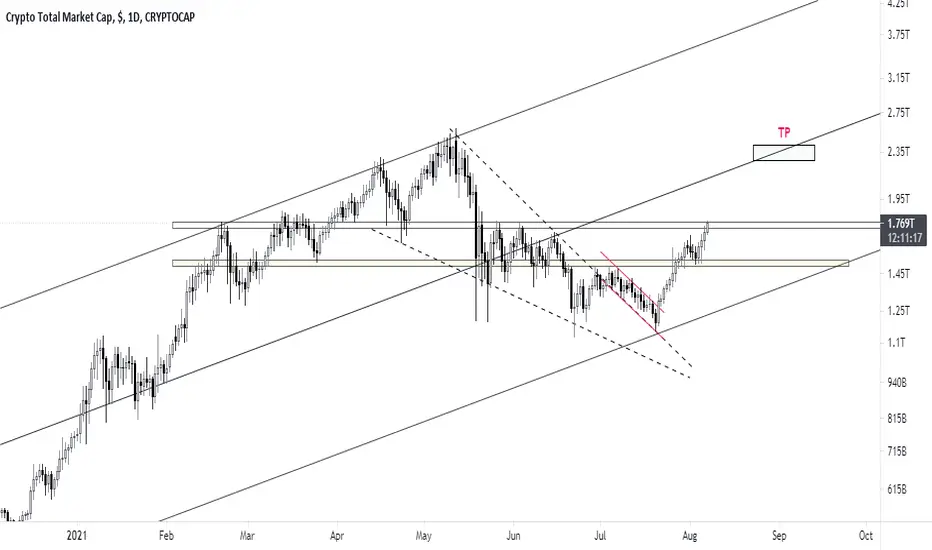
TOTAL - Crypto Total Market Cap - MASSIVE Ascending Channel! - The chart is printing a HUGE ascending channel on the 4h timeframe!
- As we can see, the channel has 6 touches (2top, 4 bottom).
- Next target is top of the channel or 1:1 fib extension.
- Due to my Elliott Wave count, we have next wave in progress.
- For expected duration of the trade, probability, stop loss, profit target, entry price and risk to reward ratio (RRR) - please check my signature below ↓
- If you want to see more of these ideas, hit "Like" & "Follow"!

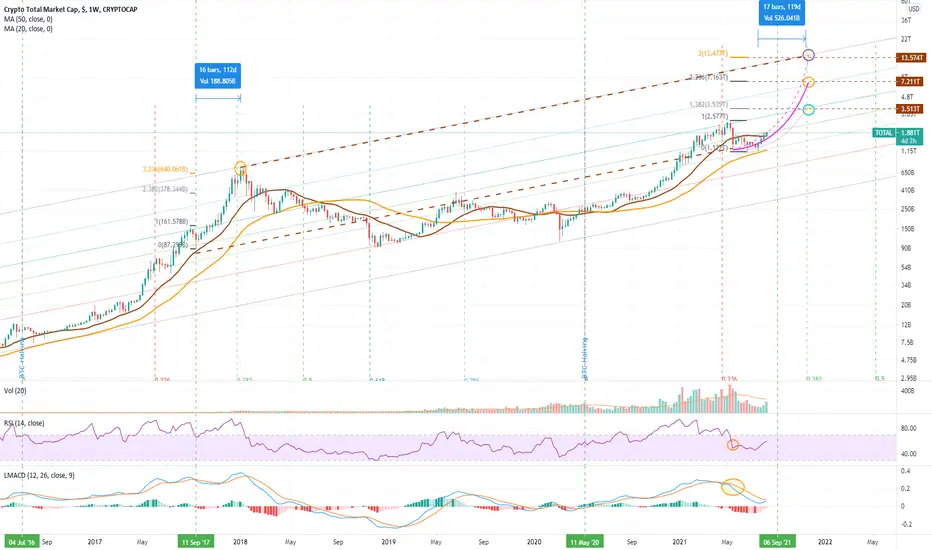
Decision making week ahead..!CRYPTOCAP:TOTAL increased 74% in the past 4 weeks, but still 24%v below its highest level!
In April 2018, the same things happened!
Now the question is what is going to happen in the next 30-33 weeks?
I believe the most probable case is going down, and this analysis will become obsolete only if we see numbers higher than 2.577 trillion dollars!
Do not forget Elon Musk's credibility decreased a lot among crypto fans..!

TOTALMCAP GapsWill the gaps be filled in the future with a massive bubble pop?
Or will they remain unfilled
Time will tell

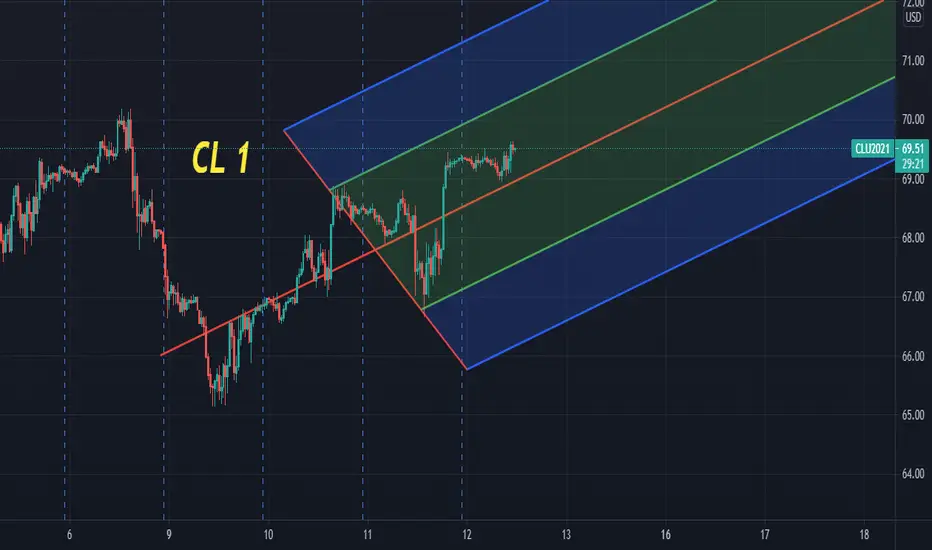
analysis oil crude hello
today i share with you my view about cl , if you have any suggestion you can leave comment here
Total Market Cap – Projection ReviewIt took 7 years of market ups and downs, from 2010 to 2017, for the crypto complex to reach a total Market Capitalisation of $761B. However, a similar amount ($741B) has been added in the past 3.5 weeks. Think about that a little, as much new capital has been added to the crypto markets in 4 weeks as existed in the market at the 2017 peak!
So time for a review of my previous study to recalibrate for the extended correction and the market cycle.
The Next 7 DaysI believe in the next 7 days total cryptocurrency market cap will decrease 4-7%..!
reviewing the previous analysis may help you have a better understanding !
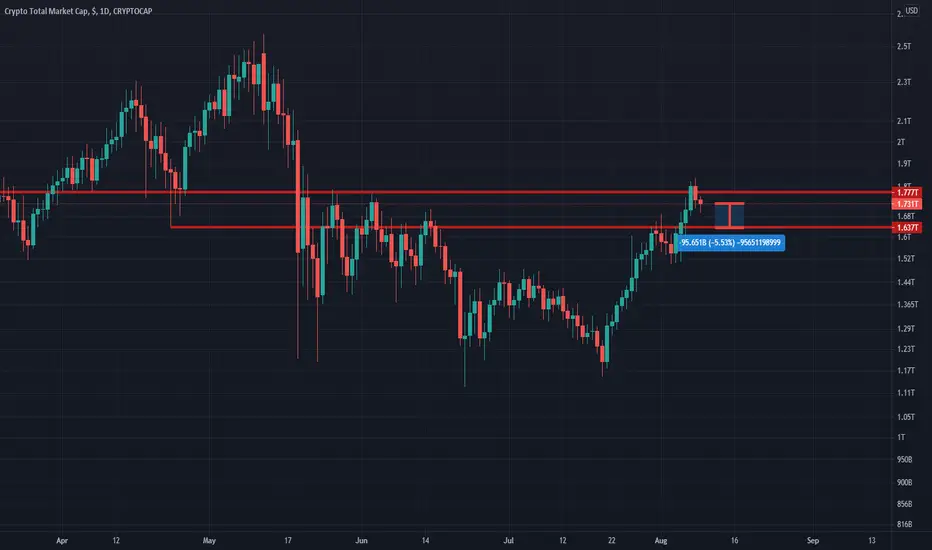
#TOTAL CRYPTO MCAP in Danger Position! Here's Why...Welcome to this quick Sunday update, everyone.
If you are reading my updates for the first time do follow me to get more complex charts in a very simplified way.
I also post altcoin setups on Spot, Margin, and Futures.
Let's get to the chart.
This is the total crypto market cap chart.
It's very important to follow this chart in order to understand the overall trend of the crypto market.
W have seen almost third consecutive bullish candle for BTC in weekly.
IMHO BTC needs some pullback including many other altcoins too.
I've said this before
No one got rekt by taking profits.
Although there's a chance that BTC could hit the 48k straight that won't be sustained for long.
In this chart, the mcap is hitting the most important resistance level.
If this resistance is broken and we get a daily close above the 1.84 trillion resistance (the red zone) It's highly likely we will hit the 48k -49k level on or before 15th Aug 2021 in BTC. The whole market will pump together.
The support remains from 1.53 to 1.67 trillion.
What's your thought on this?
Do hit the like button if you like this Analysis and share your views in the comment section.
It takes a lot of time and attention to create this educational content for you all to understand the market and take your trades wisely with the right information! Hit that follow button if you haven't yet.
Thank you
#PEACE

TOTAL2 Where we get super richThe covid run and post covid run completed
The formation that has been described as a 'bear market' is finally breaking out to the upside
I can't wait to see where this heads
This is the alt coin market
June 2022!

TOTALI can't understand alt movements and i am ready to be taken out on btc
New top ( or double top?) Shaped outside of both channels, of course my channels but generally i don't like to open long till some days later,
I can't find any logic behind these moves so i don't try to have an inversed plan
is this bullish or bearish?
I don't like to know
My ideas can lead you to nowhere
