Crypto $TOTAL Market Cap Sell The News Event IncomingSOUR GRAPES
Markets barely budge after the Fed cuts a massive 50 bps.
This is due to uncertainty with participants feeling there is something “broken” in the system.
However, long-term this is BULLISH.
The Crypto CRYPTOCAP:TOTAL Market Cap could see another small pump leading into the weekend to test its downtrend line, but I expect next week for the markets to “sell the news” pretty hard.
Should retest the lower order block ~$1.77T next.
Total

TOTAL (crypto market cap) is low key doing some sneaky moves...TOTAL (crypto market cap) is low key crawling up -- and barely no one will notice this.
It has finally poke the downtrend line after 5 days of heavy correction. It's still a small increase about ($100M added to TOTAL) but enough to take a closer look.
It may give us a hint on what's coming for next week -- and for the whole month of May.
Spotted at 1.084T
Things will be interesting again, if you know what I mean. :)
TAYOR.
Safeguard capital, always.

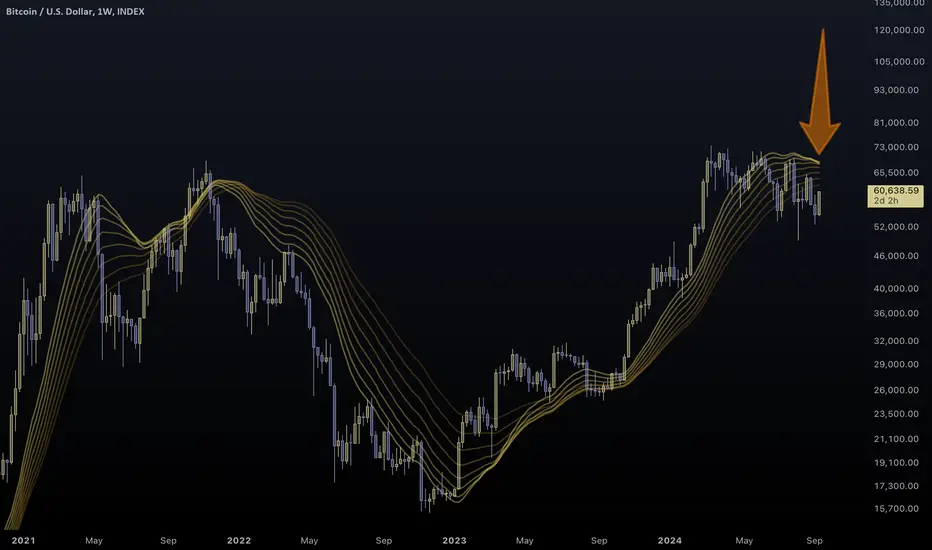
BTCUSD | ViolationClassic price-based ribbons are commonly used.
Their inversion signifies a bear market, while their normalization a bull one.
They are unfortunately very laggy.
In markets, it is trends that change first and then prices.
Therefore, a trend-based ribbon can prove a highly responsive and clear way to visualize market cycles. This trend-based ribbon can be used as a price centerline and as an indicator of market trends.
With this trend-based ribbon, the famous 1970s stagflation and the 2000s stagnation is clearly discernible.
Applying this indicator to Bitcoin, we realize the following.
We are entering a period o stagnation for Bitcoin. Its trend-ribbon has began inverting.
This has happened in 2015 and 2022.
Also notice the broader Crypto problems.
P.S. PineCoders have banned dozens of my indicators for violating "House Rules" I don't know which rule in specific, because many of them were open-source. Some of you may have briefly seen some of them before their demise.
The protagonist indicator of this idea, called Trend-Based Ribbon, got banned yesterday.
This idea is posted after following some useful guidance from PineCoders. In this fashion, I can analyze a chart and talk about it with you, while at the same time showing you the reaction of my indicators. I thank them for the workaround.
Feel free to ask for a private copy by commenting below. I will get to you ASAP.
Individual, you are convicted of multi-anti-civil violations . Implicit citizenship revoked, status: malignant
P.S. Again...
I got sick of having all of my work banned. I have been developing these indicators for hundreds of hours, only to see them locked for no explanation.
(They can't ban an idea now, can they?)
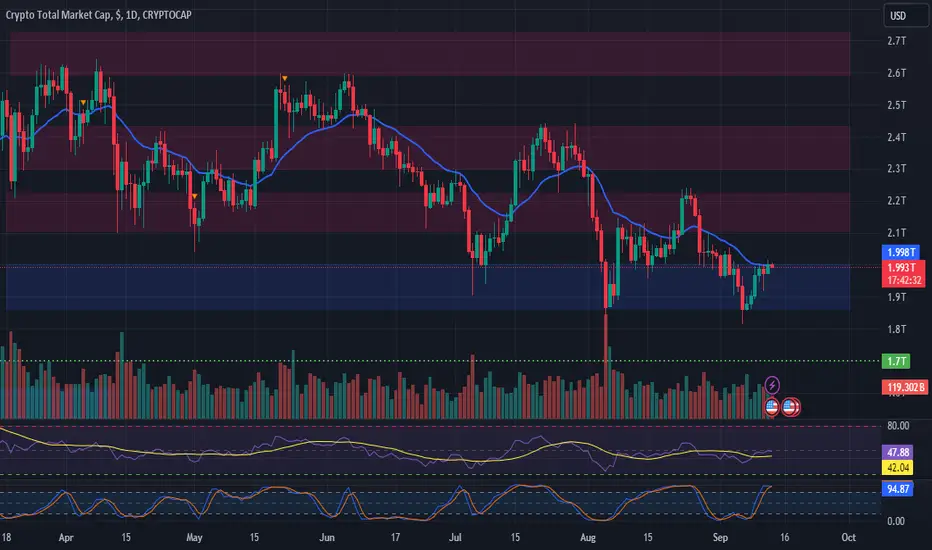
TOTAL Market Cap Faces Rejection at $2TCurrent Market Activity: This morning, the TOTAL market cap was rejected at the $2T level, the top of the range, and has begun retracing, potentially testing the bottom of the range at $1.85T once again.
Key Levels:
Top of Range: $2T (Rejected)
Bottom of Range: $1.85T (Potential test)
Previous High: $2.25T (Late August)
Bearish Signals: TOTAL has not created a higher high since reaching $2.25T, suggesting that the higher timeframe trend remains to the downside. A break below $1.85T could lead to a retest of the $1.7T level, which was last tested in early August.
Market Outlook: Watch for a decisive move at $1.85T for clues on the next direction.
#CryptoMarketCap #TOTAL #MarketAnalysis #SupportAndResistance #Downtrend #Bearish #Crypto #PriceAction #TechnicalAnalysis
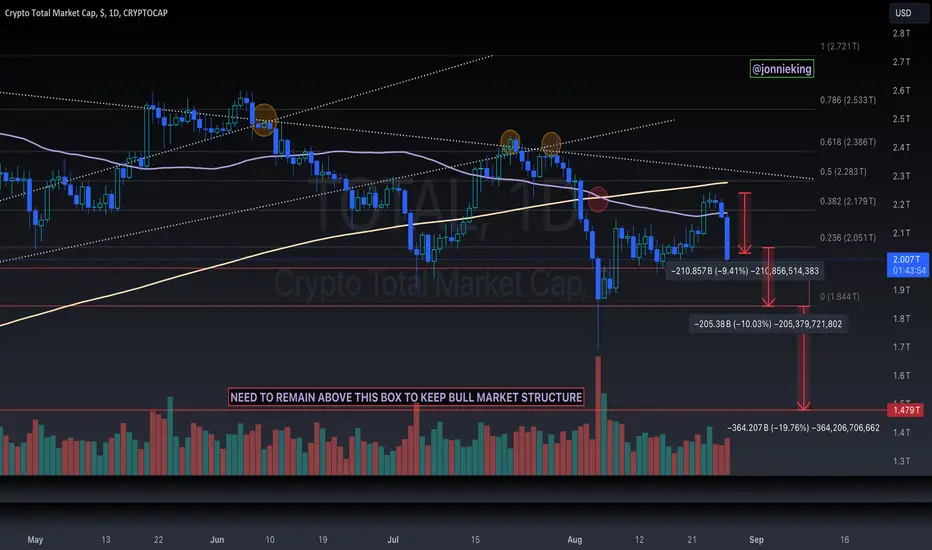
$TOTAL Crypto Market Cap Moment of TruthMoment of Truth incoming for Crypto CRYPTOCAP:TOTAL Market Cap.
If we get a daily close below 1.845T then I expect a drastic 20% market sell-off to our next level of support at 1.479T.
Prepare accordingly folks 👀

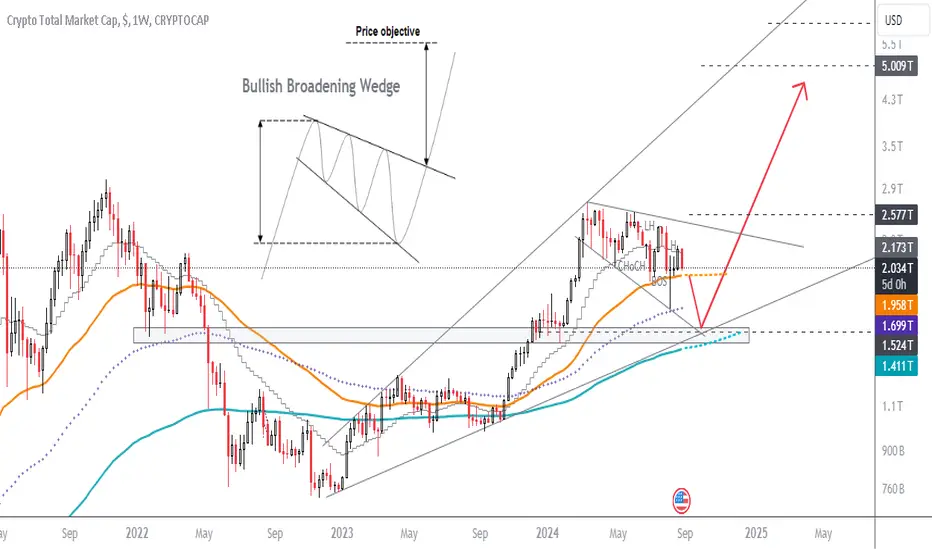
Crypto TOTAL Market cap on the verge of a correctionThe crypto market just had a decent recovery from its latest crash on Black Monday. Now, it seems we can expect another low based on the market structure and technical analysis.
Historically, September has often been a red month for markets. What I expect is a quick flash in the market before it goes up to make new highs, starting the main bull market we've all been waiting for.
This correction to $1.5T will provide the liquidity and fuel for strong bullish momentum toward the main target of $6-7T in the TOTAL Crypto Market Cap IMO. DYOR
$TOTAL Trump Pump Gets Wiped Out By New Indictment The Trump Pump gets wiped out by the Democrats' relentless legal pursuit to take him out of the race with today's new indictment against him.
If Crypto CRYPTOCAP:TOTAL Market Cap does not hold the .236 fib, we will revisit the 1.8T range. That would be another 10% down from here.
Next critical support would be 1.479T, which would be a 20% sell-off.
I very well see this being a possibility to have one last real shake-out before rate cuts September 18th.
BTC Expected LowsThis is an addition to the previous post. In which reasoning for the expected drop is outlined. Here, I've visualised the expected levels based on Wave C's anticipated move, scaled for BTCUSD.
25k here we come.
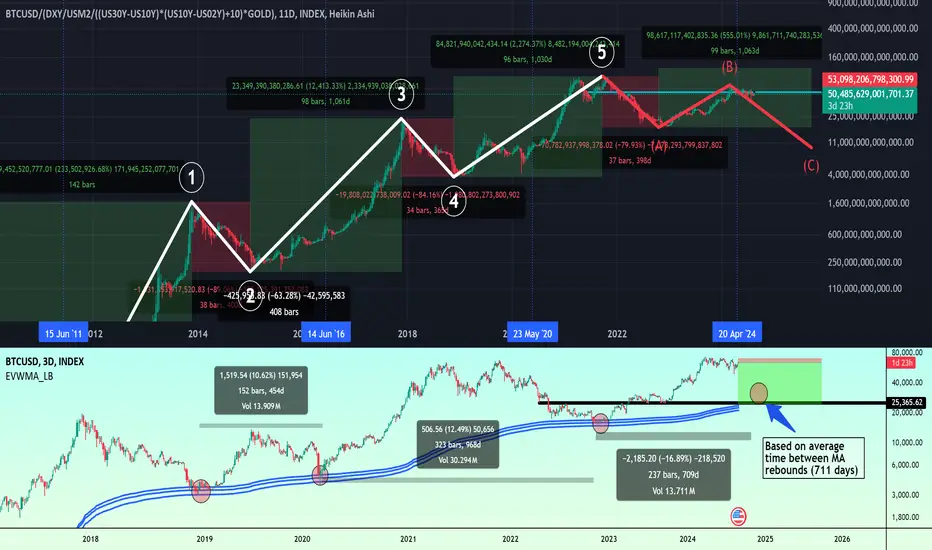
Stocks and BTCBTC is analysed from price 0, 12 Jan 2009. Aggregate of stock markets (IWM, SPX and IXIC) are analysed from 2009's crash. Both asset classes are normalised to gold.
Using the Elliot Wave Theory on the long-run movement of BTC and Equities the following has been determined:
1. BTC has converged to the stock market's movements
2. Equities and Cryptos have passed the Wave 5, currently finishing the Wave B corrective movement.

Crypto Total Market Cap ~ 14 months of bull run remaining?Crypto - CRYPTOCAP:TOTAL Market Cap
Another month has passed since I shared this chart. We are now past the half way point for this bull run. Over the next 3 months, this is typically were the market starts to reach escape velocity.
✅ Month 15 of 29 month bull run (past halfway now)
✅ Month 15 of prior cycles (green boxes) were
followed by major upward price movements.
✅ An ascending triangle or compression of the market cap can be seen via a series of higher lows held up by a diagonal support line, market cap is also contained by the overhead all time highs.
⚠️What's interesting is the TOTAL market cap has not made an all time high yet 👀
⏳The 10 month moving average is at $2.06T, we are presently under it at $2.04T however there are 16 days left in August before we have a candle close. Something to watch. It not definitive, but if we could hold above the 10 month it would be very encouraging. The 10 month moving average is still sloping up the way too which is telling.
⏳ Given the unavoidable recession concerns, I have included a Black Swan Line. I do not see this as the most likely outcome however its worth having a back the truck up line in the event of mass panic. This would be a great level for long term hodlers to enter, and could always use a level under the line as a stop for CRYPTOCAP:BTC price.
Summary
I remain bullish mainly due to where we are in the bull market cycle as per the chart timing above. We are fighting the 10 month moving average and it remains upward sloping. We have an ascending triangle of sorts forming and an underside diagonal support line we can watch as an increased risk level (if lost). The monthly candle presently looks like a hammer reversal candle. Patience is the name of the game here for long term hodlers.
Typically Aug/Sept are thee worst months for CRYPTOCAP:BTC price performance, so we should expect consolidation, sideways and a possible churn slightly lower before the market continues its ascent towards the end of Sept, start of Oct 2024. Looking ahead, the Christmas season often brings renewed excitement to the market. That all starts with the "Halloween effect" in October. All will be revealed with 60 days. Stay busy folks 🙌
PUKA

TOTAL - An Overview on the crypto marketcap#TOTAL #Analysis
Description
---------------------------------------------------------------
+ After a clear bounce from the support, another drop is occurring, which is normal.
+ We also have a strong support line that is providing significant support.
+ As long as the market cap remains above the horizontal and trendline support, there is hope for an upcoming bullish market.
+ A breakdown from this support zone could lead to further declines in the market.
---------------------------------------------------------------
Enhance, Trade, Grow
---------------------------------------------------------------
Feel free to share your thoughts and insights.
Don't forget to like and follow us for more trading ideas and discussions.
Best Regards,
VectorAlgo

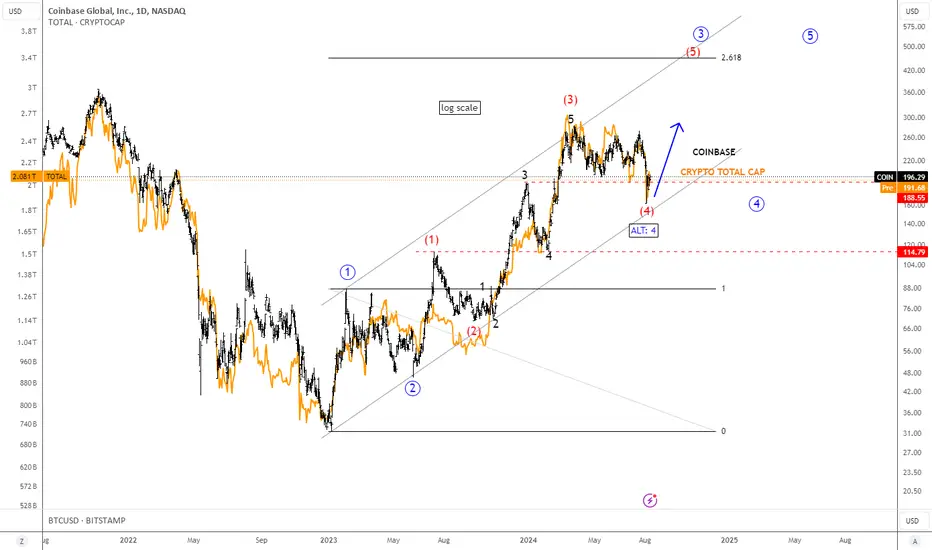
Coinbase Remains In The Bullish Trend, So As Crypto MarketCoinbase is making strong and impulsive rally away from the lows, which should be completed by a five-wave bullish cycle from Elliott wave perspective.
We have seen some slow down for the last couple of months, but it looks like a clean wave 4 correction that can send the price higher into a 5th wave later this year.
Considering a positive correlation with the cryptocurrencies, it can also help Crypto market to stay in the bullish trend.
Biggest Day in the Crypto Market the Entire Bull Run!Absolute FACE MELTING day in the market today.
The biggest inflow of capital in the entire Bull Run!
CRYPTOCAP:TOTAL market cap pumped 13.75%
Bulls have reclaimed the .236 Fib
I expect a bit of a sell-off here, but if we can hold this level, we very well could have seen the bottom.

TOTAL3 - Bulls taking a napTOTAL3 began forming a descending parallel channel (Bull Flag) on March 31 and has been trading within it.
We recently had the third touch at the top of the channel, but it failed to break, showing signs of exhaustion indicating a greater probability of decline in the short term.
I will continue to monitor, but I only believe in all-time highs for altcoins when this channel is broken, but I wouldn't be surprised if we visit 450-480B before that happens.

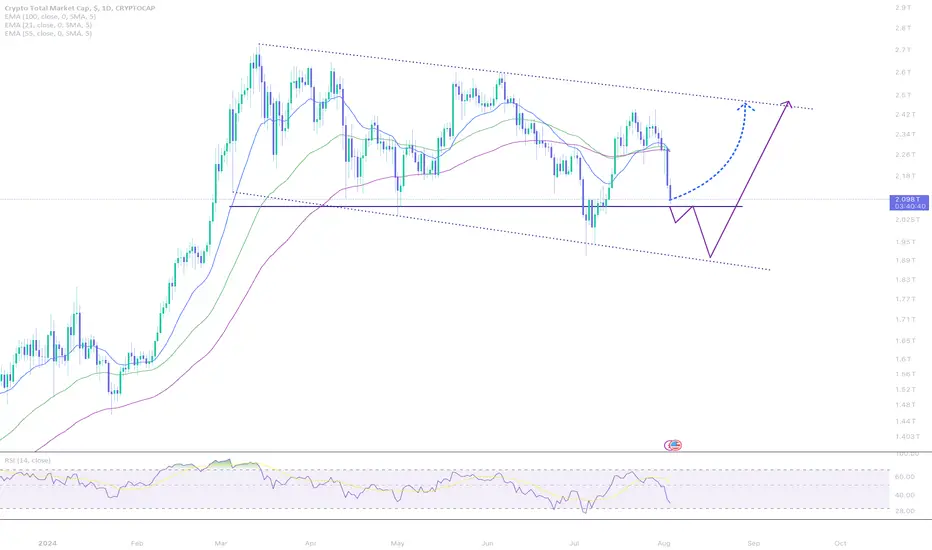
Crypto Total Market Cap: Approaching Key Support - Will It Hold?#ETH/USDT #Analysis
Description
---------------------------------------------------------------
+ The chart shows the total crypto market cap trading within a descending channel, suggesting a bearish trend in the broader market. The marketcap has recently dropped sharply, approaching the lower boundary of the channel, which aligns with a key horizontal support level around $2.09T.
+ The 21-Day EMA ($2.227T) and 55-Day EMA ($2.279T) are sloping downward, indicating bearish momentum. The marketcap is currently trading below these EMAs, reinforcing the overall bearish sentiment.
+ The critical support level at $2.09T is being tested. If this level holds, it could serve as a base for a potential bounce back towards the upper channel line and the EMAs. However, a break below this support could lead to further declines, potentially towards the psychological level of $2.00T or lower.
+ The RSI is currently in bearish territory, around 33, indicating that the market is oversold but could still move lower.
+ If the total market cap holds above the $2.09T support level and breaks back above the 21 EMA, we could see a short-term relief rally. Key resistance levels to watch are the 21 EMA ($2.227T) and the upper boundary of the descending channel.
Bullish Scenario:
If the total market cap holds above the $2.09T support level and breaks back above the 21 EMA, we could see a short-term relief rally. Key resistance levels to watch are the 21 EMA ($2.227T) and the upper boundary of the descending channel.
Bearish Scenario:
A break below the $2.09T support level could trigger further selling pressure, with the next key support levels around $2.00T and the lower boundary of the descending channel. This would confirm the continuation of the bearish trend.
---------------------------------------------------------------
Enhance, Trade, Grow
---------------------------------------------------------------
Feel free to share your thoughts and insights.
Don't forget to like and follow us for more trading ideas and discussions.
Best Regards,
VectorAlgo
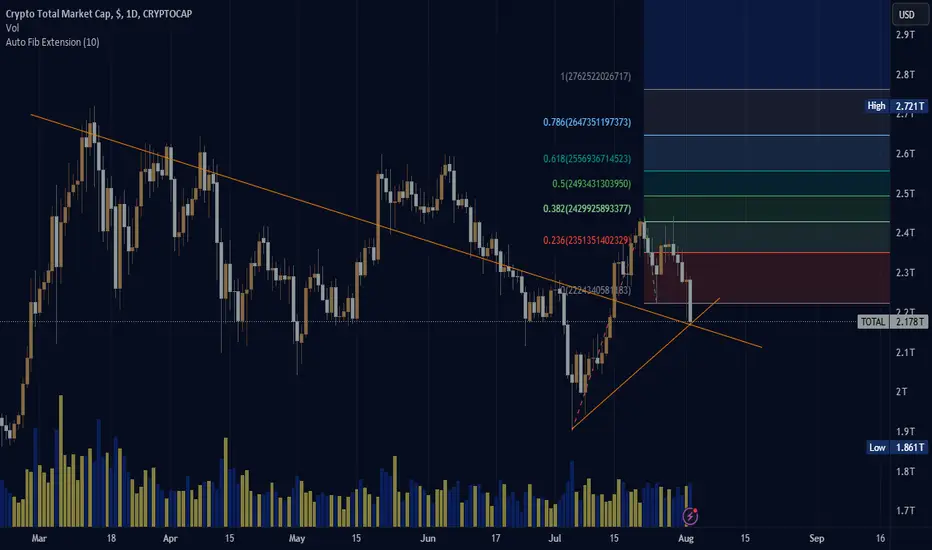
TOTAL CRYPTO TICKERThe auto fib retracement and auto fib extension show both indications cryptocurrency ripe to for taking in addition to a complete bottoming out of the price as a whole. Distracted by something, or too busy soaking up the second month of summer? Long orange line represents the time period when the drop happened and the price of cryptocurrency going beyond the 100 day without improving therefore falling. Looks like an opportunistic moment where the fibonacci levels appear as though cryptocurrency is flailing around underneath the resevoir of time and money.
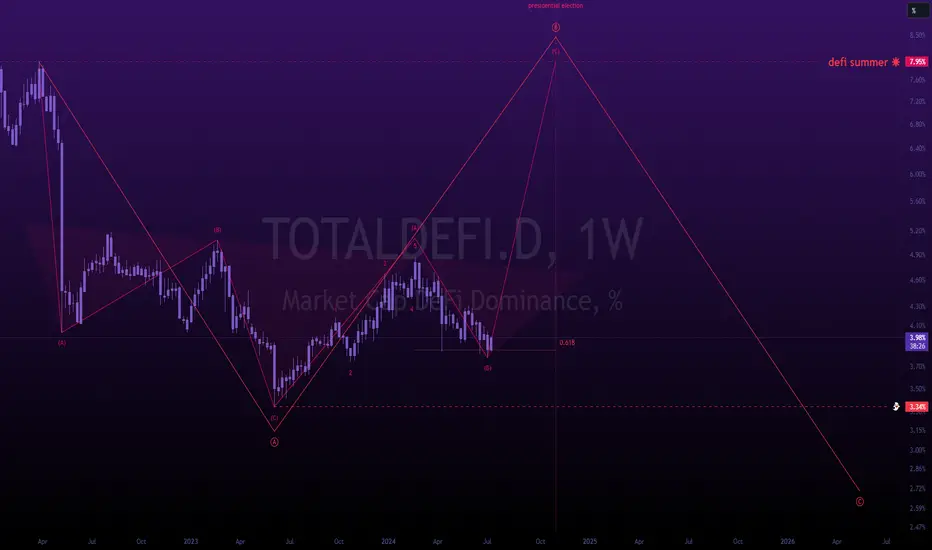
defi summerthis chart portrays the total market cap of the defi dominance.
it's currently sitting at 3.98% with an inverse h&s on a weekly timeframe.
my projected upside target sits at the ath of about 7.95%
---
the last meaningful defi summer we experienced was in 2020.
☀
let's make this one count.
---
i'm projecting this defi market cap dominance to hit 8% into the presidential election where a soft top will likely be created.
i've shared a lot of plays over the last few months with our members, and we're just chilling into november.
---
tldr; hodl into a 3-4 month long alt season, and tp into the presidential election.
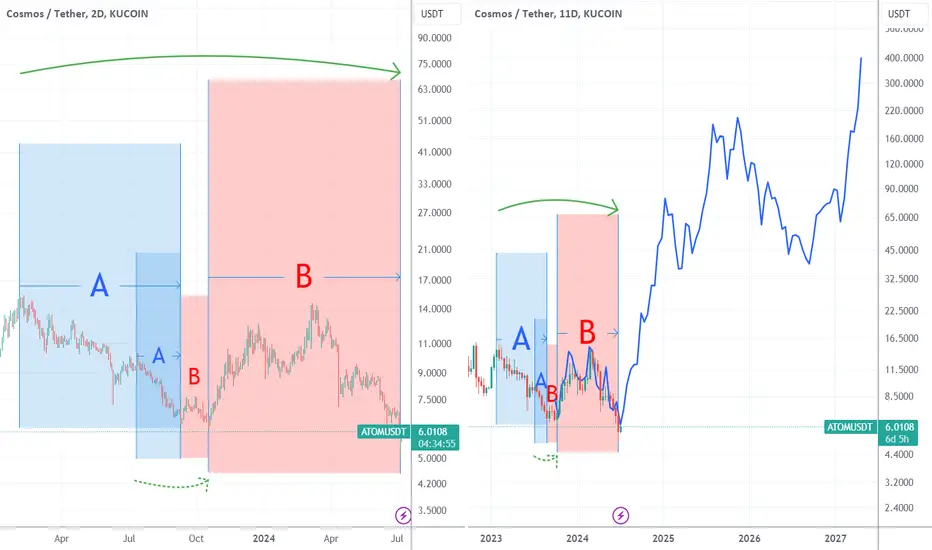
Future forecast with fractal pattern detectionTake this as a representation of entire market structure
On the first pannel, you can see 4 boxes
The bigger ones A+B (green continuous period) are a perfect representation of the smaller ones A+B (green dotted period)
They are fractaly similar
So, we will take the small pattern period to reveal what will happen with the bigger period
And that is what we see on the 2nd pannel: the blue line on the 2nd chart is the exact pattern of the small period, but plotted over its bigger counterpart
Hold tight, because it will be a great ride!
BTC (fundamental + technical + macroeconomics)Dont lose this video !
i analyse the market in terms of :
1-fundamental
2-technical
3-macroeconomics
NFA

Why BTC is bullish yet !!Im bullish on btc cause of 3 reasons in terms of fundamental vision :
1- fear of MT.gox repayment is over the truth (FUD)
becoase :
a) reapments will be gradual
b) BTCs will be repay by several CEXs (pervent from drop)
c) creditors wont sell btc at once cause of tax
2- capitulation of miners were done! : according to onchain data
3- selling by Germany GOV is related to order of the court , not for Getting profit .
dont sell your crypto !

BTC Futures. Bulls fade. Robust gain de-established.BTC has reached the top around US$ 73700 on March 14, 2024 as it was clearly explained in previous publication.
Since that it's gone around 1 month till now, and no one new high was printed in BTC.
Bulls fade. Robust gain de-established. Upside bubble-alike trend transformed into detrend structure with flat top near US$ 73000 per BTC.
RSI (14) is sluggish also.
This idea is for b-adj CME’s Bitcoin futures contracts, ticker symbol BTC, which are a USD cash-settled contracts based on the CME CF Bitcoin Reference Rate (BRR), which serves as a once-a-day reference rate of the U.S. dollar price of bitcoin.
The BRR aggregates the trade flow of major bitcoin spot exchanges during a one-hour calculation window into the U.S. dollar price of one bitcoin as of 4 p.m. London Time.
The Bitcoin futures contract trades Sunday through Friday, from 5 p.m. to 4 p.m. Central Time (CT).
A single BTC contract has a value of five times the value of the BRR Index and is quoted in U.S. dollars per one bitcoin. The tick increments are quoted in multiples of $5 per bitcoin, meaning a one-tick move of the BTC future is equal to $25.
BTC futures expire the last Friday of the month, and are listed on the nearest six consecutive monthly contracts, inclusive of the nearest two December contracts.
Technical graph indicates on a detrend structure, where near 73K per BTC is the Top, and near 55K is the target.
Technically, BTC can retrace to mentioned above level as it still below reasonable resistance.

TOTAL2 - Bull IdeaExpecting a bullish bounce off this green trend line and a breaking of the temporary downward channel or whatever that structure is.
TOTAL2 has been at 1T for awhile now and forming this as a strong support.
Lets see if it can extend above 1T !
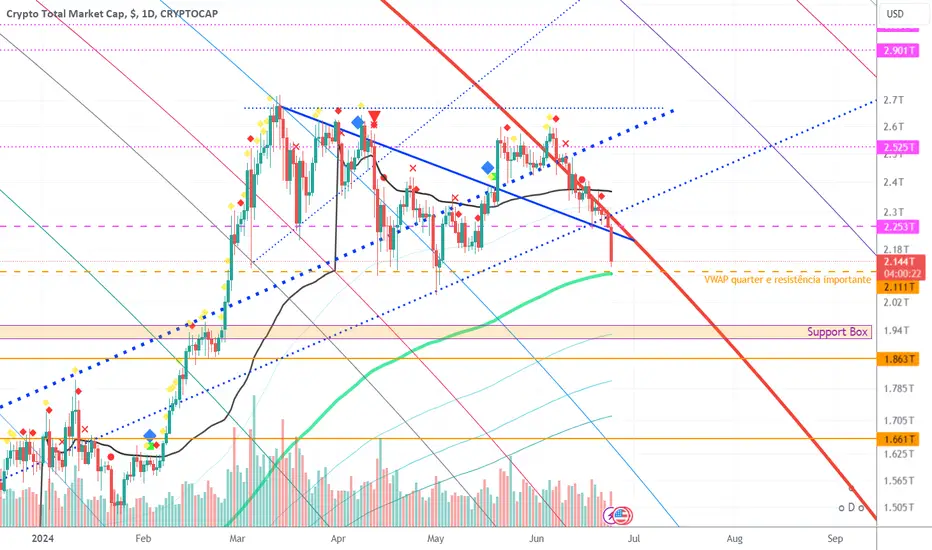
$TOTAL is flerting with important Fibonacci Circle resistenceAfter a fake breakout from important Fibonacci Circle resistence and a fake breakout from the downward blue continuous line, CRYPTOCAP:TOTAL is trying to find now support over the daily 200 EMA (green line) that coincides exactaly over an important VWAP reset line
If prices continue to fall, a very important support will be over the market "Support Box"
Once the price breakout from the red Fib Circle, market will continue its move upward