TradeCityPro | Bitcoin Daily Analysis #82👋 Welcome to TradeCity Pro!
Let’s dive into the analysis of Bitcoin and key crypto indicators. As usual, I’ll walk you through the futures triggers for the New York session.
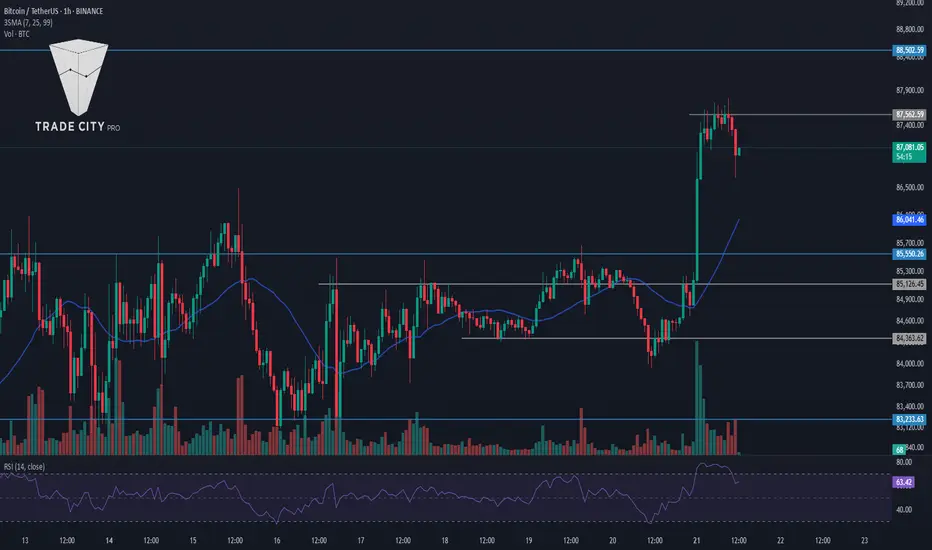
⏳ 1-Hour Timeframe
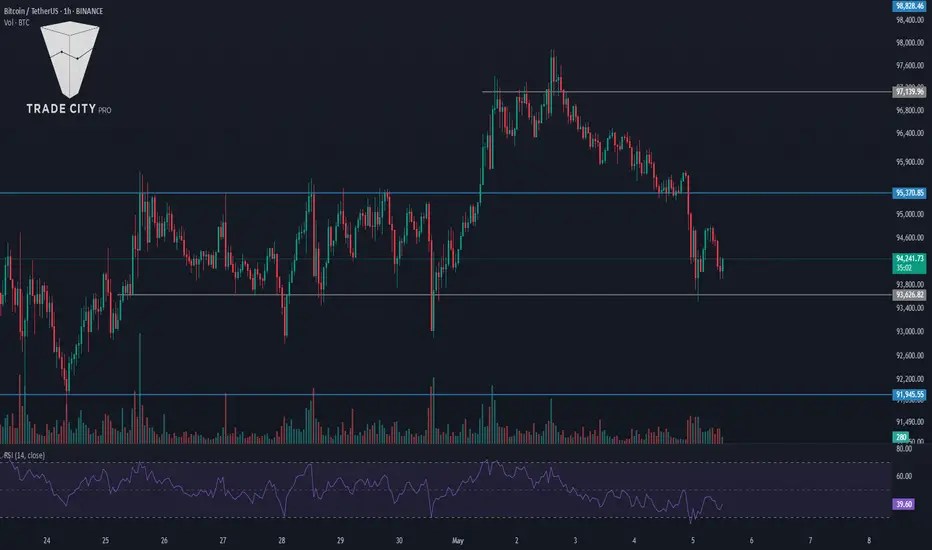
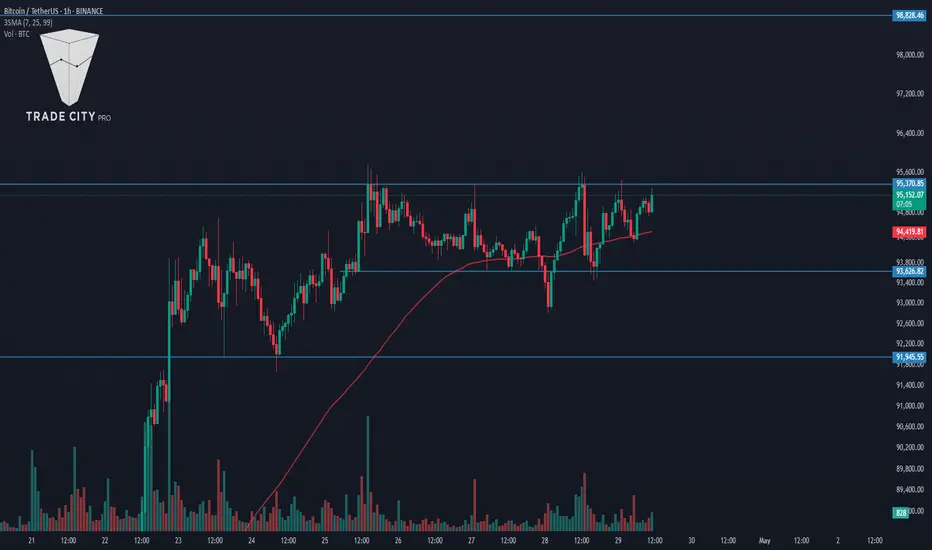
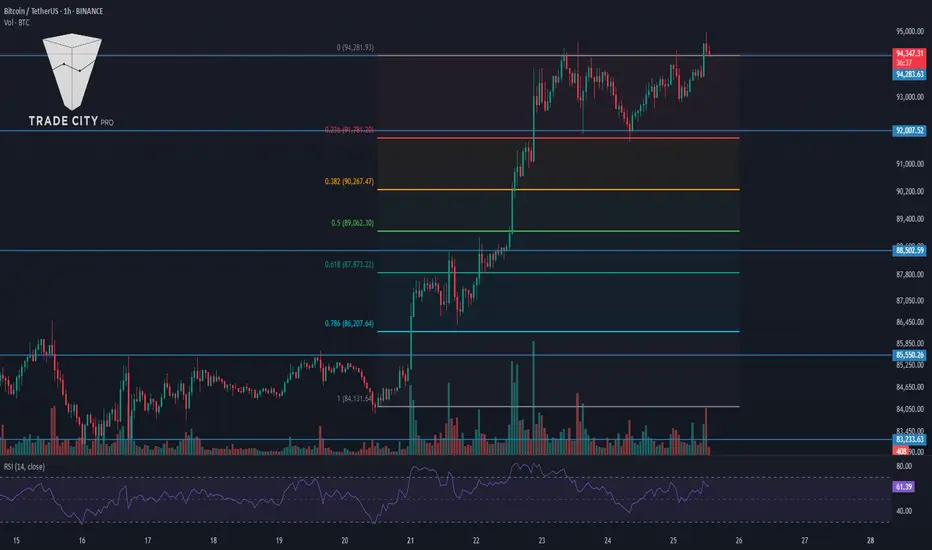
As you can see, yesterday the price stabilized below 95370 and completed a downward leg to 93626, reacting exactly to the level I pointed out in the previous analysis.
✔️ I mentioned earlier that you could enter a short position after breaking 95370 — but remember, this position is against the higher timeframe trend, so the downward move will likely end once it hits the first support, since the market momentum remains bullish on larger timeframes.
💥 Currently, the price has reacted to 93626 and seems to be resting from the previous downward move. I believe a new range box may form between 95370 and 93626 — if that happens, I’ll go long on a break above 95370.
🔽 For short positions, given the bearish momentum in this timeframe, we can look to re-enter on a break below 93626 in the next retest.
📊 Watch volume and RSI today. The volume of red candles has been much higher than bullish ones, which increases the chance of a deeper correction. If you’re shorting, keep a tight stop-loss, take profits quickly, and treat it as a scalp trade.
📈 For long positions, since it’s against the short-term trend, you’ll need a wider stop — but if the correction ends and a new bullish leg begins, the trade may stay open longer.
🧩 As for RSI: as long as it stays below 50, market momentum is bearish. A break below 30 and entry into oversold increases the likelihood of more downside.
👑 BTC.D Analysis
Bitcoin dominance broke 64.77 yesterday and retraced to 64.60. If this downward move continues, we could see early signs of a trend shift.
✨ Important note: dominance has been in an uptrend on higher timeframes, so a break of 64.60 only confirms a short-term correction. Don’t take it as a trend reversal just yet.
💫 If dominance continues to drop and the market rises, altcoins could outperform Bitcoin. Conversely, if dominance rises again, Bitcoin will rally more than altcoins.
📅 Total2 Analysis
Total2 broke below 1.03 yesterday, retested it, and now looks set to continue downward. The next support is at 1.00 — if you’re already short, consider taking profits at that level.
☘️ We’ll get full trend reversal confirmation with a break below 1.00. For long positions, the 1.05 breakout is extremely important. I strongly recommend not missing that trigger if it happens.
📅 USDT.D Analysis
USDT dominance stabilized above 5.10 yesterday, moving further away from 4.99, and is now testing 5.19. A break above 5.19 would be a strong signal that a deeper market correction is starting.
🔑 On the flip side, a break below 4.99 is still the best and most important trigger to confirm the market’s return to a bullish trend.
❌ Disclaimer ❌
Trading futures is highly risky and dangerous. If you're not an expert, these triggers may not be suitable for you. You should first learn risk and capital management. You can also use the educational content from this channel.
Finally, these triggers reflect my personal opinions on price action, and the market may move completely against this analysis. So, do your own research before opening any position.
TOTAL2
TradeCityPro | Bitcoin Daily Analysis #81👋 Welcome to TradeCity Pro!
Let’s get into the analysis of Bitcoin and the key crypto indices. As usual, I’ll review the futures triggers for the New York session.
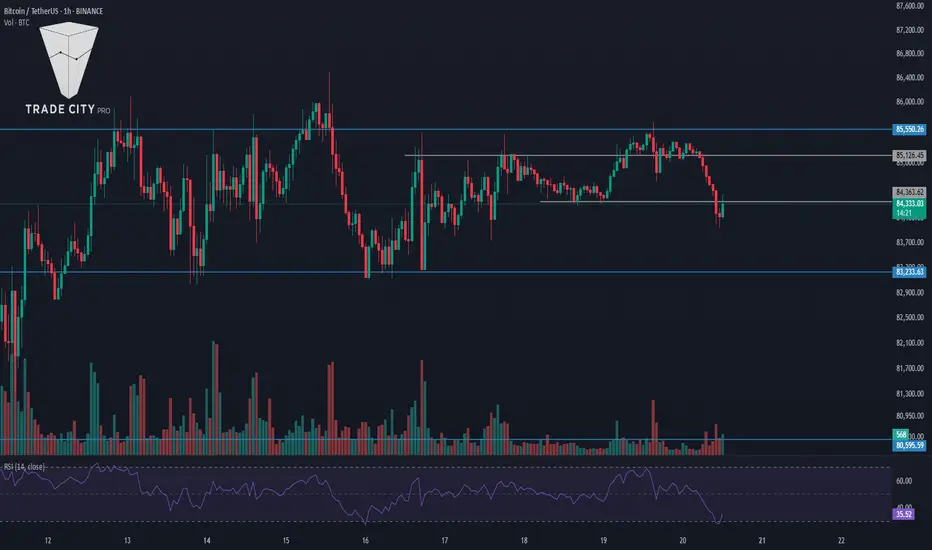
⏳ 1-Hour Timeframe
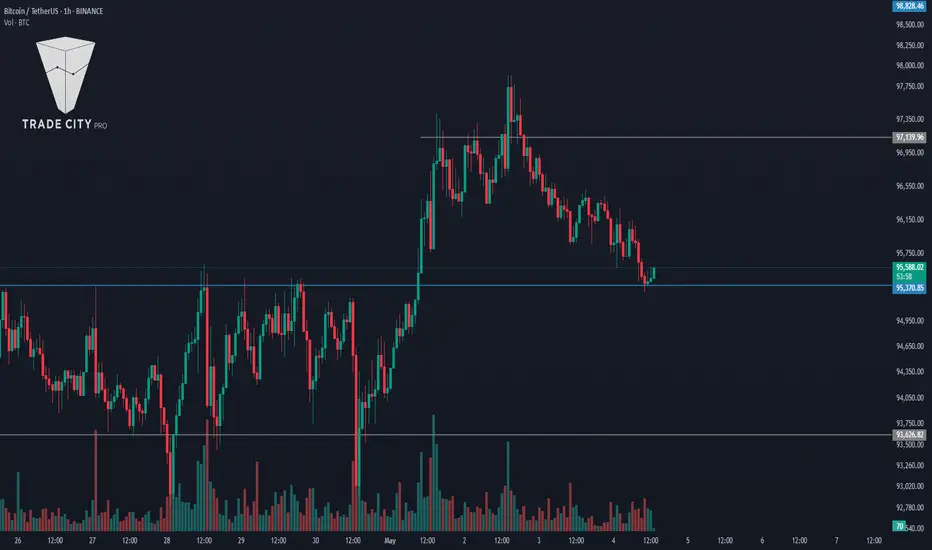
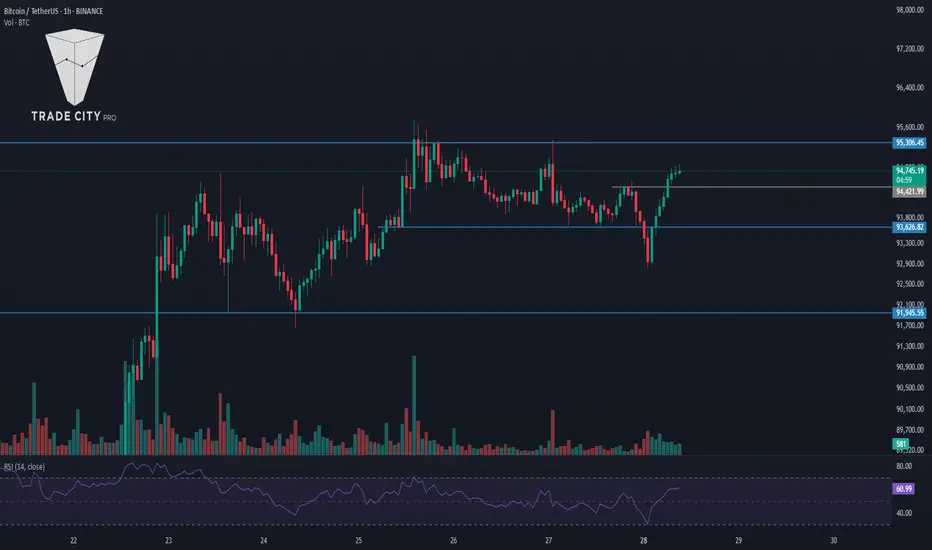
As you can see, Bitcoin has continued its correction down to the 95370 level and is currently testing this zone.
✔️ If the price breaks below this level and moves further down, we will start to see signs of a trend reversal. However, for short positions, I personally prefer to wait for a confirmed trend reversal.
📈 For long positions today, if the price pulls back to the 95370 zone, you can consider entering. Confirmation of the pullback can be taken from lower timeframes through candlestick signals or structural breaks.
📊 Market volume increased during the last corrective leg, which could raise the probability of a break below 95370.
👑 BTC.D Analysis
Moving on to Bitcoin dominance — the range between 64.77 and 64.91 still holds, with price fluctuating within.
⚡️ A breakout above 64.91 would confirm the continuation of the uptrend. A break below 64.77 could suggest a deeper correction.
📅 Total2 Analysis
Looking at Total2, the 1.03 support has broken and price is now moving downward. If this trend continues, it could drop to lower support levels.
⭐ However, if the break below 1.03 turns out to be a fakeout, price could rebound and head back toward 1.05.
📅 USDT.D Analysis
Finally, USDT dominance has closed above 5.10 today and may be starting its bullish leg.
💥 If this upward move continues, the market could experience a broader sell-off. Should Bitcoin triggers activate, this would be a good context to consider short positions.
❌ Disclaimer ❌
Trading futures is highly risky and dangerous. If you're not an expert, these triggers may not be suitable for you. You should first learn risk and capital management. You can also use the educational content from this channel.
Finally, these triggers reflect my personal opinions on price action, and the market may move completely against this analysis. So, do your own research before opening any position.
TradeCityPro | Bitcoin Daily Analysis #80👋 Welcome to TradeCity Pro!
Let’s dive into the Bitcoin analysis and key crypto market indicators. As usual, I’ll review the triggers for the New York futures session.
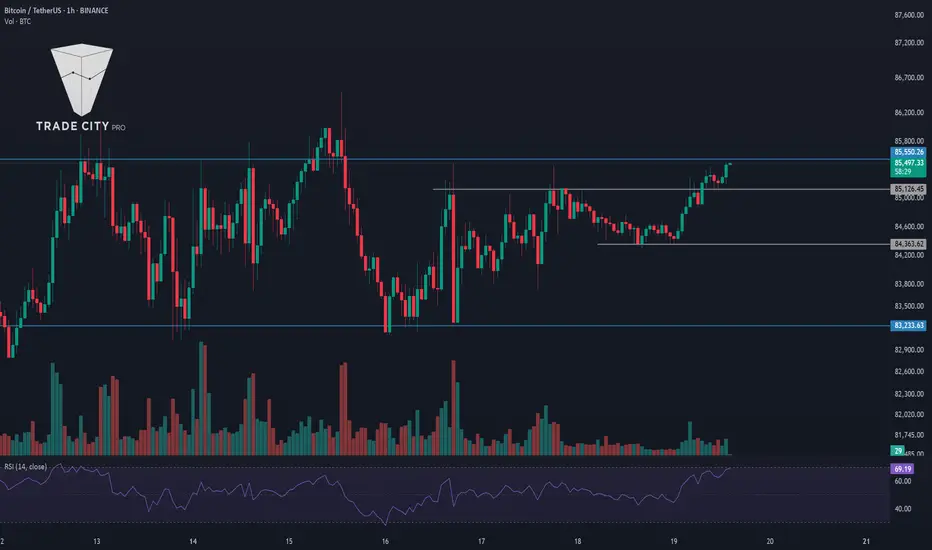
⏳ 1-Hour Timeframe
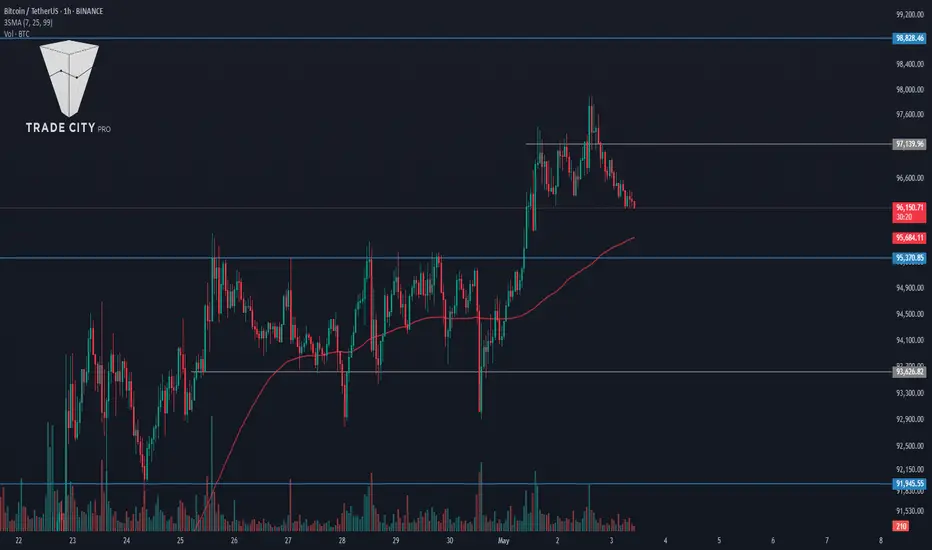
Yesterday, price made a bullish move and broke the 97139 zone, but later it turned out to be a fake breakout, and now it’s moving downward.
🔍 It’s likely that this downward move is just a pullback toward the SMA99 zone, and price may bounce back up afterward. If SMA99 breaks, deeper corrections down to 95370 are possible.
✔️ In my view, as long as price stays above the 95370 zone, Bitcoin remains in an uptrend. Only once price drops below this level can we start identifying potential bearish triggers.
📈 For now, we need to wait for more structure to develop before entering any positions. The 97139 level still remains a strong bullish trigger, but it’s best to wait for a reaction to it first so we can pinpoint the exact line, and then enter upon its breakout.
⚡️ Nothing more to add about Bitcoin for now — it’s Saturday, a weekend, and the chances of ranging price action are high.
👑 BTC.D Analysis
Looking at BTC dominance, yesterday it made a slight corrective move and pulled back to 64.77, where it seems to have found support.
📊 The next bullish trigger is the breakout of 64.91. Overall, the trend is still bullish, so if you're considering multi-day or swing positions, Bitcoin remains a better choice than altcoins.
📅 Total2 Analysis
Turning to the Total2 chart, this index was rejected from the 1.05 resistance once again yesterday and failed to hold above it. Until that changes, altcoins likely won’t see any significant upward momentum.
🔑 For downside movement in Total2, the trigger remains a break below 1.03.
📅 USDT.D Analysis
Now to Tether dominance — yesterday, this index finally closed a candle below the 4.99 level, but it was a fakeout, and it moved back above, once again preventing the broader market from turning bullish. This fakeout could inject bearish momentum into the market, potentially leading to deeper corrections.
⭐ For now, the 4.99 level still serves as a strong trigger for a bearish USDT dominance and thus a bullish signal for the market. A break above 5.10, however, would be a solid trigger for USDT dominance to trend higher.
❌ Disclaimer ❌
Trading futures is highly risky and dangerous. If you're not an expert, these triggers may not be suitable for you. You should first learn risk and capital management. You can also use the educational content from this channel.
Finally, these triggers reflect my personal opinions on price action, and the market may move completely against this analysis. So, do your own research before opening any position.
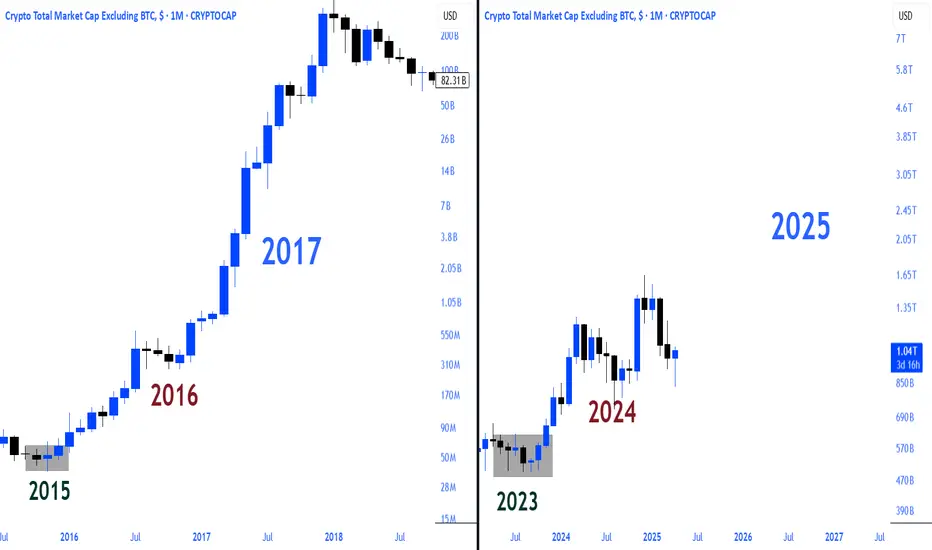
Could The Alt Market Go This HighCould TOTAL2 (the alt market) reach this high? 7T !
Might take some while to get there but it aligns with previous tops on the log chart
lets see
Weekly timeframe

TradeCityPro | Bitcoin Daily Analysis #79👋 Welcome to TradeCity Pro!
Let’s dive into Bitcoin and key crypto index analysis. As usual, in this analysis, I’ll walk you through the futures session triggers for the New York session.
⏳ 1-Hour Timeframe
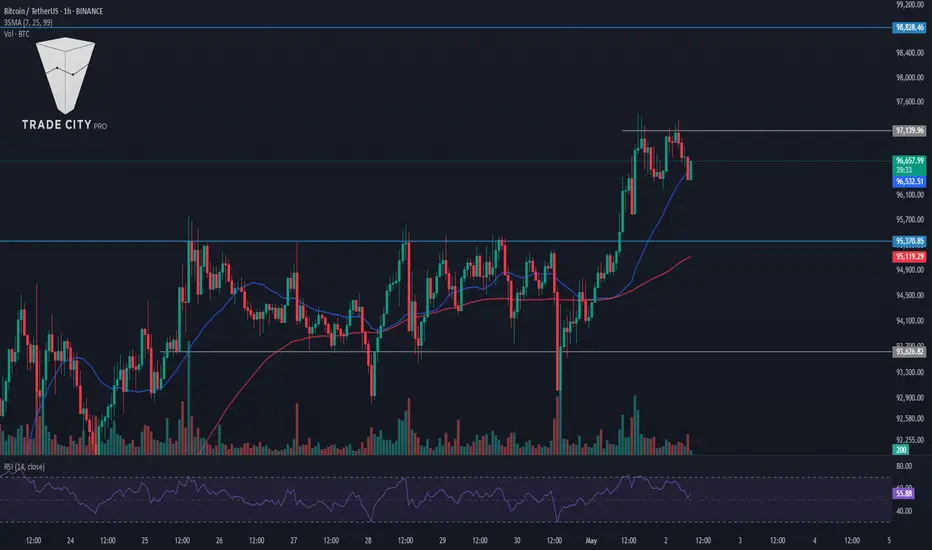
On the 1-hour timeframe, as you can see, yesterday the price stabilized above the 95370 zone and continued its movement up to 97139.
✔️ The reason the price couldn’t move higher is that the RSI failed to stay above the 70 level and didn’t enter the Overbuy zone — it got rejected there. As a result, the price also got rejected from the 97139 resistance and is currently in a corrective phase.
🧩 The SMA25 indicator has now caught up to the price, and this could bring upward momentum into the market. If that happens, the price might resume its upward move, and breaking the 97139 high could lead to a continuation toward the 98828 zone.
📊 Volume increased during the bullish candles, but after reaching the 97139 high, volume returned to previous levels, and the price has been ranging.
⚡️ Today, if RSI enters the Overbuy zone, a bullish move is very likely — in that case, I recommend definitely holding a long position.
🔽 As for short positions and bearish sentiment on Bitcoin, as I’ve been saying for a while, we should wait for a proper trend reversal before entering short trades.
📈 If the price doesn’t respond to the SMA25 and keeps ranging, the next parameter that could drive bullish momentum is the SMA99.
👑 BTC.D Analysis
Moving to Bitcoin Dominance — BTC.D is still trending upward. Yesterday, after breaking the 64.72 ceiling, it started a new bullish leg, and so far, there’s no sign of trend weakness.
🎲 I suggest waiting for a new structure to form. For now, it’s still rising, and if this continues, Bitcoin will likely outperform altcoins.
📅 Total2 Analysis
Looking at Total2, this index was rejected from the 1.05 resistance yesterday. The reason is that Bitcoin dominance surged, meaning not much money flowed into altcoins, and Total2 couldn’t break its ceiling.
🔼 If BTC.D reverses and pulls back, a lot of capital could move into altcoins — in that case, we can consider opening long positions on altcoins.
📅 USDT.D Analysis
Now to Tether Dominance — another reason Bitcoin couldn’t extend its bullish leg yesterday was this indicator. Support at 4.99 held, preventing money from entering the market, and causing the correction phase.
💫 Currently, the 4.99 level remains a crucial trigger. If it breaks, the main bullish trend in the market could begin. On the other hand, a break above 5.10 would likely push the market into a deeper correction.
❌ Disclaimer ❌
Trading futures is highly risky and dangerous. If you're not an expert, these triggers may not be suitable for you. You should first learn risk and capital management. You can also use the educational content from this channel.
Finally, these triggers reflect my personal opinions on price action, and the market may move completely against this analysis. So, do your own research before opening any position.
TradeCityPro | Bitcoin Daily Analysis #78👋 Welcome to TradeCity Pro!
Let’s get into the analysis of Bitcoin and key crypto indices. As usual, in this analysis I’ll review the triggers for the New York futures session.
⏳ 1-Hour Timeframe
As you can see in the 1-hour timeframe, Bitcoin is finally stabilizing above the 95,370 level. If this movement continues and the price stays above this level, the likelihood of a move up to 98,828 increases.
✔️ Over the past few days, I’ve strongly emphasized that you should open a position once 95,370 breaks. I hope you did, because that entry point was very significant, and breaking it could mark the beginning of Bitcoin’s next bullish leg.
💥 Currently, RSI is entering the Overbought zone, and if that happens, the chances of a sharp upward move increase. Buying volume is also rising, which is expected when a resistance level is broken.
📊 At the moment, opening new positions doesn't make much sense. If you already have an open position, I recommend riding the market momentum and taking profits whenever you notice momentum fading.
👑 BTC.D Analysis
Bitcoin dominance dropped slightly yesterday and returned below the 64.60 level. If this level is broken again, we can reconfirm the bullish sentiment.
🧩 If dominance gets rejected from the 64.60 ceiling, it’s likely to drop back down to the 64.22 support level.
📅 Total2 Analysis
Let’s look at Total2. Yesterday we saw a downward correction that extended to the 1.00 level. If you recall, I previously said I wouldn’t consider a trend reversal confirmed just from the 1.03 break — I’d wait for a break of the 1.00 support.
🔑 That’s why I didn’t close any of my positions at 1.03 and instead waited to see how the price would react at 1.00. As shown, the price reacted strongly at that level and quickly returned above 1.03.
✨ If the 1.05 level breaks, altcoins — just like Bitcoin — could begin a new bullish leg.
📅 USDT.D Analysis
Now let’s look at USDT dominance. Yesterday, it made a bullish move and broke above the 5.10 level, but the entire move turned out to be a fakeout, and the price dropped back below 5.10.
⭐ Currently, dominance is heading toward the 4.99 support. The main trigger for a bullish market shift is the break of this 4.99 level in Tether dominance. If this happens, altcoins will likely begin their bullish moves.
❌ Disclaimer ❌
Trading futures is highly risky and dangerous. If you're not an expert, these triggers may not be suitable for you. You should first learn risk and capital management. You can also use the educational content from this channel.
Finally, these triggers reflect my personal opinions on price action, and the market may move completely against this analysis. So, do your own research before opening any position.

TradeCityPro | Bitcoin Daily Analysis #77👋 Welcome to TradeCity Pro!
Let’s dive into the analysis of Bitcoin and key crypto indexes. As usual, I’ll walk you through the triggers for the New York futures session.
⏳ 1-Hour Timeframe
As you can see in the 1-hour timeframe, Bitcoin is still ranging, and volume has decreased compared to yesterday. In times like these when market volume is low, you need to pay closer attention.
✔️ Today, I’ve drawn an ascending trendline on the chart. When price performs very shallow corrections after an uptrend and each low is higher than the previous one, it indicates a very strong bullish trend. So if this trend continues, it can lead to some very attractive trade setups.
💥 As mentioned, volume is quite low today, and volatility is also lower than before. This means that most market participants are waiting to see what will happen before reacting. We should take the same approach and wait for our triggers to be activated.
📈 For a long position, it’s pretty clear that Bitcoin has a very important resistance at the 95370 level, which is currently the only long trigger. If you don’t have a position from lower levels, this is a very logical and attractive entry, and I suggest having a position ready if this level breaks.
📊 For a bearish scenario, we haven’t yet received confirmation, and we need to wait until at least the trendline is broken. After that, with the activation of a trendline trigger like the 93626 level, we can enter a short position.
👀 As I’ve said in previous analyses, I personally won’t open a short position unless Bitcoin reaches the 91945 level, as that’s my first confirmation for a trend reversal.
👑 BTC.D Analysis
Let’s check Bitcoin Dominance. The dominance range box continues, and yesterday it again moved upward from the 64.22 support and reached the range top at 64.60.
☘️ If you had opened a position on altcoins like ETH after their triggers activated yesterday, you probably hit stop-loss because of this dominance move. As dominance moved up after those triggers, capital flowed out of altcoins, causing many of them to fake out and fall back below their resistance.
📅 Total2 Analysis
Now for Total2. Just like Bitcoin, Total2 is forming a range box, but it has significantly less bullish momentum. While Bitcoin has some upward slope during its range, Total2 is completely flat and oscillating between 1.03 and 1.05.
⚡️ Triggers for Total2 remain unchanged: breakout of 1.05 for bullish confirmation and 1.03 for bearish. But just like I mentioned that I won’t act on Bitcoin’s 93626 break and will wait for 91945, here I also won’t act on a 1.03 break—I’ll wait for confirmation below 1.00.
📅 USDT.D Analysis
Let’s move to Tether Dominance. A new lower high has formed just below 5.14, and for now, I’ve adjusted the resistance level to 5.10, because as you can see, the price is reacting well to this area and we can use it as a trigger.
🧩 For a bearish USDT.D scenario (which would mean bullish for the market), breaking below 4.99 remains the key trigger. For a bullish USDT.D scenario, breaking above 5.10 would be the first confirmation of a shift in dominance upward.
❌ Disclaimer ❌
Trading futures is highly risky and dangerous. If you're not an expert, these triggers may not be suitable for you. You should first learn risk and capital management. You can also use the educational content from this channel.
Finally, these triggers reflect my personal opinions on price action, and the market may move completely against this analysis. So, do your own research before opening any position.

TradeCityPro | Bitcoin Daily Analysis #76👋 Welcome to TradeCity Pro!
Let’s dive into the Bitcoin analysis and key crypto indices. As usual, in this analysis I’ll review the futures triggers for the New York session.
⚡️ Not much has changed since yesterday, so without reviewing the previous analysis, let’s get into today’s setup to see what positions we can open.
⏳ 1-Hour Timeframe
As you can see on the 1-hour timeframe, the price is still within its range box. Even though yesterday it tested the lower range once and we expected a breakout to the upside, that didn’t happen, and the price was rejected from the 95370 resistance and continued to range.
✔️ After the rejection from this level, volume began to decline, which is a good sign. The lower the volume gets, the sharper the breakout move from the box is likely to be.
💥 If 95370 is broken, I definitely recommend having an open position, as the risk of hitting the stop loss is worth the potential gain. The target in case of a breakout will be the 98828 resistance.
⭐ The SMA99 is also providing good support and is currently sitting below the candles, which adds to the positive bias for this scenario.
🎲 If the price gets rejected from the resistance again, we’ll likely see more range-bound action today. But due to the strong bullish momentum, I don’t think the price will lose its support levels, and it’s likely to test 95370 again.
💫 That said, if I observe structural changes and see support levels like 91945 breaking, I’ll also be ready to take short positions.
🔽 However, for shorting, I think we should wait for more structure to form. Once the price shows more reaction to the 93626–95370 range box, and if 93626 breaks, we can enter a short. But right now, I’d personally wait for a break of 91945 before going short.
👑 BTC.D Analysis
Moving on to Bitcoin dominance, the range box is still intact, and price is above the 64.22 level. If Bitcoin breaks the 95370 resistance and BTC.D continues to rise without breaking below 64.22, then Bitcoin will outperform altcoins. If 64.41 is broken, we can expect a sharp bullish move in Bitcoin.
📊 To enter positions on altcoins, the best confirmation remains the break of the 64.22 level on BTC.D.
📅 Total2 Analysis
As for Total2, the 1.05 resistance still hasn’t been broken. To confirm the beginning of a bullish move in altcoins, we need a breakout of this level. The first target of this move would be the 1.07 resistance.
📉 To turn bearish, the first trigger is at 1.03. We’ll need to wait for the price to test it, so we can determine the precise level and react accordingly in future retests and breakouts.
📅 USDT.D Analysis
USDT.D behaves slightly differently from Bitcoin and Total2. While Bitcoin and Total2 are both near resistance and poised for a breakout, USDT.D is still some distance from the 4.99 support.
☘️ The probability of this support break coinciding exactly with Bitcoin and altcoin triggers is low. However, I believe this is a more significant trigger than Total2’s.
❌ Disclaimer ❌
Trading futures is highly risky and dangerous. If you're not an expert, these triggers may not be suitable for you. You should first learn risk and capital management. You can also use the educational content from this channel.
Finally, these triggers reflect my personal opinions on price action, and the market may move completely against this analysis. So, do your own research before opening any position.
TradeCityPro | Bitcoin Daily Analysis #75👋 Welcome to TradeCity Pro!
Let’s move on to Bitcoin and major crypto index analysis. As usual, in this analysis, I want to review the triggers for the New York futures session for you.
🔄 Yesterday's Analysis
In yesterday's analysis, I told you that if the price stabilizes below 93626, I expect a correction down to 91945.
However, this didn’t happen and the price faked below this area and moved back up, and now its trigger has been activated.
Let’s move on to today’s analysis to see what triggers are suitable for today.
⏳ 1-Hour Timeframe
In the 1-hour timeframe, as I said, the price faked downwards and moved up again, activating the first trigger at 94421.
The 94421 trigger was a preliminary trigger for the breakout of 95306, so if you opened this position, I suggest you wait to see if the price breaks the 95306 resistance or not.
✔️ The main trigger for a long position is still the breakout of 95306, which can start the next bullish leg for Bitcoin.
If you plan to open a position upon the breakout of this area, pay attention to the volume, and if volume increases at the same time, I suggest you definitely have a position.
💥 In the RSI oscillator, as you can see, the divergence we had in the previous bullish leg has been activated, and we can see its effect in the market, and now a new structure is forming, getting close to the Overbuy area.
⚡️ If RSI enters Overbuy and the 95306 resistance is broken, we could see a sharp and fast move toward the 98828 resistance.
📉 For a short position and for Bitcoin’s trend to turn bearish, yesterday I told you we have a risky trigger at the break of 93626, but I personally wouldn’t open a position with this trigger because it’s risky and I prefer to wait for a confirmed trend change.
🔍 Currently, the trigger I have for a trend change in Bitcoin is the break of 91945 and forming a lower high and lower low below this level. Otherwise, we should wait to see if a new structure for a trend change forms in the coming days.
👑 BTC.D Analysis
Let’s move on to Bitcoin Dominance analysis.
As you can see, Dominance has finally exited the range it had formed between 64.19 and 64.41, breaking 64.19 and moving downward.
🧩 If this decline continues, the next major support area for Dominance is 63.67, and Dominance could fall to this level.
If this happens simultaneously with Bitcoin’s rise, altcoins could experience a lot of sharp bullish moves.
📅 Total2 Analysis
Let’s move on to Total2 analysis.
As you can see, this index also faked the floor it had formed, and this fake breakout has brought bullish momentum into the market, and now it has managed to stabilize above 1.05.
⭐ The reason Bitcoin is still struggling with its resistance and hasn’t broken it yet is because Bitcoin Dominance is decreasing, causing Bitcoin to move upward slower than Total2.
📊 Currently, the next resistance for Total2 is the 1.07 area, and the probability of the price reaching this level is high.
If this bullish move gets faked, breaking 1.03 will be a good short trigger.
📅 USDT.D Analysis
Let’s move on to Tether Dominance analysis.
I believe the market is still waiting for Tether Dominance to move out of the range box formed between 4.99 and 5.14.
🚀 If the 4.99 level is broken, it can confirm that the market is turning bullish.
I think this trigger could start Bitcoin’s move toward a new ATH.
🎲 If 5.14 is broken instead, we can confirm the end of the bullish trend that the market has had in recent days.
❌ Disclaimer ❌
Trading futures is highly risky and dangerous. If you're not an expert, these triggers may not be suitable for you. You should first learn risk and capital management. You can also use the educational content from this channel.
Finally, these triggers reflect my personal opinions on price action, and the market may move completely against this analysis. So, do your own research before opening any position.
TradeCityPro | Bitcoin Daily Analysis #74👋 Welcome to TradeCity Pro!
Let's move on to Bitcoin and major crypto index analysis. As usual in this analysis, I want to review the triggers for the New York futures session for you.
⏳ 1-Hour Timeframe
In the 1-hour timeframe, as you can see, after the price was rejected from the 95306 area, it formed a short-term box between 93898 and 95306, and currently, the price is moving out of this box.
✔️ As you can see, after a large red candle and a second rejection from 95306, a lot of bearish momentum and selling volume entered the market, and now the price has broken the 93898 support. If the price stabilizes below this level, there is a possibility of a deeper correction down to 91945.
💥 The SMA99 indicator overlaps with the 93989 area, and if this PRZ (Potential Reversal Zone) formed by the price is broken, the probability of a further drop will increase.
⚡️ The RSI oscillator has also activated its divergence, and now we are seeing the effect of this divergence in the market. For a short position, if the 93898 area is broken, we can enter.
📈 For a long position, if the 93898 area gets faked out, we can enter a long with a fake breakout trigger in lower timeframes. The main trigger for a long is the break of 95306.
👑 BTC.D Analysis
Let's move on to Bitcoin Dominance. There is still a ranging box between 64.19 and 61.60, and the price is fluctuating between these two levels.
✨ Currently, confirmation for bullishness comes with a break of 64.60 or 64.41, and bearish confirmation comes with a break of 64.19.
📅 Total2 Analysis
Moving on to Total2, a ranging box has formed in this index between 1.03 and 1.05. These areas are suitable triggers for opening positions.
🧩 For a long position, a break of 1.05 could start the next bullish leg, with a target of 1.07.
🔽 For a short position, with a break of 1.03, the price could make a corrective move.
📅 USDT.D Analysis
Moving on to Tether Dominance, it is still struggling with the 4.99 support area and hasn't been able to stabilize below it.
📊 As long as this support holds, the next bullish leg in the market will not start. On the other hand, as long as dominance is below 5.14, the market trend remains bullish.
❌ Disclaimer ❌
Trading futures is highly risky and dangerous. If you're not an expert, these triggers may not be suitable for you. You should first learn risk and capital management. You can also use the educational content from this channel.
Finally, these triggers reflect my personal opinions on price action, and the market may move completely against this analysis. So, do your own research before opening any position.

TradeCityPro | Bitcoin Daily Analysis #73👋 Welcome to TradeCity Pro!
In this analysis, I want to give you a complete review of Bitcoin. There are just a few days left until the monthly candle closes, and it’s been a while since I analyzed higher timeframes for you, so it’s a good time to do that now.
📅 Monthly Timeframe
In the monthly timeframe, it’s very clear that Bitcoin has a long-term uptrend, which is still ongoing. The new leg of this trend started from the 16162 bottom and has so far extended to 104857.
⚡️ In the past few candles, the price has entered a phase of correction and consolidation, which is perfectly natural and necessary for the trend’s health. However, because this is happening on the monthly timeframe and takes months, some traders and market participants might think the uptrend has ended.
✔️ First of all, Bitcoin’s uptrend has not ended yet. We’ve just seen two red monthly candles, and now with this month's candle, bullish momentum is reentering the market. I believe the price can register a new all-time high (ATH). Even if that doesn’t happen, remember that Bitcoin’s dominance is very high, and this bullish cycle won’t last forever—eventually, Bitcoin dominance will start to fall.
🔍 If that happens and the percentage of money inside Bitcoin decreases, this capital will shift into altcoins. With this large inflow of capital, an altcoin season will begin.
📊 My personal view is that Bitcoin will have one more bullish leg toward 130,000 or 180,000, and after that, dominance will start to drop and the altcoin season will begin. Initially, Bitcoin will move upward, followed by strong, large-cap altcoins like Ethereum, BNB, XRP, etc. After these big players rally, capital will shift into good low-cap projects, leading to the crazy crypto pumps we've seen in previous bull runs.
🔽 This is the scenario I find most likely. But if the market moves against this scenario and dominance shifts earlier or later, I will adapt accordingly without being rigid in my analysis.
✨ As for Bitcoin turning bearish, I think that’s very unlikely for now, and the triggers for that are still far away from the current price. If that scenario becomes more probable, I’ll update my analysis and discuss it.
In short, for Bitcoin to turn bearish, it would need to make a lower high and a lower low compared to 104000, and if a sharp downtrend is to happen, the price must establish below 58000.
📅 Weekly Timeframe
In the weekly timeframe, we can see the bullish movement in more detail. A bullish move started from the 16162 bottom and after three bullish legs, the price reached the 104857 resistance.
💫 Currently, the price is in the correction phase of the third bullish leg and had pulled back close to the previous high of 71520. After forming a bullish engulfing candle, bullish momentum has returned, and the price is moving back toward 104857.
🎲 The 104857 area overlaps with the 0.618 Fibonacci Extension, creating a strong PRZ (Potential Reversal Zone). If this high breaks, the next resistance levels are the 0.786 and 1 Fibonacci levels, roughly around 125000 and 155000.
👀 There’s also a visible trendline in this timeframe that the price has touched three times, and each time the trendline bottom coincided with RSI support. However, the last time the price touched the trendline, it made a fakeout, which can be observed both on the price chart and on RSI.
⭐ This fakeout could inject even stronger bullish momentum and drive the price higher. But for this to happen, the current bullish leg must break above 104857—otherwise, the scenario fails, because if buyers truly have strength after a trendline breakout, they should be able to break the previous high.
☘️ If this doesn’t happen, it signals weakness, and the price could move back toward the 71000 support, with an increased probability of breaking it.
💥 In previous analyses, I also mentioned that during this bullish cycle, RSI has accurately indicated market bottoms each time it touched the 45.17 support level. This has happened again, and I hope you were able to benefit from it.
📅 Daily Timeframe
In the daily timeframe, as you can see, using the bullish leg up to 106247, we can draw a Fibonacci Retracement.
🔑 In the initial correction phase after reaching 106247, a box was formed between the 0.236 Fibonacci level and the 106247 top. After the 0.236 Fibonacci level, which overlapped with 90958, was broken, a deeper correction occurred down to the 0.5 Fibonacci level.
🔄 A descending trendline can also be drawn on the chart. As I mentioned in Bitcoin analysis #52, I advised spot buying upon the breakout of this trendline. I hope you were able to take full advantage of that opportunity.
📚 After the price reached the 0.5 Fibonacci level, a strong reaction occurred, and after activating the 87360 trigger, the price began a bullish move with strong buying volume and sharp candles, climbing back above 90958. If it holds above this level, it could move back toward the 106247 top.
💥 The RSI oscillator has increased significantly during this bullish move and is now near the Overbuy zone. If RSI enters the excitement zone, the likelihood of a sharp move toward the main resistance increases, and if RSI stabilizes above this zone, the probability of breaking the 106247 top will be very high.
📉 Currently, strong bullish momentum has entered the market, so we can expect a solid uptrend to continue. However, if the price falls back below 90958 before reaching the 106247 top, it would suggest that the entire bullish move was a fakeout, and bearish momentum could enter, pushing the price lower toward the 0.618 or even 0.786 Fibonacci levels.
⏳ 4-Hour Timeframe
Let’s check the 4-hour timeframe for futures triggers.
✔️ As you know from previous analyses, we had two main entry points for long positions at 85697 and 88289, and I hope you managed to open positions based on those.
💣 Currently, the price has reached the 95173 resistance and is being rejected. The RSI oscillator also shows a divergence, and if the 64.4 level breaks on RSI, temporary bullish momentum could fade.
🔼 In case of correction, the supports we currently have are at 92109 and 88289. For more levels, we’ll need to wait for a proper correction to use Fibonacci tools.
📈 For a long position, you can enter on the breakout of 95173. The next price target will be 98828.For a short position, we still need to wait for a proper trend reversal.
❌ Disclaimer ❌
Trading futures is highly risky and dangerous. If you're not an expert, these triggers may not be suitable for you. You should first learn risk and capital management. You can also use the educational content from this channel.
Finally, these triggers reflect my personal opinions on price action, and the market may move completely against this analysis. So, do your own research before opening any position.

TradeCityPro | Bitcoin Daily Analysis #72👋 Welcome to TradeCity Pro!
Let’s move on to Bitcoin analysis and the major crypto indexes. As usual, in this analysis, I’ll be reviewing the New York futures session triggers for you.
🔄 Yesterday’s Analysis
In yesterday’s analysis, I gave you a long trigger and said that if the price is supported at the 92007 area and moves toward 94283, you can enter the position after the breakout. This has happened now, and a few hours ago a candle closed above this area. Now we’ll have to see whether the price movement will continue or if it was a fakeout.
⚡️ Nothing else special has happened and for now, only the trigger is active. Personally, since I already had a Bitcoin position open, I opened this one on an altcoin instead, but Bitcoin was a better choice because dominance is rising again, and if you didn’t already have a position on Bitcoin, it would’ve been better to open one there.
Let’s get into the analysis to see how the market looks today.
⏳ 1-Hour Timeframe
As you can see, I placed a Fibonacci Extension over the bullish leg that started after the breakout of the 85550 level, and the 0.236 Fibonacci level overlaps with the 92007 level, where the price was supported.
💥 When the price rises from the 0.236 Fibonacci level, it means the trend strength is very high, and the price can easily start the next bullish leg. As you can see, that’s exactly what happened—the price quickly moved up to 94283 and is now above that level.
📚 So when the trend is this strong, rising from 0.236 and breaking the previous high, the next leg should start. If that doesn’t happen, it means there’s significant weakness in the uptrend. So if the price doesn’t move upward today and falls back below 94283, it would indicate strong trend weakness, and the likelihood of deeper corrections to lower Fibonacci levels like 0.382 or 0.5 will increase.
📈 For longs, as I told you yesterday, you can enter on the breakout of 94283, which is now active, but the price hasn’t started its move yet. So if you haven’t entered on this trigger, you can enter on a pullback to this level.
🔽 For shorts, even though I said a move back below 94283 would indicate significant weakness, always remember that weakness doesn’t mean trend reversal—it’s just a sign.
We confirm the trend reversal with a break of 92007 and the formation of lower lows and highs under this support. This would be the first short trigger and is considered quite risky.
📊 If you look closely, market volume has increased after the breakout. This shows a battle between buyers and sellers, and we need to see which side wins so we can join the winning team.
🧩 Also, pay attention to the RSI oscillator today. If RSI enters Overbought again, there’s potential for another sharp bullish move.
👑 BTC.D Analysis
Let’s look at Bitcoin dominance. BTC.D finally tested the 64.12 level and was supported there. Because of this volatility and the V-pattern formed in dominance, most altcoins activated their long triggers. But as dominance started rising again, altcoins fell back below their resistance levels, and if you had opened positions, there was a high chance you hit stop-loss. We can see this more clearly in the Total2 chart.
✔️ For BTC.D to continue rising, confirmation of the V-pattern through a breakout of 64.41 could act as a good trigger, with a move up to at least 64.60. However, the main trigger for the next bullish leg in BTC.D is a breakout above 64.60.
📅 Total2 Analysis
Let’s look at Total2. As I mentioned, most altcoin triggers were activated but didn’t follow through, and some even dropped and returned to their lows. This can be seen in Total2 as well.
✨ The reason for this is that money initially flowed into altcoins, activating their triggers. But simultaneously, Bitcoin’s trigger was also activated, and since BTC dominance rose, not much volume flowed into altcoins. That’s why Total2 is currently ranging around its 1.04 trigger level.
🔍 Regarding Total2, just like Bitcoin, this index was supported at the 0.382 Fibonacci level and activated its trigger at 1.04. A bounce from 0.382 indicates strong bullish trend momentum. (Bitcoin bounced from 0.236, which means BTC has an even stronger uptrend than Total2.)
🎲 So once the 1.04 trigger is activated, considering the strong trend momentum, a strong uptrend should start. If this doesn’t happen in the next few candles, the price will likely fall back below 1.04, and bearish momentum could enter the market.
📅 USDT.D Analysis
Let’s look at Tether dominance. As I’ve said in previous analyses, I believe the market is still moving in sync with USDT.D, and now it’s waiting for the 5% level to be broken.
🔑 That’s why Bitcoin and Total2 have both activated their triggers but haven’t started their major moves yet. In this bullish cycle, USDT dominance appears to have more weight than other indicators. I think the entire market is waiting for the 5% level in this index to break so that capital flows into Bitcoin and altcoins.
🔼 I recommend that if the 5% level breaks, be sure to have at least one long position open.
❌ Disclaimer ❌
Trading futures is highly risky and dangerous. If you're not an expert, these triggers may not be suitable for you. You should first learn risk and capital management. You can also use the educational content from this channel.
Finally, these triggers reflect my personal opinions on price action, and the market may move completely against this analysis. So, do your own research before opening any position.
TradeCityPro | Bitcoin Daily Analysis #71👋 Welcome to TradeCity Pro!
Let’s dive into the Bitcoin analysis and key crypto indicators. As usual, I’ll review the futures triggers for the New York session.
🔄 Yesterday’s Recap
In yesterday's analysis, I mentioned that the main triggers had already been activated, and it might be too late to enter a position. However, you could still enter trades using momentum triggers such as RSI and SMA.
⚡️ As we can see, the RSI oscillator, after exiting the Overbought zone, triggered a bearish divergence and has now dropped below level 50. This means the RSI trigger has not yet been activated, and the price didn't pull back to the SMAs either — instead, it broke below them and entered a short-term correction.
⏳ 1-Hour Timeframe
In the 1-hour timeframe, we can see that the price was rejected from the key resistance at 94,283 and dropped to the 92,007 zone.
✔️ The SMA99 is getting closer to the price, and we might see a pullback to this level. If this happens and the price builds a structure after the pullback, it could offer a good long entry during the correction.
📈 The main long trigger remains the breakout above 94,283, which would signal the start of the next bullish leg.
✨ For a healthier trend structure, the price might undergo a deeper correction, increasing the chances of a pullback to the SMA99 scenario playing out.
📊 However, note that during the drop to 92,007, selling volume increased, which is not favorable for the bullish trend. So, if you're planning to enter a long during this correction, make sure selling volume is decreasing and buying volume is rising.
🔽 For short positions, as mentioned in previous analyses, we must wait for a confirmed trend reversal. Currently, there is no trigger indicating a downtrend, and we need to wait for a new structure.
👑 BTC.D Analysis
BTC dominance is still climbing and moving toward the 64.60 resistance level. If it stabilizes above this level, it could initiate the next bullish leg for BTC dominance.
💥 For a bearish BTC.D scenario, either rejection from 64.60 or a breakdown below 64.12 would be appropriate triggers.
📅 Total2 Analysis
Total2 is showing a deeper correction compared to BTC, aligning with the increasing BTC dominance. It has corrected down to the 0.382 Fibonacci level.
🔼 For long positions, a breakout above 1.04 is a good trigger — but be sure to watch BTC.D to decide whether to go long on Bitcoin or altcoins.
⭐ As for shorts, like other charts, we need to wait for a confirmed trend reversal before considering a short position.
📅 USDT.D Analysis
This chart is also correcting, and after finding support at 4.99, it is now retracing upward and sits near 5.13.
💫 For the downtrend in USDT.D to continue, a break below 4.99 is crucial. If it holds below that level, the overall crypto market can continue moving upward.
❌ Disclaimer ❌
Trading futures is highly risky and dangerous. If you're not an expert, these triggers may not be suitable for you. You should first learn risk and capital management. You can also use the educational content from this channel.
Finally, these triggers reflect my personal opinions on price action, and the market may move completely against this analysis. So, do your own research before opening any position.

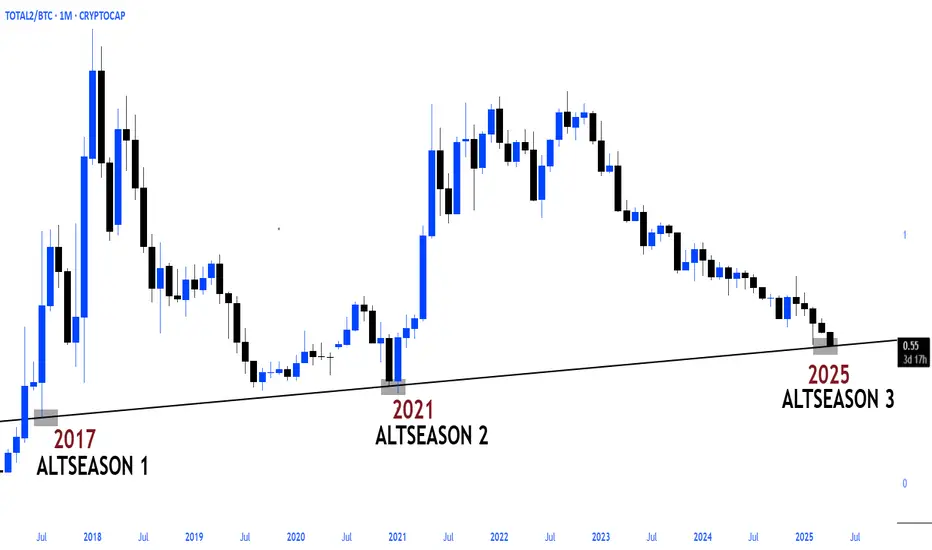
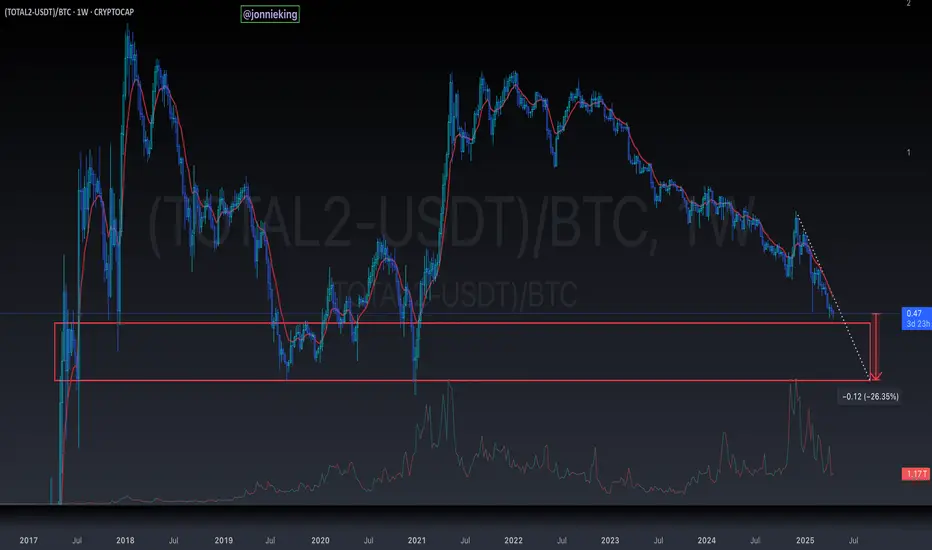
TOTAL2 / BTC - Majority of Alts Look BearishDon't shoot the messenger, but the MAJORITY of your Alts need to NUKE ~25% before Alt Season 🫨
This lines up with prior cycle support before Alt Season blastoff.
First step is to reclaim the EMA9, which they have failed to against BTC.
The lack of buying Volume supports this thesis for the trend to continue downwards.
TradeCityPro | Bitcoin Daily Analysis #70👋 Welcome to TradeCity Pro!
Let’s dive into Bitcoin and major crypto index analysis. As usual, in this analysis I’ll review the futures triggers for the New York session.
🔄 Yesterday’s Analysis
Yesterday, the price broke through the 88502 level, which was our main trigger for a bullish move. The price then made a very sharp upward move and even broke the next resistance at 92000, now heading toward 95307.
✔️ I also mentioned the RSI, saying if it enters the Overbought zone again, we could see a sharp leg toward 92000—and that’s exactly what happened, with strong upward movement.
🧲 I hope you opened a position, because all the triggers of my strategy were activated yesterday: the fake break of 84363, the breakouts of 85126, 85550, and 88502. These were the key trend-starting triggers, and I made sure to be in a position as those sharp candles formed to profit from the move.
🎲 So today it’s a bit harder to open new positions, which is natural, because 4 main triggers have already been activated. But I’ll try to share any new ones if they appear.
⏳ 1-Hour Timeframe
As you can see, we witnessed a very sharp move, with price consistently in Overbought, and now just exiting that zone.
⚡️ The triggers I can give today aren’t really based on support/resistance breaks. If you’re going to open a position, you should enter with minimum risk and based on momentum. That is, if you see bullish momentum coming in, go long.
☘️ You can use the SMA indicator or RSI oscillator for this. The price has pulled back multiple times to SMA7, and moved again with confirmation candles. You can also use this strategy with pullbacks to SMA25 or SMA99.
💥 The RSI is also a momentum oscillator, and if it re-enters Overbought, we could see more upside just like yesterday.
📊 In both strategies, make sure buying volume is increasing, and there is no volume divergence. Again, note that the main triggers have already been activated, and I believe the market needs to create a new structure before new entries. So today’s trigger is quite risky, and I personally won’t open a new position because I’m already in from lower levels.
🚀 If you, like me, have one or more open positions from lower levels, I recommend taking partial profit. If you have one position, take 40–50% off. If you have more than one, maybe close one entirely but keep at least one open.
👑 BTC.D Analysis
Let’s check Bitcoin dominance. Yesterday, with Bitcoin’s strong price action, dominance dropped slightly and was rejected at the 64.60 ceiling. That’s why some altcoins—especially in the DeFi category—saw strong rallies, and you could’ve opened positions on them.
💫 The next support is around 64.12, and I think BTC.D could drop to that level. A bullish trigger for dominance remains a break above 64.60.
📅 Total2 Analysis
In previous updates, I emphasized the 980 resistance level. I told you to try and have a long position ready if this level broke. As you can see, that’s exactly when the sharp move began. Now, even 1.02 has been broken, and Total2 is moving toward 1.04.
🔼 For long entries, confirmation from Bitcoin’s chart is more reliable since this index is highly correlated with BTC and is better for identifying targets or entries.
📅 USDT.D Analysis
As mentioned before, if 5.39 breaks in USDT.D, you should have a position ready. That level broke cleanly, gave entry triggers on the breakout, pullback, and break of pullback’s low, and then dropped sharply to 4.99.
🧩 Right now, USDT.D has reacted to 4.99 support, and I think the psychological 5% level has a strong impact here. I still believe the market is heavily dependent on Tether dominance, and if this support breaks, we could see another bullish leg in the market.
❌ Disclaimer ❌
Trading futures is highly risky and dangerous. If you're not an expert, these triggers may not be suitable for you. You should first learn risk and capital management. You can also use the educational content from this channel.
Finally, these triggers reflect my personal opinions on price action, and the market may move completely against this analysis. So, do your own research before opening any position.

TradeCityPro | Bitcoin Daily Analysis #69👋 Welcome to TradeCity Pro!
Let’s dive into the Bitcoin analysis and key crypto indices. As usual, I’ll walk you through the futures session triggers for New York.
🔄 Yesterday’s Analysis
In yesterday’s analysis, the 87562 trigger was activated and could have been used to open a long position. Initially, this trigger was faked out with a large candle pulling the price back below the level. However, after a pullback to the SMA25, strong bullish momentum entered the market, and 87562 was broken.
⚡️ The next resistance that the price reacted to was 88502, where several candles stalled just below this level. Now it looks like the price is attempting to stabilize above it.
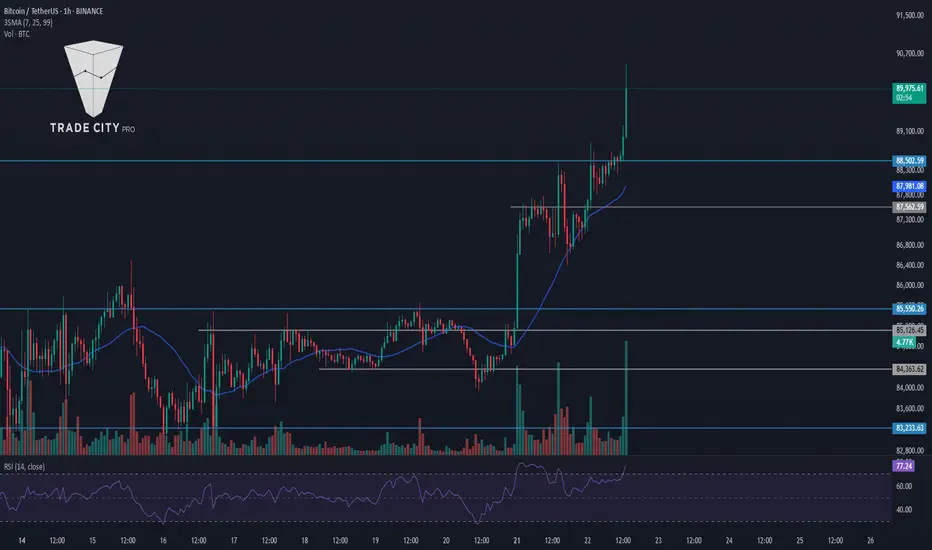
⏳ 1-Hour Time Frame
As you can see, after the breakout of 87562, a solid bullish momentum entered the market, and volume also increased. The RSI oscillator has been hovering near 70, which has supported a gradual upward move. Currently, the price has broken above 88502.
✔️ At the moment, the price trigger is considered active, and there are no significant resistances immediately ahead. However, since RSI hasn’t yet entered Overbuy, the kind of strong momentum that can push the price toward 92000 hasn't fully kicked in — and that’s why we haven’t seen a big sharp candle yet.
💡 For a long position, keep a close eye on the break of RSI 70. If RSI breaks this level, it could trigger a strong upward move to 92000, and you’ll want to be positioned for that.
🔽 For a short position, as I’ve mentioned before, we still need to wait for a clear trend reversal and the emergence of bearish momentum. Personally, I won’t open any shorts until that happens — no active short triggers at the moment.
👑 BTC.D Analysis
BTC dominance continues its upward move. If it breaks above 64.60, it could extend its bullish leg further.
📈 As a result, today a Bitcoin long looks more logical than long positions on altcoins.
📅 Total2 Analysis
The Total2 index is currently breaking above 980, and alongside this move, you might consider opening a position on one of the altcoins. If the index stabilizes above 980, it could signal an opportunity for a long-term long position.
🧩 As for bearish setups, we’ll need to wait until there’s a momentum shift in the overall market.
📅 USDT.D Analysis
As I mentioned before, the entire market was waiting on the break of 5.39 in USDT.D — and that level was finally broken. Yesterday, the price pulled back to this level and then continued downward, breaking below 5.32 and even 5.24, a significant support level.
📉 Right now, I don’t have a specific trigger to offer, as the market is moving sharply. But keep an eye on altcoins, because many of them still haven’t activated their triggers yet.
❌ Disclaimer ❌
Trading futures is highly risky and dangerous. If you're not an expert, these triggers may not be suitable for you. You should first learn risk and capital management. You can also use the educational content from this channel.
Finally, these triggers reflect my personal opinions on price action, and the market may move completely against this analysis. So, do your own research before opening any position.
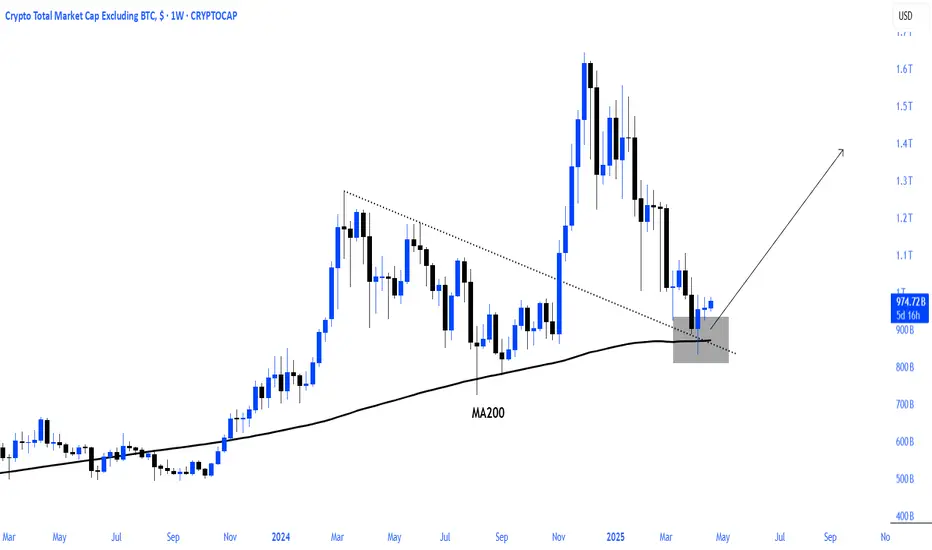
total2 altcoins #Altcoins need to bounce off current zone for a #Altcoins need to bounce off current zone for a full reversal!
countdown to recovery
TradeCityPro | Bitcoin Daily Analysis #68👋 Welcome to TradeCity Pro!
Let’s move on to the analysis of Bitcoin and key crypto indices. As usual, in this analysis I want to review the futures session triggers for New York.
🔄 Yesterday's Analysis
In yesterday’s analysis, I told you that since the 84363 level was broken, RSI had entered Oversell, and selling volume had increased — if sellers were truly stronger than buyers, the price could drop to 83233. But if that didn’t happen and the price returned above 84363, we could say the move was fake and both the momentum and selling pressure were also fake — and the price could move upward.
👀 As you can see, that’s exactly what happened. The move turned out to be a fake break, and the price reversed. With this fakeout, we could have opened a position in the lower timeframes — as shown in the chart I provided. In the 15-minute time frame, after the fakeout of 84363, the price formed a top at 84633, and with a strong breakout candle, the trigger was activated and the price moved upward — reaching a 15:1 risk-to-reward ratio so far.
🚀 Another position could have been opened in the 1-hour time frame, where we could have entered after breaking 85126. As you can see, the candle closed above this level, the price moved up, and the position reached a 5:1 risk-to-reward.
⏳ 1-Hour Time Frame
In the 1-hour time frame, as you can see, the price moved up to 87562 and has now been rejected from this level. The RSI has also exited the Overbuy zone.
✔️ To continue the upward trend and open a long position, for now — since the market hasn’t formed much structure yet — you can enter on the break of 87562. But if more structure forms, you can enter on the break of the new structure or a pullback to the SMA25.
📉 For a short position, we need to wait for now, because market momentum is bullish, and in my opinion, we shouldn’t trade against the trend. So, if you want to short, wait for a trend reversal, or for the price to fall back below 85550, which would invalidate the whole move as a fakeout.
💥 Keep an eye on momentum oscillators like RSI today. If RSI enters Overbuy again, there’s a strong chance of a new bullish wave starting.
👑 BTC.D Analysis
Bitcoin Dominance also moved upward yesterday in sync with the overall market, reaching 64.12.
☘️ If the price can stabilize above 64.12, the next bullish leg of BTC dominance will start. The first trigger for a bearish shift in BTC dominance is the break of 63.67.
📅 Total2 Analysis
Now let’s look at Total2. Yesterday, the 965 level was broken and the price moved up to 980, but — just like Bitcoin — it was rejected from that level and is now pulling back.
🔼 To continue the bullish move, breaking 980 will be a valid trigger. For short positions, we need to wait for a trend reversal.
📅 USDT.D Analysis
Looking at Tether Dominance (USDT.D), as you can see, it also had a sharp move yesterday, breaking 5.44 and 5.39, and reaching 5.32.
✨ The key support for the past few days was at 5.39, and now that this level is broken, the price dropped to 5.32 where it found support.
🎲 Continuation of the bearish trend in USDT dominance requires a break of 5.32. For a bullish reversal, we need to wait for a clear change in trend.
❌ Disclaimer ❌
Trading futures is highly risky and dangerous. If you're not an expert, these triggers may not be suitable for you. You should first learn risk and capital management. You can also use the educational content from this channel.
Finally, these triggers reflect my personal opinions on price action, and the market may move completely against this analysis. So, do your own research before opening any position.
TradeCityPro | Bitcoin Daily Analysis #67👋 Welcome to TradeCity Pro!
Let’s move on to the analysis of Bitcoin and key crypto indicators. In this analysis, as usual, I want to review the New York futures session triggers for you.
✔️ Yesterday, the price was rejected from the 85,550 area, and today could be a sensitive and important day for the market.
⏳ 1-Hour Timeframe
In the 1-hour timeframe, I mentioned yesterday that the 85,126 trigger had been activated and if the price pulled back to this area and broke above 85,550, we could witness a bullish move and the start of an upward wave. But that didn’t happen—the price was rejected from the 85,550 high and started moving downward.
👀 Currently, with the price stabilizing below the 85,126 area, selling volume has entered the market, and the price is moving down. The last candle closed below the 84,363 area, and the RSI has entered the oversold zone. If the move continues, the price could experience a bearish leg and move down to 83,233.
🔽 In that case, a break below the 83,233 area could be a good short position trigger, as it would give us confirmation of a trend reversal. But if the move doesn’t continue, this level could turn out to be a fake-out, and the price might head back toward the 85,550 high.
🎲 So today, you can enter a short position with a break of 83,233, and a long position with a break of 85,550. Pay attention to volume and RSI, as they can provide many confirmations for the next price trend.
👑 BTC.D Analysis
Let’s look at Bitcoin dominance. Yesterday, dominance dropped another leg and broke the 63.76 low, but now it has returned to this area and is stabilizing above it.
📈 For a bullish confirmation, dominance needs to stabilize above the 64.12 area, and for a bearish one, it needs to stabilize below 63.12.
📅 Total2 Analysis
Now for the Total2 analysis. This index was rejected from the 965 area yesterday and is now stabilizing below 954. If the bearish momentum continues, the next support level that could hold the price is 932.
🔼 To turn bullish, a break above 965 is required, with the main trigger being 980.
📅 USDT.D Analysis
Let’s look at Tether dominance. Yesterday, it made an upward move and was supported at the 5.44 level. It has now reached 5.52.
✨ If 5.52 is broken, we’ll have confirmation of a bullish trend in dominance. If 5.44 is broken instead, we could anticipate a bearish move and potentially a break of 5.39.
❌ Disclaimer ❌
Trading futures is highly risky and dangerous. If you're not an expert, these triggers may not be suitable for you. You should first learn risk and capital management. You can also use the educational content from this channel.
Finally, these triggers reflect my personal opinions on price action, and the market may move completely against this analysis. So, do your own research before opening any position.
TradeCityPro | Bitcoin Daily Analysis #66👋 Welcome to TradeCity Pro!
Let’s dive into the analysis of Bitcoin and major crypto indices. As usual, I’m going to review the New York futures session triggers for you in this analysis.
⌛️ 1-Hour Timeframe
Yesterday, the 85126 trigger was activated, but the price hasn’t started its move yet and is still ranging above this level. As I previously mentioned, this trigger is an early entry trigger, and the main trigger for a long position is the breakout of the 85550 level.
✔️ So if you haven’t opened a position on the early trigger, don’t worry, because the main trigger hasn’t been activated yet. If the price moves upward, you can still open a position on the breakout of this main trigger.
Therefore, our long position trigger for today is the 85550 level, and breaking this level could start a new bullish wave.
📊 Make sure to keep an eye on the volume. If the volume increases simultaneously with the price approaching 85550, it would be a positive sign for the bullish trend. Entry of RSI into the overbought zone is another confirmation that could bring bullish momentum.
🔽 For a short position, the main trigger is still the breakout of 83233. However, if you’re looking for an earlier entry, the breakout of 84363 is also suitable.
📚 Overall, be cautious today since it’s Saturday and most market participants are off, but considering that Bitcoin is near a key level, we might still see movement.
👑 BTC.D Analysis
Let’s move on to the Bitcoin dominance analysis. As you can see, dominance has undergone a corrective downward move and has reached the 63.76 level and found support there.
💫 If dominance holds at this support, the next key resistance overhead is 64.12, and breaking this level would initiate the next bullish leg for Bitcoin dominance.
💥 Breaking the 63.76 level would give a temporary confirmation of bearishness in dominance. The next support levels are 63.61 and 63.23.
📅 Total2 Analysis
Let’s move on to the Total2 analysis. Due to the bearish movement in Bitcoin dominance, this index has seen a bullish move and has broken the 954 level.
✨ If the price pulls back to this level and resumes upward movement, and if you already have an open position, you can hold it up to the 980 level. If you missed out, the next trigger would be the breakout of the previous high and confirmation through Dow Theory.
📉 The bearish confirmation for Total2 would be the breakdown of 954.
📅 USDT.D Analysis
Now let’s take a look at Tether dominance. Yesterday, the 5.48 level was broken, and the price is now heading toward the 5.39 support.
🧩 If the 5.39 level in Tether dominance is broken, I strongly recommend having an open position, because this is a very significant support level. Breaking it could start a new trend in the market.
❌ Disclaimer ❌
Trading futures is highly risky and dangerous. If you're not an expert, these triggers may not be suitable for you. You should first learn risk and capital management. You can also use the educational content from this channel.
Finally, these triggers reflect my personal opinions on price action, and the market may move completely against this analysis. So, do your own research before opening any position.
TradeCityPro | Bitcoin Daily Analysis #65👋 Welcome to TradeCity Pro!
Let’s move on to the analysis of Bitcoin and key crypto indicators. In this analysis, as usual, I want to review the New York futures session triggers for you.
🔄 Yesterday, the market was range-bound again, and none of my triggers were activated. Today, a high has formed that could be suitable for opening an early position.
⏳ 1-Hour Timeframe
In the 1-hour timeframe, as you can see, the price is within a box between 83,233 and 85,550, and market volume has decreased compared to yesterday. I recommend keeping an eye on the market today because the volume is very low, and the likelihood of a sharp move is high.
✔️ Today, we have a new trigger for a long position. In yesterday's analysis, I said that the price is creating a new high that could be used as a trigger if it reacts to this area again. As you can see today, the price reacted to this area and was rejected from it.
💥 So, considering that a sharp move is likely, it wouldn’t be bad to open a long position on the breakout of 85,126 so that if we can’t get a proper confirmation from the candle on the breakout of 85,550, we already have a position open.
⚡️ However, for a short position, the 83,233 trigger is still valid and this area is very important. If the price stabilizes below this support, the next supports the price could reach are the areas of 80,595 and 78,778.
👑 BTC.D Analysis
Let’s move on to Bitcoin dominance. As you can see in the chart, I told you yesterday that if the price is supported from the 63.87 area and breaks the previous high, the next bullish leg could begin. However, although dominance was supported at this area, it failed to break the previous high, formed a lower high, and is now again at the 63.87 support.
🔼 If this support is broken, we can temporarily confirm a bearish move in dominance. The next key supports for Bitcoin dominance are the areas of 63.61 and 63.23.
📈 For Bitcoin dominance to become bullish again, in my opinion, we need to wait for it to break the previous high at 64.12.
📅 Total2 Analysis
Let’s move on to the Total2 analysis. The condition of this index is very similar to Bitcoin, but because Bitcoin dominance is bullish, Total2 is one level lower than Bitcoin. Although Bitcoin is struggling with its main resistance, Total2 has moved away from the 980 area and has formed its box between 954 and 932.
🔽 If the 954 area is broken and Bitcoin dominance is bearish, you can open a long position. But if dominance is bullish, Bitcoin will be a better choice.
🎲 If the 932 bottom is broken, you can confirm a bearish trend in altcoins. In this case, I think dominance will become bullish and altcoins will drop more than Bitcoin.
📅 USDT.D Analysis
Let’s look at Tether dominance. The entire market is waiting to see what Tether dominance does with the 5.39 area. If it is supported at this area and breaks the 5.59 high, we can say that dominance is bullish and the market may drop.
🔍 But if dominance can first break the 5.48 area and then the 5.39 area, the market could start a new bullish move and Bitcoin will definitely break the 85,550 high.
❌ Disclaimer ❌
Trading futures is highly risky and dangerous. If you're not an expert, these triggers may not be suitable for you. You should first learn risk and capital management. You can also use the educational content from this channel.
Finally, these triggers reflect my personal opinions on price action, and the market may move completely against this analysis. So, do your own research before opening any position.
