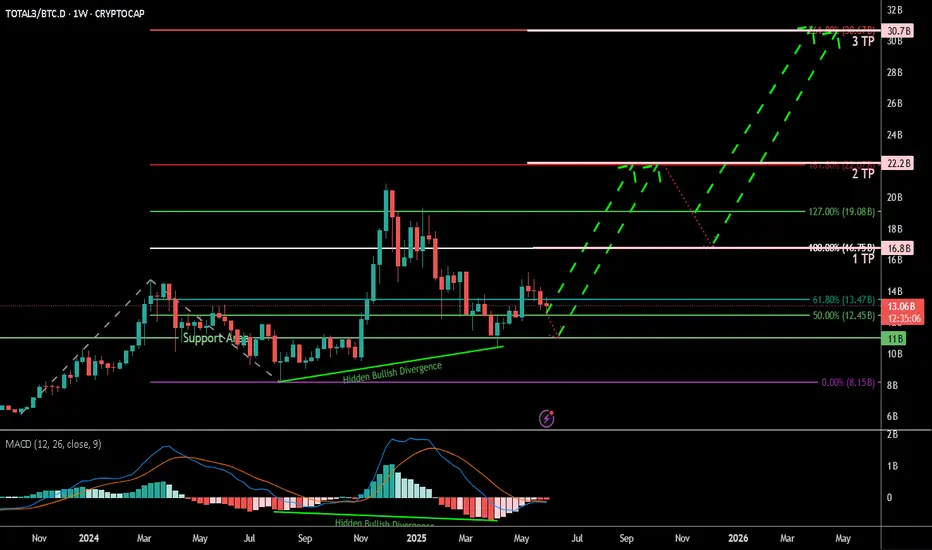
Altseason Index Proxy (TOTAL3 / BTC.D) Weekly TF
Symbol & Timeframe:
* **Symbol**: CRYPTOCAP\:TOTAL3 / CRYPTOCAP\:BTC.D
* **Timeframe**: Weekly (1W),
* **Purpose**: A clean, data-driven proxy for detecting altseason momentum
Technical Structure:
✅ Key Support Zones
* **13.47B (61.8% Fib)**: Critical golden zone; current price consolidation area
* **12.45B (50.0% Fib)**: Lower bound of golden zone
* **11.00B**: Historical support zone
* **8.15B (0.0%)**: Absolute bottom of retracement range
🔹 Hidden Bullish Divergence
* **MACD Histogram & Signal Lines** show hidden bullish divergence
* Price action forming **higher lows** while MACD makes **lower lows**
* Indicates trend continuation potential
🔢 Fibonacci Targets
TP1: 16.8B (100.0%)
TP2: 22.2B (161.8%)
TP3: 30.7B (261.8%)
🔄 Expected Path
* Potential short-term correction toward 12.4B followed by a breakout
* Bullish continuation path sketched with progressive Fib targets
📈 Macro & Fundamental Confluence
📉 Liquidity and Monetary Easing
* Global monetary policy is easing (e.g., Fed pivot expected mid-2025)
* Increased liquidity historically precedes strong altcoin rallies
BTC Dominance Decline
* BTC.D rolling down from long-term highs
* Signals beginning of capital rotation into altcoins
🚀 Emerging Narratives
* Rise of L2s (e.g., Base, zkSync), AI tokens, real-world asset protocols
* Fresh narratives tend to amplify altseason rotations
💼 Institutional Tailwinds
* Spot ETH ETF approvals pave way for alt ETF flows
* Regulatory clarity expected to reduce uncertainty in late 2025
Related Reference Charts:
🌐 TOTAL3 (Altcoin Market Cap Excluding BTC & ETH)
📊 BTC Dominance (BTC.D)
These charts offer standalone confirmation of:
Altcoin strength forming on TOTAL3
BTC dominance facing structural resistance
Composite Altseason Thesis:
1. Liquidity injections + halving = BTC rally
2. BTC.D breakdown + TOTAL3 support = altcoin strength
3. Technical confirmations: hidden divergence, fib confluence
4. Narrative and regulatory catalysts = widespread rotation
**Conclusion**:
We are entering a prime zone for altseason acceleration. Price reclaim above 13.47B and continued BTC.D drop will validate bullish thesis. Monitor closely for breakouts past TP1 and momentum into TP2/TP3.
📌 Current status:
- Price rebounding in the 12.45–13.47B Fibonacci zone (50–61.8%)
- Hidden bullish divergence on MACD + ascending price structure
- BTC.D has rolled off 65% resistance — suggesting capital rotation
📊 Altseason Thesis:
1. Post-halving BTC rally → profit dispersion into altcoins
2. Macro conditions (Fed pivot, record liquidity) enabling risk-on environment
3. Technical confirmation via index momentum and fib structure
4. Narrative tailwinds: Layer-2 adoption, AI-crypto, altcoin ETF catalysts
📈 Targets:
- TP1 @ 16.8B (100% Fib)
- TP2 @ 22.2B (161.8% Fib)
- TP3 @ 30.7B (261.8% Fib)
🟢 Key support: 12.45–13.47B zone; breakout + BTC.D collapse = altseason trigger.
Total3
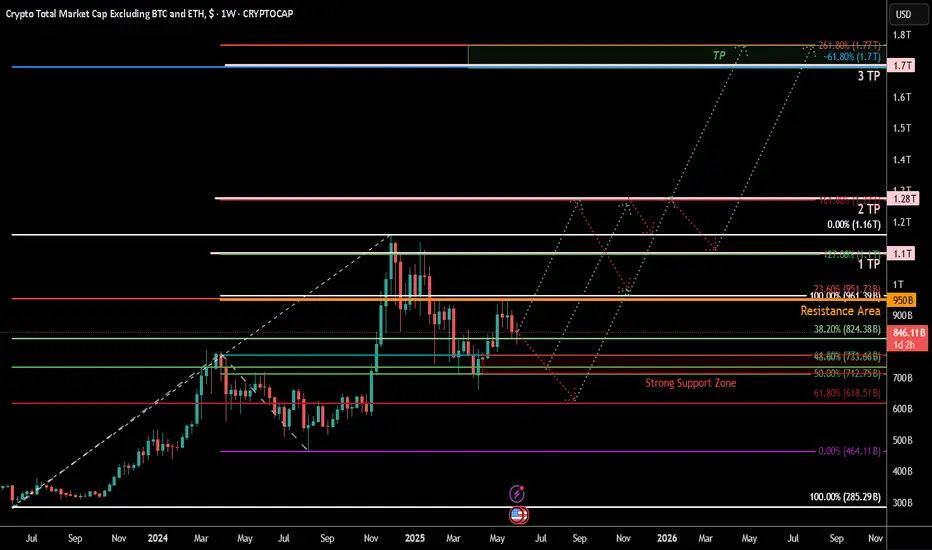
TOTAL3 – Altcoin Market Cap (Excluding BTC & ETH) Weekly TF 2025Summary
TOTAL3 is currently in a macro bullish cycle and undergoing a mid-cycle correction. The chart presents a Fibonacci-based structural roadmap with 3 Take Profit zones, identifying both correction supports and breakout targets. There is a high probability of short-term downside before a significant altcoin rally.
🌈 Chart Context
Fibonacci Retracement (Primary Leg):
100% = 285.3B
0% = 1.16T
Trend-Based Fibonacci Extension
A = 285.3B
B = 775B
C = 464.11B
Price as of analysis: ~845.62B
Key Technical Observations
Support Levels:
61.8% Fib Retracement = 618.5B
Strong Confluence Zone: Fib Retracement 48% + Fib Extension 50–61.8% (highlighted on chart)
38.2% Fib Retracement = 824.38B
Resistance Levels:
951.73B: 23.6% Retracement + 100% Extension – strong resistance zone before $1T psychological level
Take Profit Zones:
1 TP (1.1T) = 127% Fib Extension (Upper leg of parallel extension)
2 TP (1.28T) = 161.8% Fib Extension
3 TP (1.7T) = -61.8% Fib Retracement and 261.8% Extension confluence zone
Pattern & Projection:
The structure suggests a possible correction phase to lower support before continuation.
Bullish continuation expected after corrective phase, shown by the projected dotted path.
Structure: Bullish structure with healthy correction in mid-phase of the macro uptrend.
Fundamental Context
Altcoin Lag: TOTAL3 remains ~40% below its ATH, while BTC and ETH have already hit new highs.
Liquidity Shift Expected: Altcoin capital rotation tends to follow after BTC dominance stabilizes or drops.
Macro Backdrop:
Fed expected to cut rates later in 2025
Stablecoin legislation and ETF narratives building altcoin trust
Institutional inflows are slowly diversifying from BTC to ETH and large-cap alts
These suggest a possible shakeout or deeper correction before altseason breakout gains strength.
Bias & Strategy Implication:
Bias: Bullish Mid-Term – Correction Before Continuation
Expected Scenario: Pullback to strong support zones (824B–733B–618B), followed by a sustained breakout toward 1.1T–1.7T.
Invalidation: Weekly close below 618B may delay bullish structure and extend correction.
Strategy:
Long entries at support zones with tight invalidation
Scaling out near TP1, TP2, TP3 based on market momentum
Philosophical View
Patience is the virtue of the second leg in a macro trend. The correction serves to eject the impatient, reprice risk, and strengthen conviction. When TOTAL3 rises from deep support, it will be not just price but confidence that rallies.
Related Reference Charts
TOTAL Market Cap Structural Breakout:
TOTAL2 Altcoin Chart with Fibonacci Path:
✅ Tags
#TOTAL3 #AltcoinMarket #Fibonacci #Altseason #CryptoCorrection #CryptoMacro #TechnicalAnalysis #BullishOutlook #MidCycleCorrection #Crypto2025
⚠️ Notes & Disclaimers
This analysis is educational and not financial advice. Markets are inherently risky. Do your own research and manage risk accordingly.
Market3I haven’t been posting much lately simply because there’s nothing particularly interesting to say, the market has been a bit dull.
2025 should be a strong year for altcoins, as they’ve been consistently suppressed. With BTC dominance reaching 64%, which is quite significant, all attention remains on Bitcoin.
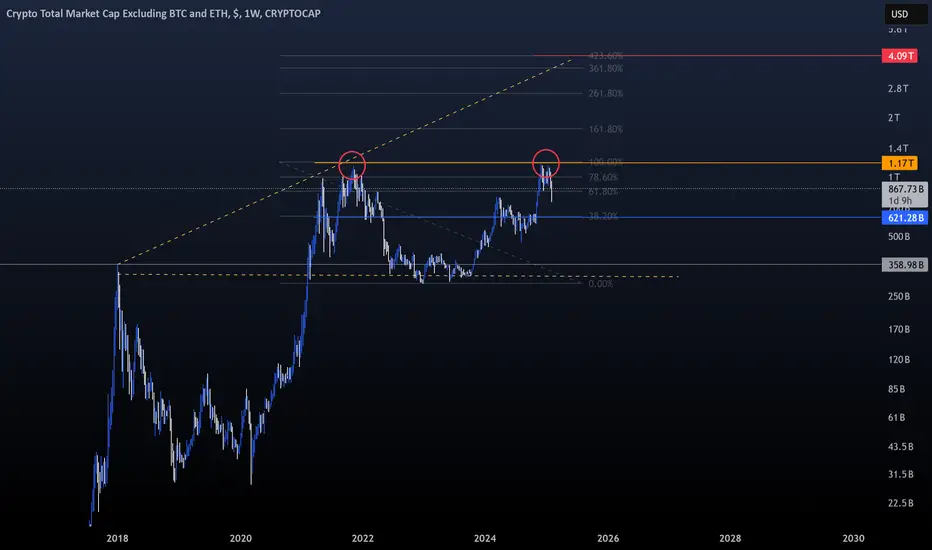
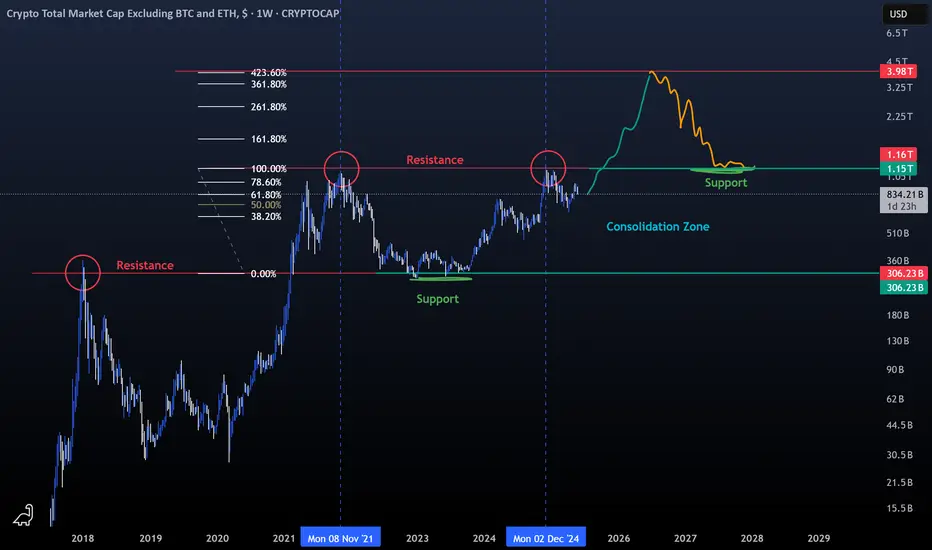
On this chart, you can see that $1.17 trillion acted as a rejection level for the crypto market (excluding BTC and ETH). Time will tell, but I anticipate a $4 trillion altcoin bull market before the end of 2025.
Remember, Fibonacci plays a crucial role in long-term market predictions.
Invest wisely and at the right time.
Happy Tr4Ding !
Altcoins The Moon AwaitsLike always, everything is clearly outlined on the charts :
- As a trader, it's crucial to follow logic and technical analysis. If you get caught up in the news and listen to everyone on Twitter, you won't last long.
- The first major altcoin rally was in 2018, pushing the market to $300 billion. This level later acted as a key support throughout the 2022–2023 bear market.
- The last all-time high for the crypto market (excluding Bitcoin and Ethereum) reached $1.15 trillion in 2021. ( blue doted vertical line )
- This all-time high was retested in December 2024, with this ATH acting as strong resistance. ( second blue doted vertical line )
- The next move could be a breakout above this resistance. According to Fibonacci projections, the altcoin market has the potential to reach $4 trillion.
While the spotlight remains on Bitcoin and ETFs, altcoins could catch up with a sudden and powerful surge, so make sure you’re not left behind.
Hodl!
Happy Tr4Ding !
Total3 Crypto Market CapWe know very well that Trump, at the moment, is able to move markets overnight. We also know well that such a market is difficult to navigate.
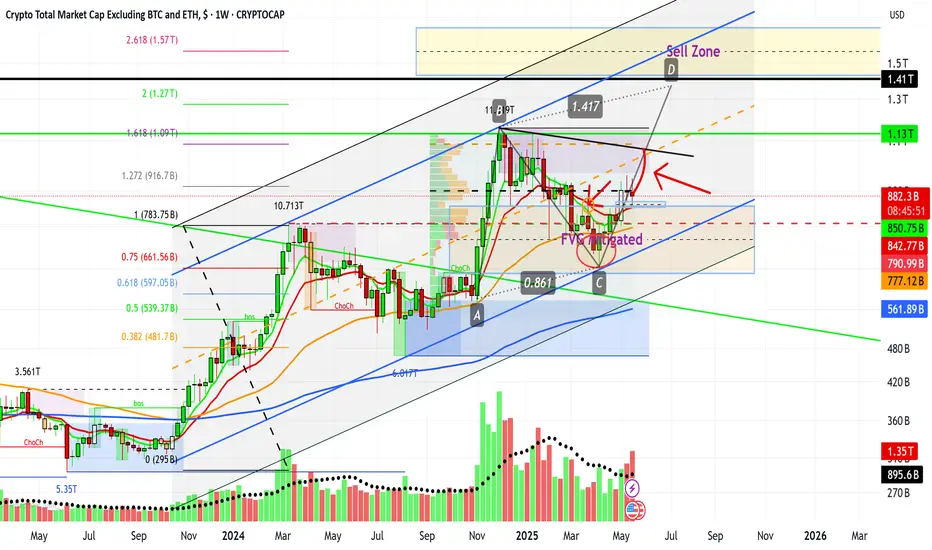
Nevertheless, we do have chart indications, as in this case:
- volatility, money inflow and others are in the middle.
- on the weekly, Total3 has bounced from the underlying structure, which may signify strength.
- the candle resting on the weekly FVG will be closed later.
- the indicators look good but not too good. Based on some altcoins (weekly), I see hope there.
- gray and delicate situation.
- best strategy: scalp, small profits, buy the dip and hold. Little or no leverage. Don't get hurt.
I will update to keep you posted on developments.
TOTAL3 ROADMAPMy scenario is like this.
* The purpose of my graphic drawings is purely educational.
* What i write here is not an investment advice. Please do your own research before investing in any asset.
* Never take my personal opinions as investment advice, you may lose your money.

total3 altcoins Altcoins expansion phase to continue hard
waves over short periods of time are the fuel for a new leg

TOTAL 3 ROADMAP (3D)This analysis is an update of the analysis you see in the "Related publications" section
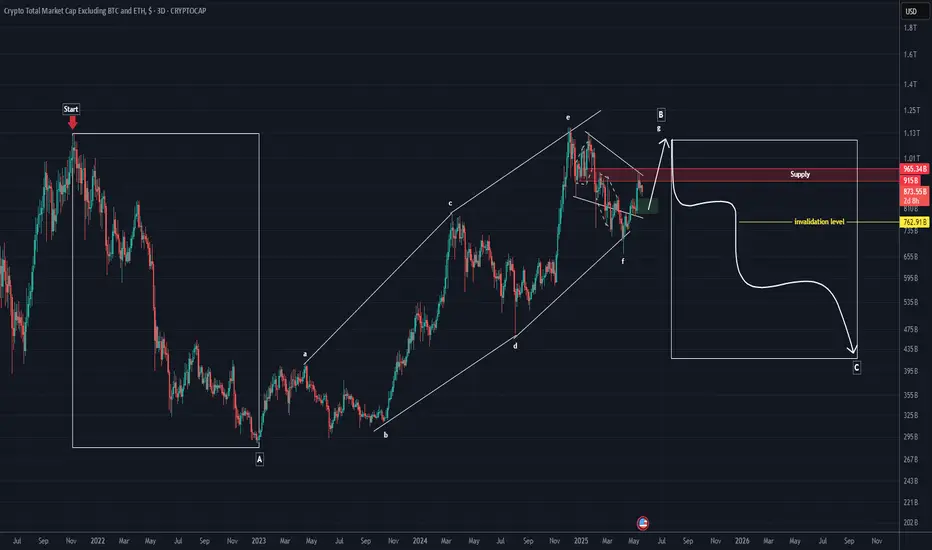
TOTAL3 refers to the total crypto market cap excluding Bitcoin and Ethereum.
If we zoom out and observe what altcoins are doing, we might gain better control over the market.
We know that in the past few days, there have been heavy pump-and-dump moves that have hunted liquidity.
From the point where we placed the red arrow, it appears that a correction in TOTAL3 has begun. This correction seems to be forming a flat pattern, and we are currently in wave B of that flat. Wave B itself appears to be a diagonal (diametric), and we are now in wave F of it.
The triangle from the previous analysis is actually the triangle of wave F, and altcoins have turned red as they are likely in wave e of this triangle.
Wave g of B is expected to start soon (from the green zone), and a bullish rally could follow.
After this rally, price may enter a deeper correction equal in size to wave A, forming a large wave C | a move that could take over 423 days to complete.
This seems to be the roadmap for TOTAL3.
For risk management, please don't forget stop loss and capital management
Comment if you have any questions
Thank You
Altcoin Market Holding Strong – Breakout on the Horizon!📈🚀 Altcoin Market Holding Strong – Breakout on the Horizon! 🌈📊
Hey Traders!
The altcoin market is gearing up for a powerful breakout! TOTAL3 (the altcoin market cap excluding BTC and ETH) is holding perfectly above the critical $893B support zone. This is exactly the kind of price action we expect before major upside explosions!
📊 Key Levels to Watch:
📍 Support Holding Strong: $893B – Bulls are defending this level with conviction.
🚀 Breakout Zone: A clear move above $900B sets the stage for a rapid surge toward $1.13 Trillion, a potential +25% rally!
✅ The structure is bullish, momentum is building, and the charts don’t lie—this market wants higher!
📚 Why This Time Feels Different:
BTC dominance is struggling at resistance—this is the perfect environment for altcoins to shine! 🌟
Real crypto projects are finally starting to show strength amid all the meme coin noise.
We’ve seen this setup before… and it led to explosive alt rallies. History may not repeat perfectly, but it sure loves to rhyme! 🎯
💬 Your Next Move:
Are you already positioned for this altseason breakout, or planning your entries now?
Which altcoins are you most bullish on for this run to $1.13T and beyond?
This is the moment serious traders wait for—don’t let it slip by! The market is loading the rocket… will you be on it when it takes off? 🚀
One Love,
The FXPROFESSOR 💙

Crypto Markets: “Sell in May, and Go Away” — What Does It MeanThe historical pattern known as the “Sell in May, and Go Away” seasonal divergence was popularized by the Stock Trader’s Almanac, which stated that investing in stocks represented by the Dow Jones Industrial Average from November to April and switching to fixed income for the other six months “has delivered reliable returns with reduced risk since 1950.”
What is “Sell in May, and Go Away”?
“Sell in May, and Go Away” is a well-known saying in finance. It is based on the historical underperformance of stocks over the six-month period from May to October.
According to Fidelity Investments, the divergence has been most pronounced in recent years, with the S&P 500 (SPX) gaining an average of about 2% from May to October from 1990 onwards over the next 30 years, compared with an average of about 7% from November to April.
The Halloween Indicator, 'Sell in May and Go Away': Everywhere and All the Time*, a research paper examining stock markets outside the US, found the same pattern, calling the seasonal divergence trend "surprisingly resilient."
Key Takeaways
👉 "Sell in May and go away" is a saying that refers to the historically weaker performance of financial markets from May to October compared to the other half of the year.
👉 Investors can try to capitalize on this pattern by switching to less risky assets from May to October, based on historical data.
Seasonality in investment flows may persist as a result of year-end bonuses from the financial industry and businesses, perhaps helped by the mid-April deadline for filing U.S. income tax returns.
Whatever the underlying fundamentals, the historical pattern was made more pronounced by the October stock market crashes of 1987 and 2008.
Final Points
👉 The problem with historical patterns is that they do not reliably predict the future. This is especially true for well-known historical patterns. If enough people became convinced that the “Sell in May and Walk Away” pattern would persist, it would essentially begin to disappear immediately. All the early sellers would try to sell in April and bid against each other to buy back the assets before everyone else in October.
👉 At the same time, certain considerations regarding the development of geopolitical events in the period from May to October 2025 reasonably give reason to think about the prospects of such a scenario for the next 6 months.
* The Halloween Indicator, 'Sell in May and Go Away': Everywhere and All the Time
>> Ben Jacobsen Tilburg University - TIAS School for Business and Society; Massey University
>> Cherry Yi Zhang. Nottingham University Business School China; Massey University - School of Economics and Finance.
--
Best wishes,
@PandorraResearch Team 😎

Waiting for Altseason?Hey traders and investors!
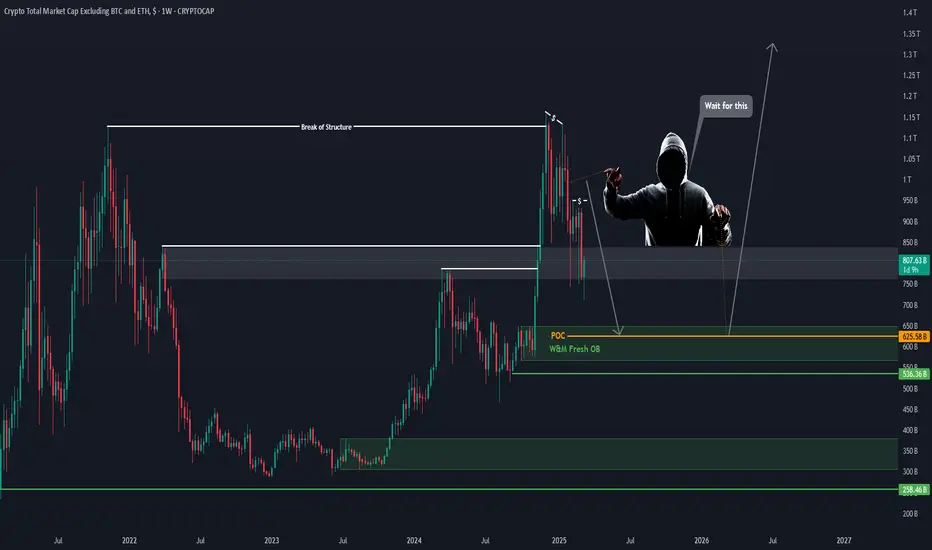
🚀 Overview of the Altcoin Market without BTC & ETH (TOTAL3)
📊 Volume Analysis of TOTAL3:
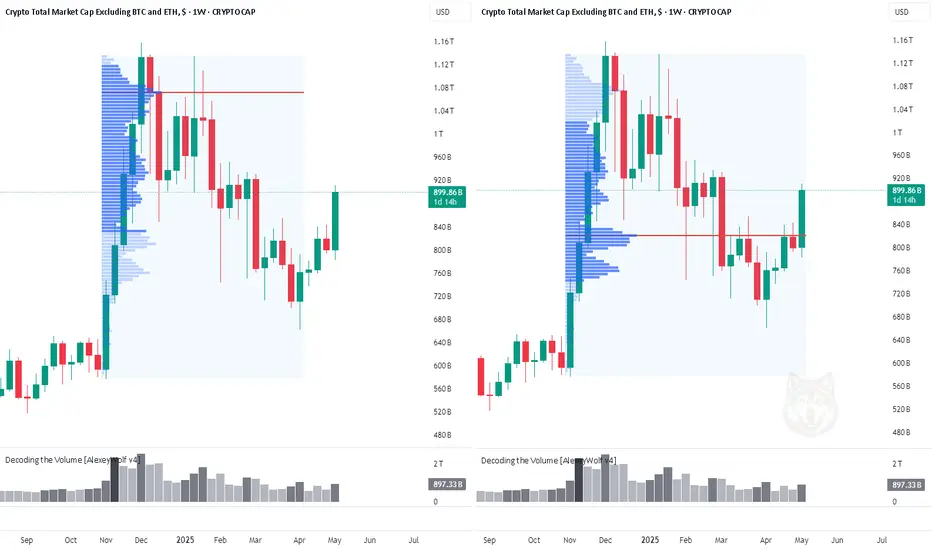
Previous POC: $1.7 trillion — the level where volumes accumulated after the last rally and correction.
Current POC: $820 billion — the level where major volumes have concentrated over the past 5 weeks. This is 10% below the current market cap.
To the Previous POC: There's still 19% potential upside to reach the previous POC.
📈 What Does It Mean?
The shift in POC downwards suggests buyers are active at $820 billion, potentially forming a new support zone and a point for continued growth.
💬 What do you think — a signal for growth or just calm before another drop? Share your thoughts in the comments!
Wishing you profitable trades!
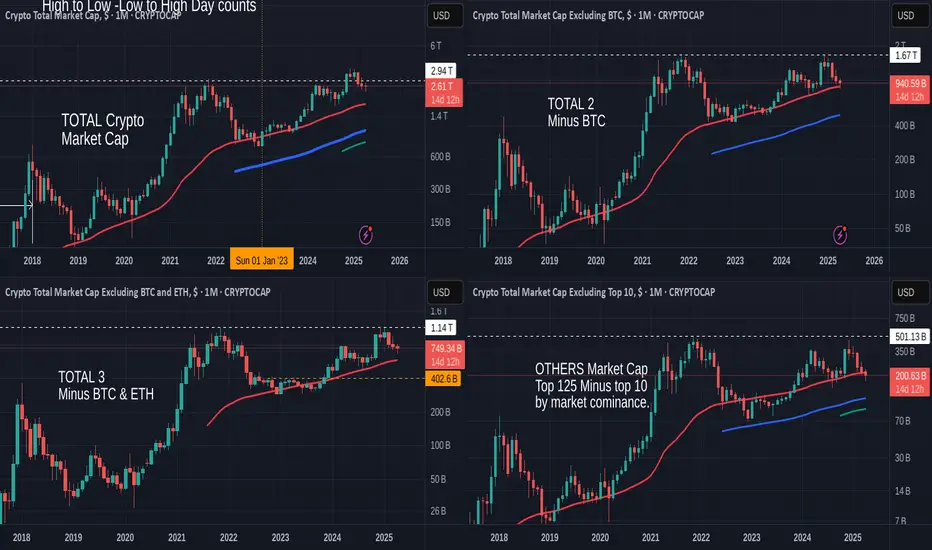
The 4 Crypto Dominance charts and 4 x TOTAL charts -ALT ?
There are some charts we should always refer to in times where we feel change may be upon us.
The chart above are
Bitcoin Dominance ( BTC.D ) - Ethereum Dominance ( ETH.D )
Others Dominace ( OTHERS.D) and USDT Dominance ( USDT.D) ( I use USDT as it remains the largest Stablecoin by market cap)
The RED line in these Daily charts is the 50 day SMA
In most of my posts recently, I have been mentioning how Strong BITCOIN is remaining while under a Lot of resistance.
But we really should not forget the rest of the market. THE ALTS
The Fabled ALT Season has been running away from us, making many wonder just what is happening.
To explain, while BTC.D remains high, it shows us that the Money remain invested in Bitcoin.
When this Dominance Drops, in the past, it has signalled the rise of investment into ALTS.
Called ROTATION, the money rotates from one asset to another.
Due to the corporate investment in Bitcoin, this rotation has not happened.
BUT IS IT ABOUT TO ?
Let look at a few things
BTC.D has been rising continuously for Months now, It is way above that 50 day SMA. PA could fall a Long way before the support of that 50 SMA is required and I notice as I type, that is is beginning to drop. It's local support may help
ETH.D has begun to Rise but we need to pay attention to this as it could get rejected once again by the 50 SMA. Ethereum has had a very hard time this cycle and has yet to show any sustained recovery
OTHERS.D - Now OTHERS is the one I watch most. Others is the Top 125 Coins MINUS the Top 10 by market cap. This shows us the Mid to Low cap Alts coins.
This is also rising right now but once again, we need to wait and see if it breaks through the 50 SMA that has rejected it many times.
The USDT.D has been dropping. This shows that USDT has been rotated into other assets. Bullish but I have to say, that as I write this, I have just noticed that this has begun to rise also though only on a 1 hour chart so maybe just Noise but it is worth watching.
So, on these dominance charts, we see a potential start to a rotation but with the likely hood of rejection of the 50 SMA, It could be the First step of a bigger move.....But with potholes in front.
The Next Logical thing to do is to look at the TOTAL market Cap charts, to compare this dominance.
This chart shows us the Daily charts for
TOTAL Crypto market Cap - TOTAL2 ( minus BTC )
TOTAL3 ( Minus BTC & ETH ) - OTHERS ( Top 125 coins Minus top 10 by Dominace )
SMA;s in chart are RED= 50, BLUE = 100, GREEN = 128, YELLOW = 200
The TOTAL is the ONLY one that has PA above all the SMA's, potentially offering Support on many fronts. It has also had the most sustained Rise. Hence the high level of Dominance in the Market.
TOTAL2 is above the 50 SMA that has rejected it previously and is about to hit into the 100. We need to see if this will be rejected or not.
Remember how the ETH.D is also facing rejection off the 50SMA - ETH is under pressure
TOTAL3 is above the 50 and appears to have broken through the 100. This is VERY Bullish for the ALT coins and could show us some potential for a continued rise as sentiment continues to turn positive. But we should watch that 200 as a potential problem
OTHERS has the largest and strongest rise and again, is above the 50 and appears to have broken through the 100. This chart has the largest gap between current PA level and the next SMA that may reject it. This is the same on the Others.D chart
SO, in conclusion, The potential for a Rotation does exist but it is going to be hard fought. There is the possibility of a HIGH volitle state for the next few days, possibly Weeks.
If you are going to rotate out of Bitcoin, Be VERY CAUTIOUS until at least the next SMA have been claimed on both sets of charts.
The nest bets are on the Mid to lower Cap ALT coins.
BUT I will say this. I cannot See BITCOIN Selling off to invest in ALTS. I also see Bitcoin continuing higher against the USD.
IF we get an ALT season now, It will be Quick, Volatile and possibly with Quick Pump and Dumps on most ALTS.
The larger ALTS will survive this better than the Meme, small caps in my opinion
For me, the ROTATION that creates an ALT Season will occur with the rotation of money from ALT to ALT and NOT BTC to ALT
What ever you do, Remain in Peace and Safety

SHITCOIN index to 11X - No crying in the CASINO!I see grown men on my timeline expressing despair, claiming that altcoins are finished!
Come on, get a grip!
Volatility is simply the cost of chasing the highest potential returns in the most speculative market the world has ever seen.
Yet, many are unwilling to wait just one more year.
They’re turning into Bitcoin maximalists, hesitant to promote their favourite coins and reluctant to introduce friends and family to their preferred ecosystems.
This is just ridiculous.
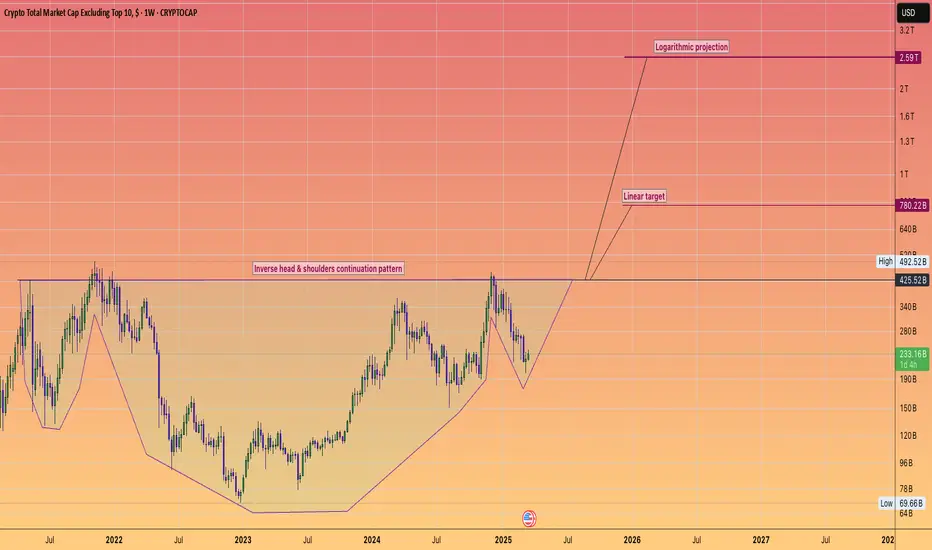
Take a look at that chart.
I mean really study it.
It shows a stunning continuation pattern of an inverse head and shoulder.
Is that bearish or bullish?
You decide.
Embrace the cost of those future returns.
The Others index going to Trillions of dollars.
Means many millionaires will be freshly minted.
From memes to mansions.
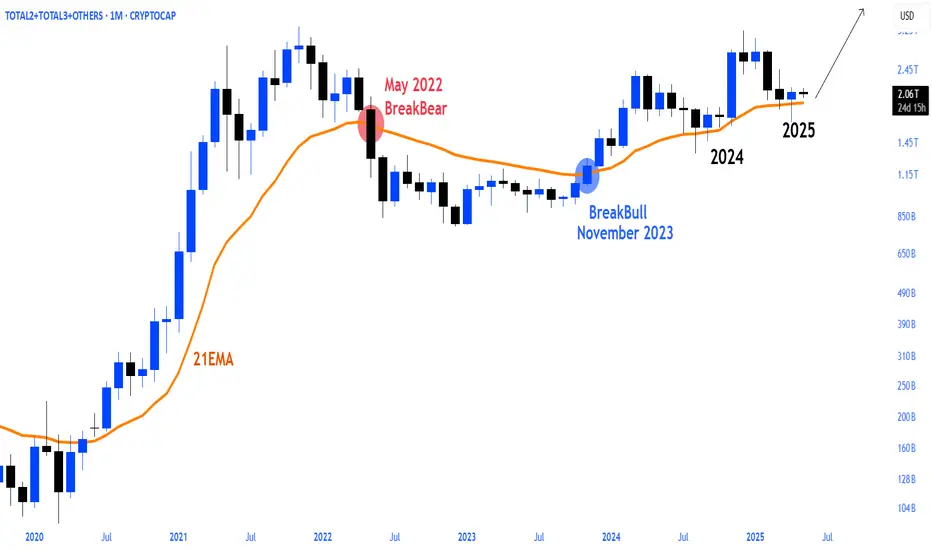
TOTAL2 + TOTAL3 + OTHERSALTSEASON is the essence of the market and is inevitable!
TOTAL2 + TOTAL3 + OTHERS 💹
Altcoin Breakout or Breakdown? Key Levels Ahead🤔📉📈 Altcoin Breakout or Breakdown? Key Levels Ahead 🚨🧠
Hey Traders! Let’s talk about what’s really going on in the altcoin scene 👀
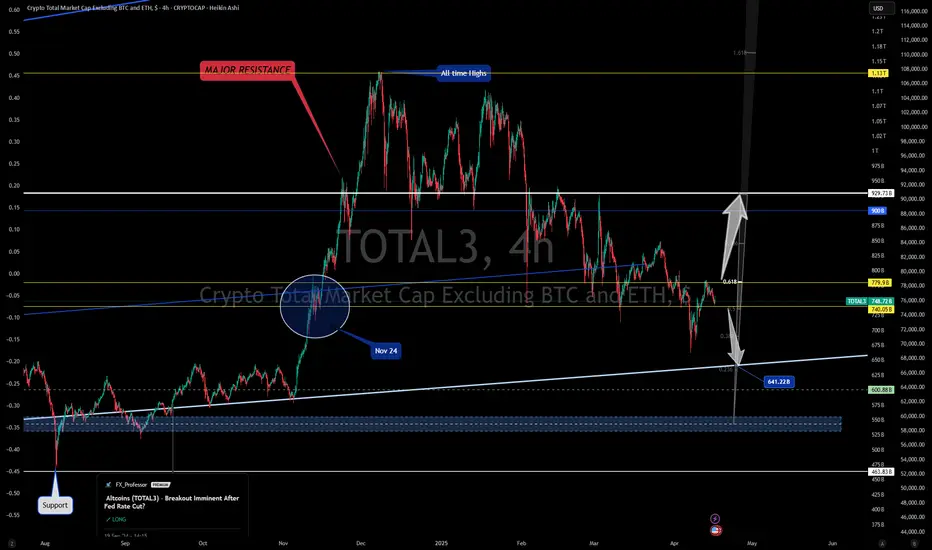
We’re still in a heavy Bitcoin-dominated market (BTC.D at 64%), but TOTAL3—the market cap for altcoins excluding BTC and ETH—is setting up for something big.
📊 We’re currently trading in a tight range between $740B support and $779B resistance—both key Fibonacci levels. Sound familiar? That’s because we were in the exact same range back on Nov 24, right before a major move! 🌀
➡️ A confirmed breakout above $780B could send TOTAL3 surging toward the next major resistance at $929B.
⬅️ But if $740B breaks, we’re eyeing a move down to $641B, where crucial trendline support comes into play.
Zooming out, altcoins are still licking their wounds from the trillion-dollar highs. The space has been wild: Trump tokens, meme coin madness, the OM token collapse—volatility is the name of the game. But are you still bullish on real, utility-driven projects?
💬 Let’s discuss:
Are you riding this altcoin wave, or sitting on the sidelines until the storm passes?
Do you have faith in 'Crypto' and can the good projects make history, or will the market suffer indefinitely from Presidents launching meme tokens, Fartcoins and Pumpfuns dominating a space with no ethics or loyalty?
🔗 Check the chart and share your thoughts below.
One Love,
The FXPROFESSOR 💙
Alt season won't be too far!Based on common indicators, "Others" chart shows an obvious trend and pattern which, overall, confirms the high possibility of a new Alt season.

Total 3, do flags point to the target area?Welcome back dearest reader,
Today i have a very interesting analysis for you, quite some valuable time was put into this.
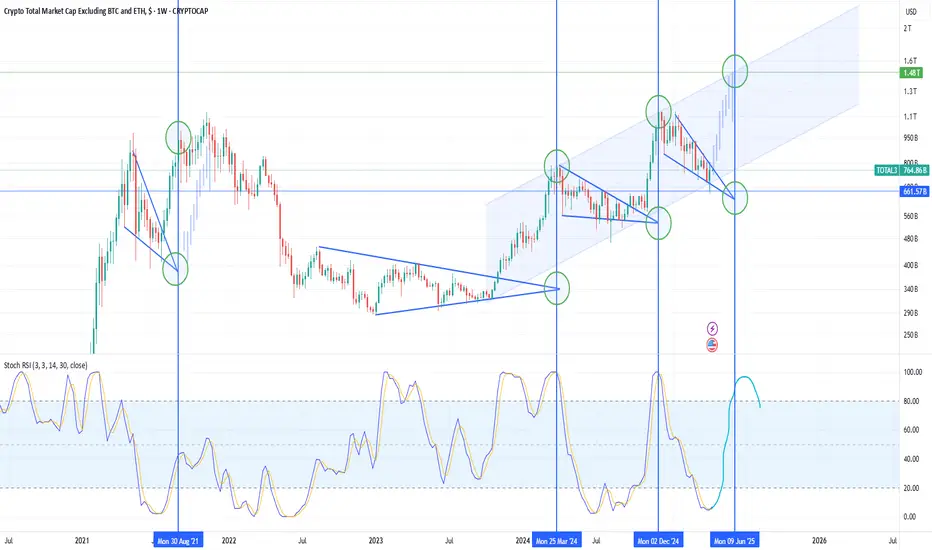
What i've noticed is the following:
-From april 2021 untill july 2021 total 3 has been trading in a bullish wedge flag, when we continue the lines on the full candle bodies the apex pointed to the top of that flag durationwise
-August 2022 till october 2023, extend the trendlines, apex march 2024, look up. Oh.
-March 2024, october 2024 --> apex december 2024, look up. Oh.
Now:
-January 2025, april/may 2025, apex june 2025, look up. Oh.
-I used the fractal from july 2021 as i think we're in this period
-Upward sloping channel from october 2022 untill now could provide insights as to what the target price might be, HH and HL
Target: 1.5T
Also check out my BTC.D idea, these would coincide perfectly
~Rustle
Is it certain this will happen? No-one has a glass ball, all we have are patterns based on past performance, this is no guarantee. But it does look good.
Altcoin Market Update – April 24, 2025As of today, the TOTAL3 Index (excluding BTC & ETH) offers key insights into the altcoin market:
⸻
Technical Overview:
• 1D: -1.54% → Minor pullback
• 1W: +6.37% → Bullish momentum
• 1M: -4.14% → Mid-term correction
• 6M: +32.94% → Strong growth
#TOTAL3 remains above $790B, a critical support. Holding this level is vital for future altcoin rally targets like $1.16T and beyond.
Bullish divergence on the TOTAL3/BTC chart hints at altcoins gaining strength over BTC.
⸻
Fundamentals:
• The global crypto market cap is $3.03T
• BTC & ETH dominate, but TOTAL3 reflects altcoin potential
⸻
Summary:
Altcoin market remains optimistic, with solid long-term signals. Keep an eye on support zones and momentum indicators for your trading strategy.

$Total3 alts about to go on their biggest run yet to $2.2T+I know everyone's been extremely down on crypto because alts have been down, but the chart looks very bullish from the lows.
As you can see, we've been consolidating in a channel and it looks like we're set to fall to the $448B - $581B region. After we find support there, we'll start the biggest leg of the cycle thus far.
I think it's very likely that we'll make it up to the $2.2T region during the next run. For context, the entire crypto market is sitting at $2.5T right now. That means alts alone should nearly equal the entire crypto market by the end of this cycle.
However, there's a possibility that the cycle can extend higher to the upper resistances as well.
Let's see how it plays out over the coming years. Lots of money to be made on the upside here.
This run will be the equivalent to getting into bitcoin early.

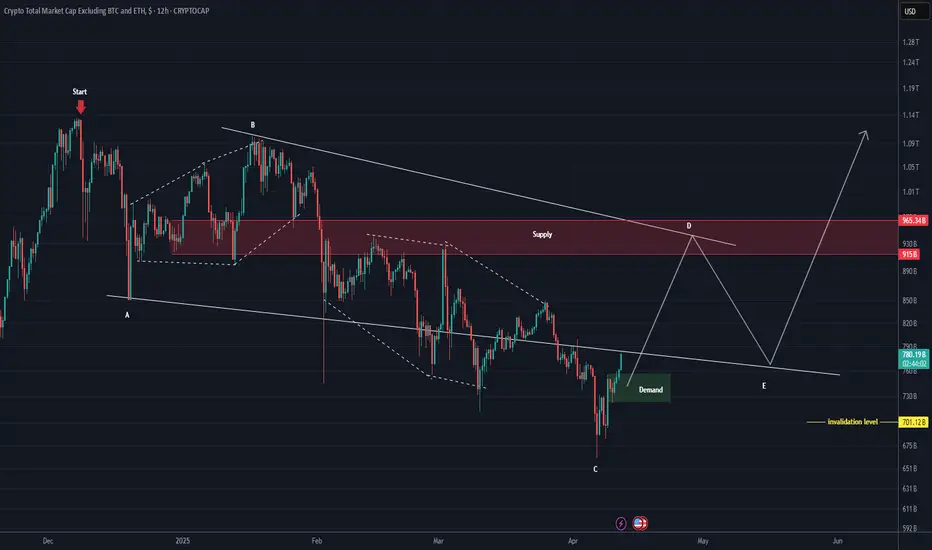
TOTAL3 Set to Explode: Altcoin Season Incoming? (12H)TOTAL3 refers to the total crypto market cap excluding Bitcoin and Ethereum.
The correction of TOTAL3 started from the point where we placed the red arrow on the chart.
It seems to have formed a triangle, and wave C now appears to be complete.
As long as the demand zone holds, it can move up toward the supply box and complete wave D.
After hitting the red box, a drop is expected for wave E — followed by the main bullish move.
Altcoins seem ready for a strong move; let’s see how it plays out.
A weekly candle close below the invalidation level will invalidate this analysis.
For risk management, please don't forget stop loss and capital management
When we reach the first target, save some profit and then change the stop to entry
Comment if you have any questions
Thank You
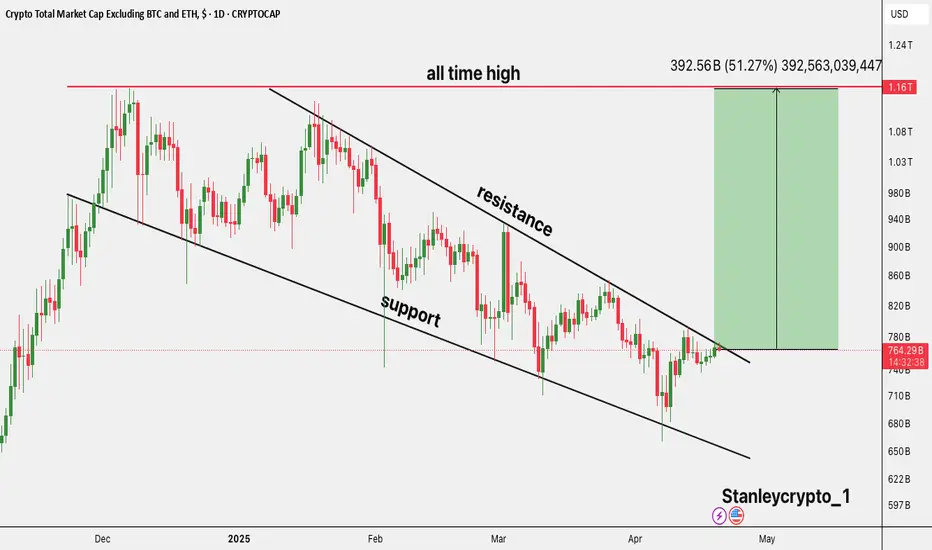
$TOTAL3 Breakout Altcoins breakout loading?
TOTAL3 (Crypto market cap excl. BTC & ETH)
breaking out of a falling wedge.
Target: $1.16T +51%
All-time high in sight. 👀
The 4 Crypto Market Cap charts and SMA's comparedTop Left TOTAL CRYPTO MARKET CAP
Top Right TOTAL 2 CRYPTO MARKET CAP ( Minus Bitcoin )
Bottom Left TOTAL 3 CRYPTO MARKET CAP ( Minus BTC and ETH )
Bottom Right OTHERS CRYPTO MARKET CAP ( Top 125 coins Minus Top 10 by dominance )
50 SMA RED
100 SMA BLUE
128 SMA GREEN
TOTAL Cap is the ONLY one that has broken above the 2021 ATH and has subsequently dropped back under but is still "touching the line" with a Wick up from the current candle.
It can also be seen how it is only the TOTAL chart that has remained easily above the 50 SMA since late 2023. The toer charts can be seen to have needed to bounce of it in 2024
The TOTAL 2 & 3 charts have very similar Candle moves and 50 SMA use.
To me, this is telling us about the Higher Cap ALT coins.
The fact that both TOTAL 2 ( Minus BTC ) and TOTAL 3 ( Minus BTC and ETH ) are similar shows me the little impact of ETH on price rise. These Charts are held up by the Higher ALT coins like SOL, INJ, SUI, XCN, HBAR to name a few. Most of these are still less than 100% gains over the last 12 months.
But what the slight Difference there is between the two charts does show us that ETH is a burden. It is dragging the TOTAL 2 chart down lwoer than the TOTAL 3 and that difference, though small on a monthly chart, is VERY SIGNIFICANT
OTHERS tells a huge story of how the Mid to Lower Caps are paying the price of Bitcoins adoption by Corporations and the fact that, as a result of these Corporations HOLDING, Bitcoin Dominance remaining High. The money that has once been used to Feed the ALT Market is static.
OTHERS is also the only chart that has fallen below its own 50SMA
That is not Bullish and very clearly shows how the Crypto Market has now matured and the absolute Tidal wave of New, worthless, useless ALT coins are failing.
This does not mean that will continue but I am inclined to believe that while we have such uncertainty in the world, the utter risk of investing in something with no use or history and security does not appeal to many.
To many extents, this could be seen as the beginning of the " Dot Com" Bubble burst for Crypto, where the best Coins / Projects are adopted and the rest, well, fall aside......
We shall see
#TOTAL3 #Analysis #Eddy#TOTAL3 #Analysis #Eddy
Crypto Total Market Cap Excluding BTC and ETH
Everything is clearly drawn and labeled.
For buy Long & Spot investment on altcoins, wait for the Total 3 index to reach its demand zone.
This is just my opinion and you should make your decision based on your style and strategy and get the necessary confirmations.
Be sure to take a look at this indicator on the monthly time frame.