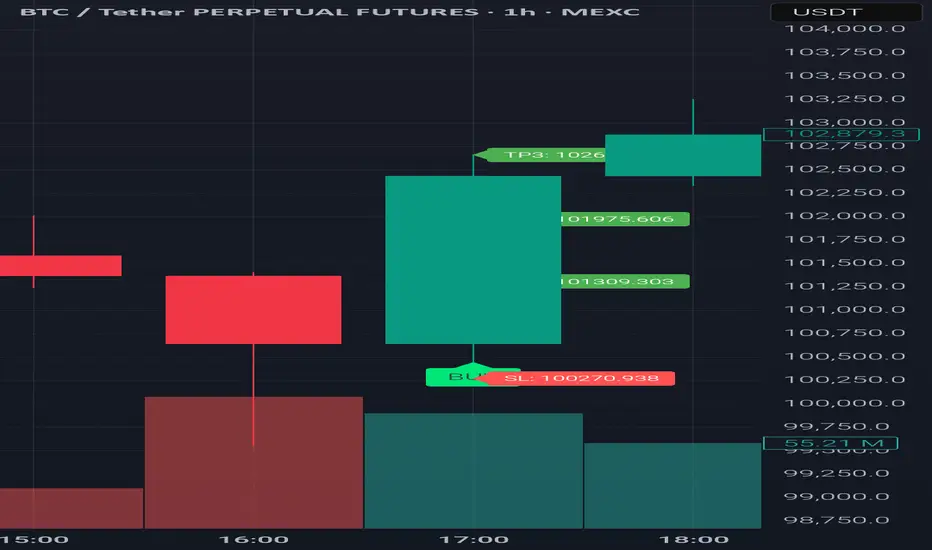
Instructions on how to potentially use the SIG[TP/SL (1H-4H-1D)]It's a HF algorithm for the 1H,4H,1D Time-Frames. Which means whenever the instrument reaches the open price, the algo might give a lot of signals and sometimes it might give plenty of reverse signals. In order to use the specific algo in the best possible way, here's a helpful guide on how to potentially use it:
1)Wait for the instrument to reach the open price.
2) ALWAYS, Follow the signals, e.g: We are at the open price. If it indicates buy signal, then open a long position. If for example 5 seconds later (again at the open price) it indicates a sell signal, then reverse the long position into a short position, and keep doing it until it gives a signal, that will be followed by a good sized candle.
3) The safest way is to close the trade when the price reaches the potential TP1.
4) Happy Trading!
*The text above is not an investment advice, and it does not guarantee any profit.
Tpsl
EURUSD LONG SETUP!! (H4 TIMEFRAME) GOOD RISK REWARD RATIOGood day traders! Welcome to another session of technical analysis . I would like to thank you for supporting me along the journey. Feel free to leave me a question, it would help a lot for further improvement!
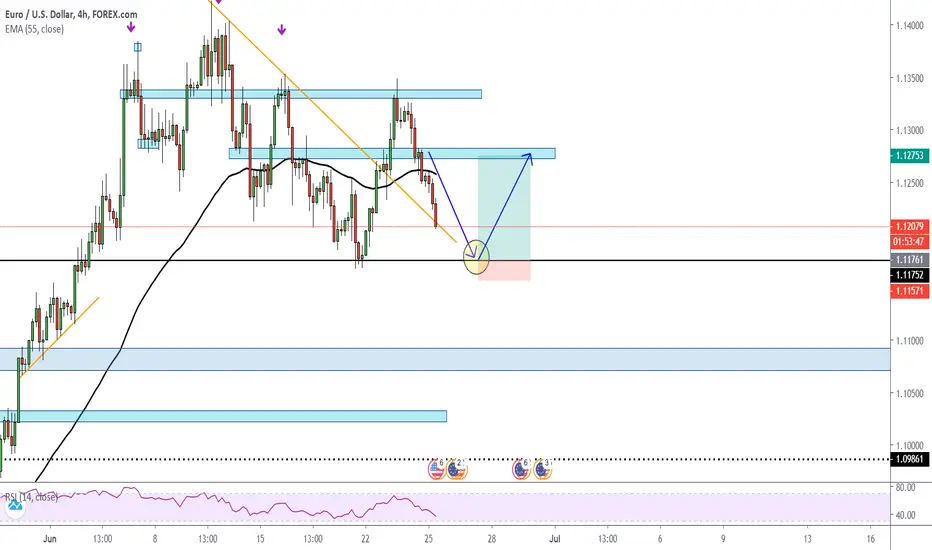
EURUSD, price has break below EMA55 as well as the support region. We will be looking for a potential entry to long at 1.11750, as it is a strong support region (based on daily and H4 timeframe). If a bullish reversal candlestick formed at the circled area, price would be push back to 1.1280.
Entry price: 1.11750 (Buy Limit)
SL: 1.1157
TP: 1.1275
Always go for a clear trading strategy and enter trade with good risk management. It's always you versus yourself instead of you versus the market.
GOLD WEEKLY ANALYSIS (SHORT OPPORTUNITY ON H4 TIMEFRAME)Good day traders, I hope you all have a great weekend ahead and plan your trading strategy week ahead!
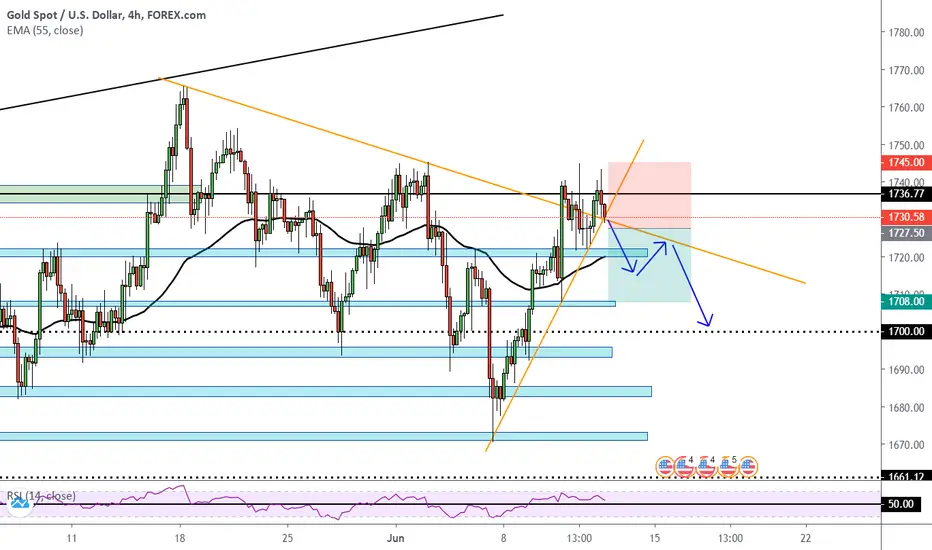
Gold has been trying to break above 1745 for the past week. However, price failed to break above 1745 and looks like ready to push to the downside.
Gold price is at critical level at the moment, which lies between minor uptrend and major downtrend as shown in the chart.
Therefore, a break of minor uptrend will trigger bearish movement to 1720. Break below 1720 would push the price to 1708 and ultimately to 1700.
Entry price: 1727.50
SL: 1745.00
TP: 1708.00
Always go for a clear trading strategy and enter trade with good risk management. It's always you versus yourself instead of you versus the market.
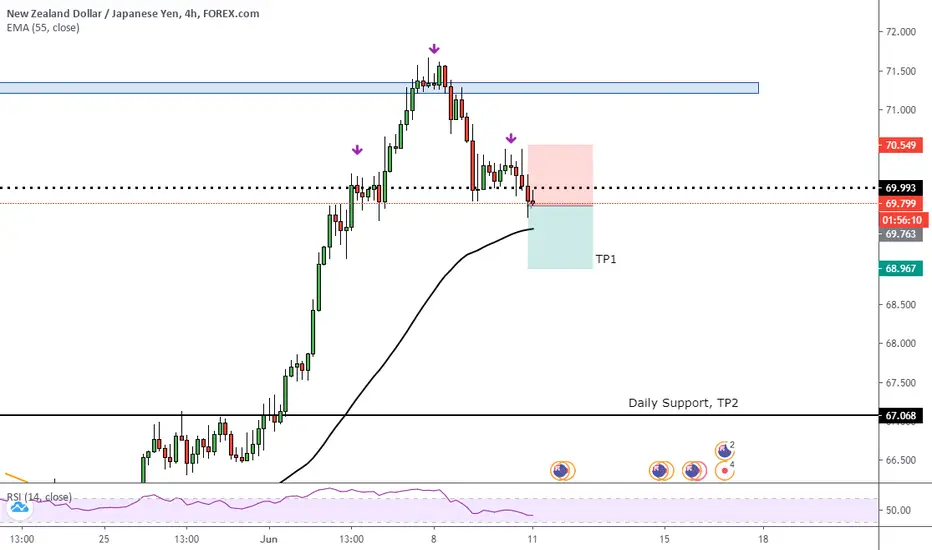
NZDJPY H4 SHORT ENTRY!H4 chart has formed a head and shoulder pattern and price has been slowly lossing bullish momentum, eyes on a CORRECTION after a strong push to the upside for the past few days. A break below EMA55 indicates a bearish signal.
Entry: 69.75
SL: 70.53
TP1: 68.97
TP2: 67.07
Hereby provide 2 TP, TP1 is short term TP while TP2 is long term TP. Please control your risk management properly.
It's not you versus the market, it's always you versus yourself.