A nice swing trade with the help of $tqqqTech as a whole has gotten a beating as of recent. However tqqq is looking for a beautiful swing bounce looking at feburary calls, what does everyone think?
TQQQ

$TQQQ Key Levels, Analysis & Targets $TQQQ Key Levels & Analysis and Targets
I’m going to buy at Target 1… double if it gets to Target 2… Double again if it gets to Target 3… Even if it just hits the first 2 It will make for a mean swing…
GL, y’all…
——————
I usually trade both ways, but lately I’ve been focusing more to the downside because of how high the market is. It makes more sense to sell puts right now, and I’m usually at Target 2.
——————
I am not your financial advisor, but I will happily answer questions and analyze to the best of my ability but ultimately the risk is on you. Check out my ideas, but also do your own due diligence.
I am not a bull. I am not a bear. I just see what I see in the charts and I don’t pay too much attention to the noise in the news.
If you want me to analyze any stock or ETF just leave me a comment and I’ll do it if I can. (If I have time)
Have fun, y’all!!
(\_/)
( •_•)
/ >🚀

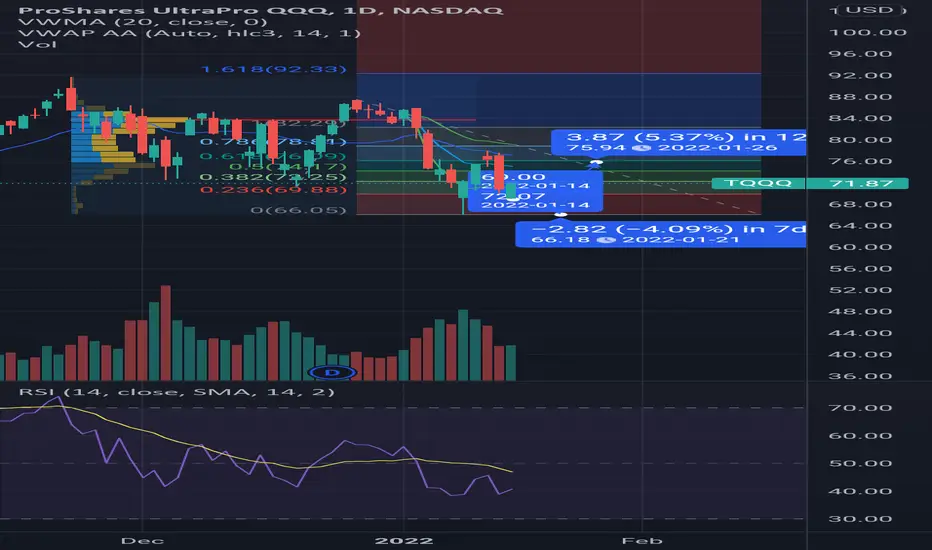
nq1! over night will shape the week (tqqq)nasdaq futures are looking pretty troubled right now, and if we see a large enough gap down and break last weeks low this could spell out further weakness in the index which could last into march
volume has refused to drop off, and if we see another spike it will probably be selling
taking out fridays high probably opens the gate to $76, and additional volatility likely will take us on another trip back to $66
somewhere ina that range is the perfect hourly oversold condition to dip buy, and touch of aavwap/vwma without follow through is usually pretty good resistance to topfish
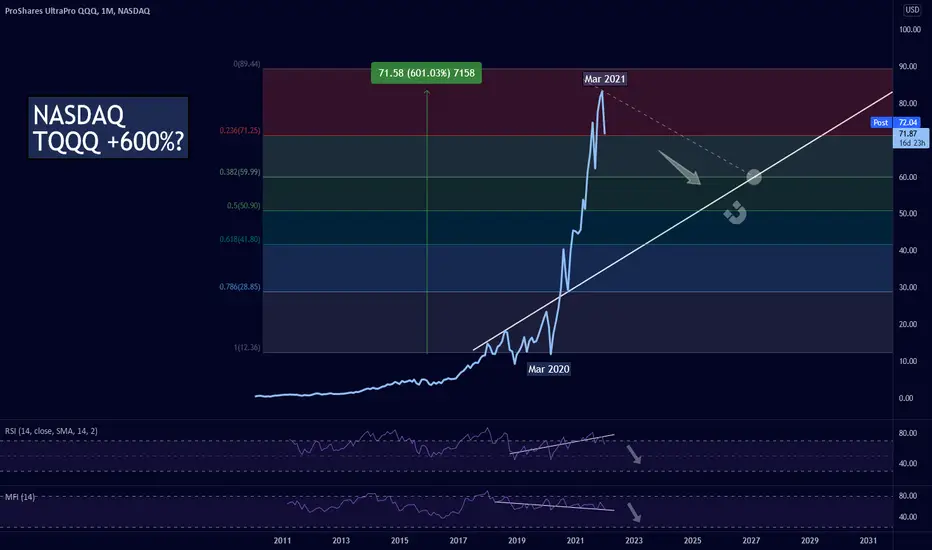
TQQQ: Major Correction Coming? What Whales See...A major correction is due and would be healthy, I would begin buying again in the 50s if it gets there. A slowing economy, tightening monetary conditions, inflation, and pandemic uncertainty will cause many to take their profits. The recent split has made all of my previous chart work useless lol... Psychologically, a lower price number will lure noobs into buying, which can fuel a potential sell-off. Apart from the fundamental noise, the technicals show that this index is way too hot. The MFI shows that money has been quietly leaving, while the RSI continued to rise. The VIX is also rising, and the fear index is changing. When we combine all of this, a short position seems logical. Let me know any thoughts or comments. Cheers.
$TQQQ Target 65 $TQQQ Target 65
I’m kind of excited about this split. I’m not sure why… it literally changes nothing. A few buy targets set for my long position and when they hit I’ll be looking to sell some puts to collect some extra premium…
I honestly haven’t traded TQQQ in a bit so I’m excited to have it back on my list…
——————
I usually trade both ways, but lately I’ve been focusing more to the downside because of how high the market is. It makes more sense to sell puts right now, and I’m usually at Target 2.
——————
I am not your financial advisor, but I will happily answer questions and analyze to the best of my ability but ultimately the risk is on you. Check out my ideas, but also do your own due diligence.
I am not a bull. I am not a bear. I just see what I see in the charts and I don’t pay too much attention to the noise in the news.
Very often you have to look at my charts from the perspective of where I’m looking to sell puts. But I also do open positions still once in a while.
If you want me to analyze any stock or ETF just leave me a comment and I’ll do it if I can.
Have fun, y’all!!
(\_/)
( •_•)
/ >🚀

NASDAQ Still BullI think we will see upward continuation here if buyers can sustain. We have a inverse head and shoulders with a low shoulder profile and if I am correct we should break up rather quickly to $158. NFA, DYOR.
TQQQ Long term bearish outlook!! Not a Financial Advice !!
I hate to say this, but to my limited understanding, TQQQ and QQQ might be long term bearish.
I think we are going to form the right shoulder. I have long positions and I pray for dear lord of stonks that we can see $165+ again so I can pull out :))
FIB Extension also confirms this.
What is your opinion? Please let me know in the comments!

TQQQ Will continue to up side or pulls back more?!! Not a Financial Advice !!
Today was a bit of relief as the market pulled up after Wednesday's bloodbath.
TQQQ Has major support in the $140 area, local support of around $145.
Strong resistance around $155 is between us and a sweet profit at 0.5 FIB level in the chart around $170.

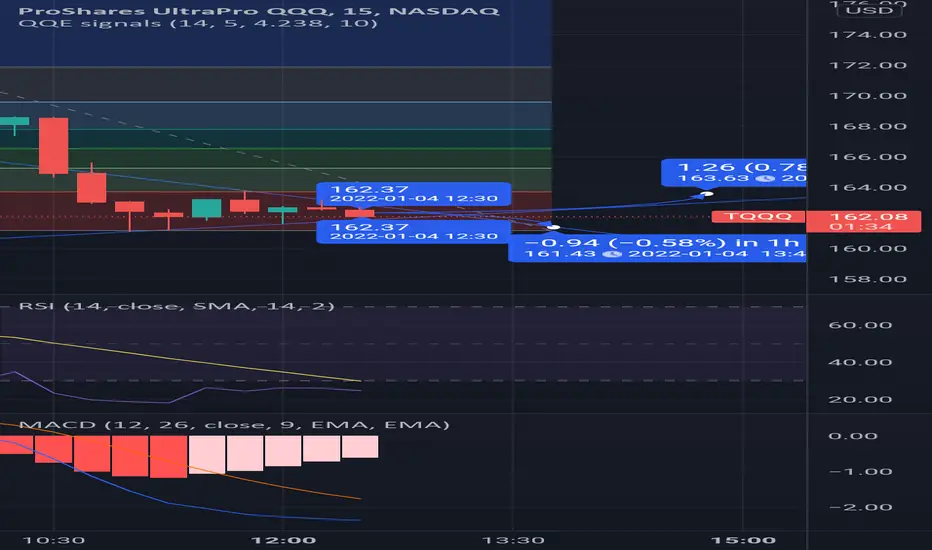
setting up the day in (tqqq)i think were in for continued volatility in nasdaq futures midweek this first week of 2022
before the week is out i expect there to be several runs down towards the lows even if we open higher or especially so
its for this reason that i am focusing on the long side as contrarian dip buys come in banking on the likelyhood that the end of the santaclaus rally results in a bounce
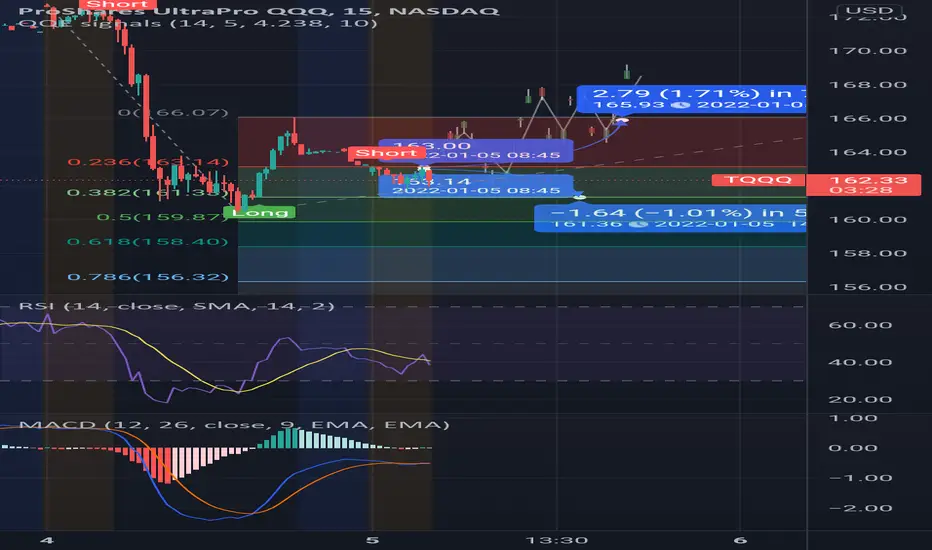
as long as we respect the 162 area the long side of things makes sense should we break down below 161.33, set a lower high and trend lower i would be interested in shorting tqqq down to the .5 of extension which is 159.87
for right now my forecasts range between 161.36 and 165.93
tightening range could break either way (tqqq)if we dont acheive reversal by breaking 163.09, setting a higher low and confirming the trend change we will certainly bearflag on the potential for daily continuation
long target 163.63
short target 161.48
nasdaq futures volatility shouldnt last (nq1!)as long as we stay above the 16200 area i think volatility shouldnt last long and most people are buyers of calls where they are cheap

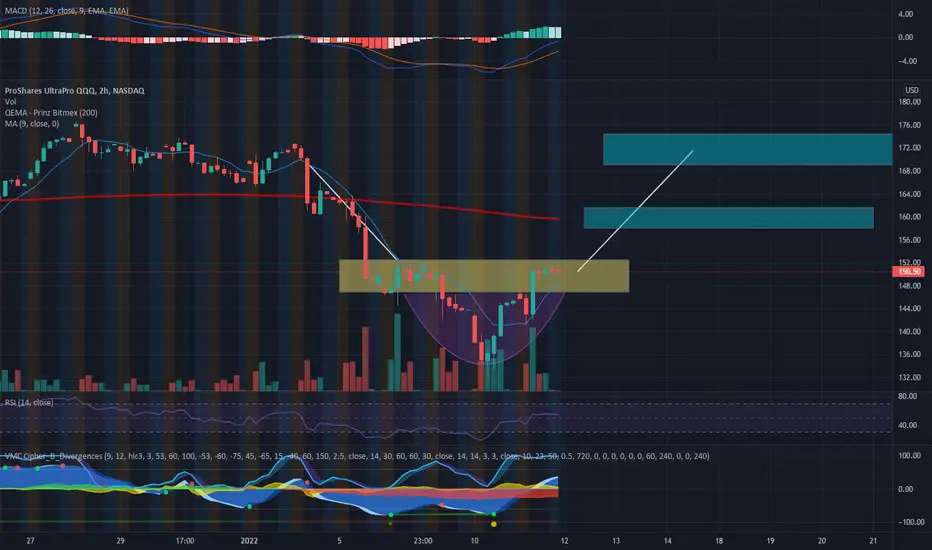
tightening range breaking bull so far (tqqq)nasdaq and tech bulls are breaking out of this mornings tightening 15 minute range
with a clear break to the upside and hourly close above rising support and sinking resistance could result in prices above 170
macd/rsi heqding toward overbought signals are above indicator

nasdaq futures (nq1!)tqqq and the like should be good to hold until some point tommorow until its above 16474

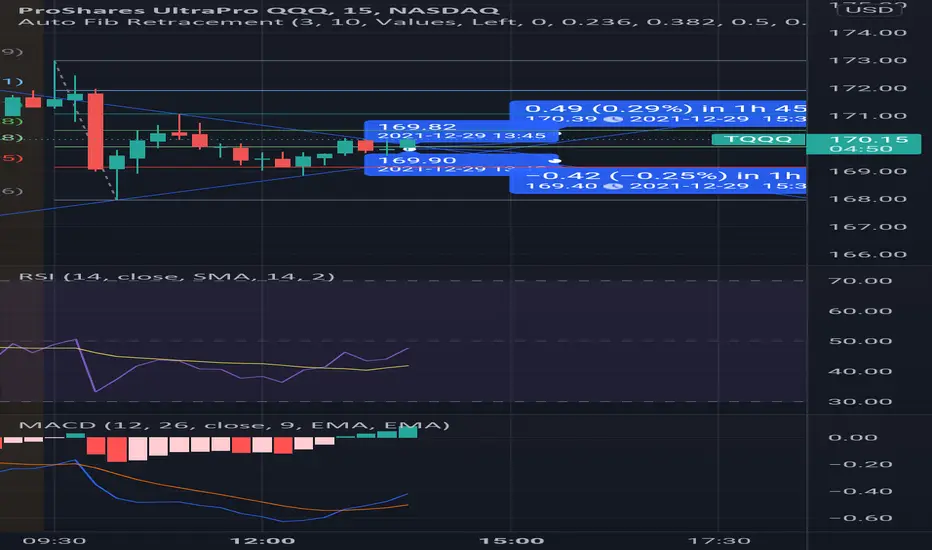
a tightening range that could break either way (tqqq)nasdaq futures have tightened in price action range since the confirmation of daily consolidation in tech
tqqq could hit 170.39 if we break bull, and might see 169.39 if we break to the downside
seems to be going up atm, well see
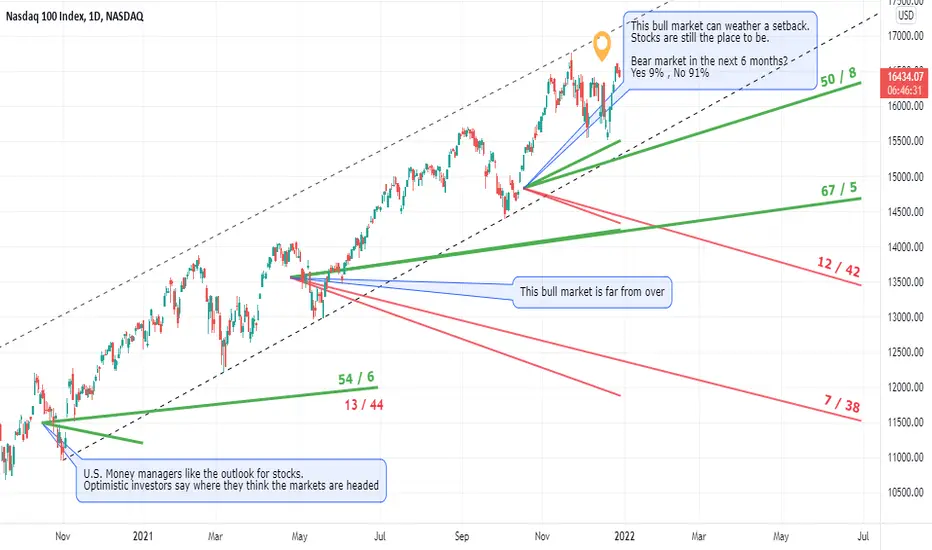
Barron's big money poll on a chartFor decades the Barron's big money poll tries to gauge the psychology of the market conducting a survey of the fund's managers, every 6 months.
I plotted on a chart the results of the last 7 surveys.
In the callouts are the titles of the results .
The line represents the bulls forecast (in green) and the bears forecasts (in red) , using their estimated targets (the end of the line is the date of the target, the coordinate is the target).
The numbers in green are: the proportion of bulls / the proportion of managers thinking that the market is undervalued .
The numbers in red are: the proportion of bears / the proportion of managers thinking that the market is over-valued .
One survey only sets a target for bulls and bears togethers, so the line is blue.
It's neither technical analysis nor fundamental analysis. It's an attempt to know what the others are thinking... ;)
It should be noted that round 5 times out of 6 the NASDAQ outperformed the bulls targets...
We might be in for another short squeeze i.e. 2019/2020This is a demonstration on how doomer bears are always too early. Everyone knows it's supposed to crash soon, so they load up on puts and the options are too imbalanced to let it fall. Instead the puts get squeezed at options expiry and the prices flies up.
Once again we just saw a huge Head & Shoulders pattern bounce near the neckline and trap bears expecting a sell off AFTER FOMC, when the sell-off obviously started BEFORE. This was the signal that a short squeeze was coming, selling too early ahead of the event.

TQQQ trend last 2 years with supports and resistancesThe main trend is upwards. These levels hold till we see a new trend

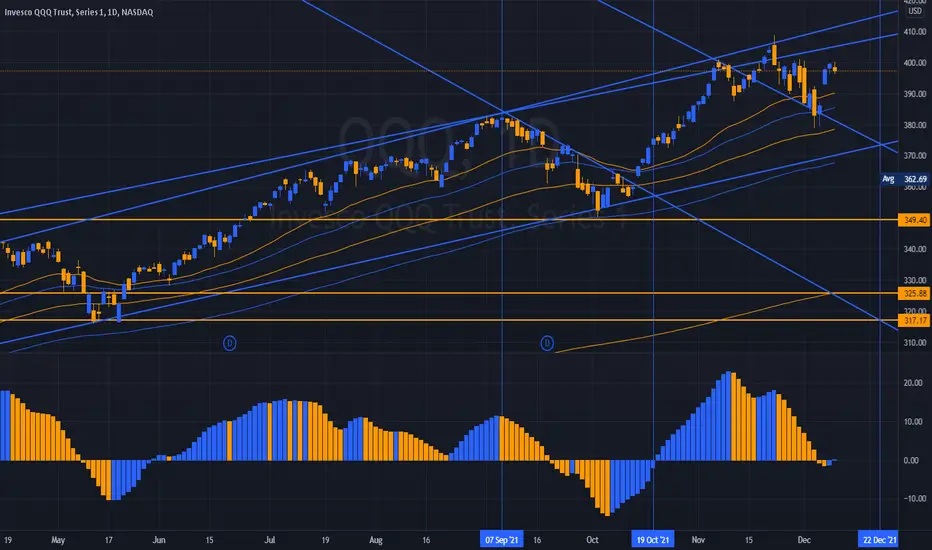
QQQ ahead of the FOMC and Dec OPEXGoing over key levels to watch heading into FOMC / Dec OPEX week. If you have any questions or comments please feel free to share. Best wishes to all you discretionary traders navigating this market.

Long now (good risk-reward)Right time to set your order.
Mine:
-Bought at 16122.91, with no leverage effect.
-Stop loss at 15865.00

QQQ - A Structural "Imbalance" / Correction is Setting Up AgainThe Divergence is very clear.
And Not a Sing of Strength, the AO makes
this clear.
Distribution after distribution...
Price itself is becoming Non-Responsive
at these Levels.
And yet chasers continue to listen to
Tom Lee and CNBC.
__________________________________
A final distortion might not be forthcoming.
We will see, as the Distribution Patterns have
been Down 5% - 7% for NQ - only to rinse and
repeat.
As we can see... they are bout done with the
charade.
___________________________________
17221 is now the Siren Song for Santa.
We're feeling more of a Tim Burton ending.
___________________________________
IF you have no expectations... you will miss
the Trade - Velocity matters.
TQQQ - Price Destruction inching its way InNo one fathoms a 4X velocity decline.
No one.
We do.
_________________________________
It might just be us...
The Roaring Silence.

Full recovery for the nasdaq (TQQQ)Big tech carrying the market. i dont expect this to stop any time soon, even if we sell off in the interim

Head and shoulders?It starts to look like a head and shoulders.
Look carefully at the levels, on the previous year each time the line was crossed, the trend tumbled toward the support.
By the way I am resolutely bearish since friday (due to my technical indicators, which were the subject of my last post).
