09.09.25 Morning ForecastPairs on Watch -
FX:EURUSD
FX:EURCAD
FX:NZDCAD
FX:NZDUSD
A short overview of the instruments I am looking at for today, multi-timeframe analysis down to what I will be looking at for an entry. Enjoy!
Trade!

08.09.25 Morning ForecastPairs on Watch -
FX:EURUSD
FX:GBPUSD
FX:EURCAD
FX:AUDJPY
A short overview of the instruments I am looking at for today, multi-timeframe analysis down to what I will be looking at for an entry. Enjoy!

BTCUSD is moving exponential and here's the setupBecause BTCUSD couldn't reach the L-MLH of the red fork twice, we have 2 HAGOPIANs cooking. That means, that price will move further in the opposite direction than from where price came.
Price came from the Centerline, and that's where the high of the today's Candle peeked through. I expect more upside movement.
As for a trade, I want to see price holding above the centerline. From there, PTG1 is the U-MLH and beyond that it's the white Centerline again (...which looks like it's going to the Moon, like XRPUSD).
Of course, we seldom can eat the whole Cake. So we manage it and take partial profits on the way up.
🙏😊✨ Thanks for following and boosting folks. 🙏😊✨

Will AUD/JPY Break 97.5? Bullish Thief Plan & Fundamental Edge🔑 AUD/JPY “Aussie vs Yen” | Thief Market Plan 🎭 (Swing/Day Trade)
📌 Plan Overview
Bias: Bullish (Pending Order Plan)
Entry Idea: Breakout above 97.500 ⚡ Moving Average Dynamic Line
Thief Layer Strategy:
Multiple Buy Limit Orders → 96.500 | 97.000 | 97.500 | 97.700
You can increase layer entries based on your own plan.
✅ Always confirm with breakout before entry.
🔔 Set an alert in TradingView to catch breakout moves easily.
Stop Loss (SL): Thief SL suggested near 96.300 (after breakout level).
Note: This is not a fixed rule—adjust SL according to your own risk management.
Take Profit (TP): Resistance barricade at 99.000 (overbought + liquidity trap zone).
Note: Escape with profits before the police barricade! 🎯
🧭 Why This Plan? (Thief OG Strategy + Market Analysis)
📊 AUD/JPY Key Data (08 Sept 2025)
Prev. Close: 97.35
Day’s Range: 96.82 – 97.35
Change: -0.44 (-0.45%)
😰 Fear & Greed Sentiment
CNN Fear & Greed Index → 51.5 (Neutral)
Market momentum balanced, mild caution amid geopolitical risk.
🏛 Retail vs Institutional Sentiment
🧑💼 Retail Traders → Bullish 60% | Bearish 40%
Retail leaning bullish thanks to AUD resilience.
🏦 Institutional Outlook → Bullish bias (AUD strength vs BOJ dovishness)
Concerns: Japanese political uncertainty (PM resignation).
Macro Score: 7/10 in favor of AUD.
🌍 Fundamental & Macro Drivers
✅ AUD Strengths
🔥 Inflation hot (July CPI +2.8% y/y)
🏠 Household spending growth (+5.1% y/y)
🏦 RBA keeping policy steady (hawkish tilt)
❌ JPY Weaknesses
🕊️ BOJ dovish stance continues
🏛️ Political instability (PM resignation)
🚗 US auto tariff cuts pressuring JPY
🐂🐻 Market Outlook
Bullish (Long) Score: 70%
Bearish (Short) Score: 30%
Summary: AUD/JPY shows bullish structure above 97.00, but caution on overbought signals after 10-day rally.
⚠️ Risks to Watch
US NFP (Sept 12) → May drive USD/JPY flows.
Overbought daily RSI signals.
Geopolitical volatility (China & Ukraine).
🎯 Bottom Line
AUD/JPY maintains a bullish bias 🟢 with fundamentals, sentiment, and Thief layering strategy supporting higher targets.
📌 Monitor 97.45–97.50 breakout zone → potential continuation toward 99.000.
🔗 Related Pairs to Watch
FX:USDJPY | OANDA:AUDUSD | OANDA:EURJPY | OANDA:GBPJPY
✨ “If you find value in my analysis, a 👍 and 🚀 boost is much appreciated — it helps me share more setups with the community!”
#audjpy #forex #swingtrade #daytrade #fundamentalanalysis #sentiment #thieftrader #forexanalysis #macromarket #currencytrading

Gold price analysis on September 8✍️ Gold Analysis
Gold price is currently reacting around the 3600 round mark. The main strategy is still to wait for corrections to the support zone to find BUY opportunities. Up to now, there is no signal from the daily candle showing that the selling force wants to take profits strongly, so the priority trend is still to buy when the price holds above important levels. In particular, breaking the support of 3514 will be a signal to further strengthen the uptrend.
📌 Important price zones
BUY: when the price reacts at the support zone of 3575–3560.
Upward target: 3600 in the immediate future, 3650 further.
SELL: when the price breaks the trendline and support of 3360.
Downward target: 3514.

XRPUSD is following our projectionThe red pressure line is broken.
After dabbling with the L-MLH, price decided to jump back into the fork, projecting a potential huge move ahead.
But not so fast!
The slope of the white fork is super steep.
In such situations I like to throw a Modified-Shiff-Fork, or a Shiff-Fork on the chart too. This gives me often more realistic profit targets.
The trade could be managed by using the light-grey fork's centerline as PTG1 and the rest of the position aims for the white mooning centerline §8-)
A second steak of the position could be loaded, after the yellow CIB-Line is broken. I like to wait for a test of it after the crack and jump-above. It's the same like a test/retest of a Medianline-Parallel if price broke out of it.
Let's have fun here §8-)

Crude Oil - Eye twinkle to go long?The Test/Retest was expected, and it was not that clean as it is mostly. Usually I don't want to see price trading back into the fork again.
This time, price managed to jump out of it again and opened above the U-MLH. If it can close outside the fork too, then this would be a good hint for me to load the boat.
The 80% target is the yellow Centerline, or even higher, since the drillers moan about a too low price (Fundamental Fact).
Let's see if we find some petro dollars.

WMT - Our profit target is near, secure some profitsWhen I posted the long trade on Aug. 29th, I did not expect it to run that quick.
Who of you guys or gals pushed it that quick? §8-)
However, I will trail my stop below the last red candles low.
We are not here to win a contest, so we secure some profit, just in case price drops before the Centerline is reached.
Don't forget to follow me and profit from further trades and educational content.

MRK is showing some breakout signsThe white fork is pointing slightly to the upside.
CIB is broken and signals a change in behavior. The pullback to it was very nice - a Eye twinkle? §8-)
Then price opened the door to the upside by peeking through the resistance of the consolidation, asking: "Anybody here to buy me?"...silence...so far.
OK, let's be patient and wait for another sign or hint.
Until the, stalking hat on, as my mentor Shane always said.
--> NO FOMO IN THIS CLASS! <--

Exchange-Traded Funds (ETFs) & Index TradingPart I: Understanding Exchange-Traded Funds (ETFs)
1. What are ETFs?
An Exchange-Traded Fund (ETF) is an investment vehicle that holds a basket of assets—such as stocks, bonds, commodities, or currencies—and trades on stock exchanges like a single stock.
Structure: ETFs are designed to track the performance of an underlying index, sector, commodity, or strategy.
Trading: Unlike mutual funds (which are priced once a day), ETFs trade continuously throughout the trading day, with prices fluctuating based on supply and demand.
Flexibility: ETFs can be bought and sold just like stocks, enabling short-selling, margin trading, and intraday strategies.
In essence, ETFs combine the diversification of mutual funds with the flexibility of stocks.
2. History and Evolution of ETFs
The first ETF, SPDR S&P 500 ETF Trust (SPY), was launched in 1993 in the United States. It aimed to track the S&P 500 Index, giving investors exposure to the 500 largest U.S. companies in a single instrument.
Since then, the ETF industry has exploded globally:
1990s: Launch of broad-market ETFs (SPY, QQQ).
2000s: Expansion into sector-based and international ETFs.
2010s: Rise of smart beta and thematic ETFs (e.g., clean energy, robotics, AI).
2020s: Growth in actively managed ETFs, ESG-focused ETFs, and crypto ETFs (like Bitcoin futures ETFs).
Today, ETFs account for trillions of dollars in global assets under management (AUM), making them one of the fastest-growing investment products.
3. Types of ETFs
ETFs come in different forms to suit various investor needs:
Equity ETFs – Track stock indices like S&P 500, Nifty 50, Nasdaq-100.
Bond ETFs – Provide exposure to government, corporate, or municipal bonds.
Commodity ETFs – Track commodities like gold, silver, or oil.
Currency ETFs – Track currency movements (e.g., U.S. Dollar Index ETF).
Sector & Industry ETFs – Focus on sectors like technology, healthcare, or banking.
International & Regional ETFs – Give exposure to markets like China, Europe, or emerging markets.
Inverse & Leveraged ETFs – Provide magnified or opposite returns of an index (used for short-term trading).
Thematic ETFs – Target specific investment themes (renewable energy, AI, blockchain).
Actively Managed ETFs – Managed by fund managers who actively pick securities.
4. How ETFs Work (Mechanics)
ETFs use a creation and redemption mechanism to keep their market price close to the net asset value (NAV).
Authorized Participants (APs): Large institutions that create or redeem ETF shares.
Creation: APs deliver a basket of securities to the ETF provider in exchange for new ETF shares.
Redemption: APs return ETF shares and receive the underlying securities.
This arbitrage mechanism ensures that ETF prices remain close to the value of their underlying assets.
5. Advantages of ETFs
Diversification – Exposure to hundreds of securities in one trade.
Liquidity – Trade throughout the day on exchanges.
Cost Efficiency – Lower expense ratios compared to mutual funds.
Transparency – Daily disclosure of holdings.
Flexibility – Options, margin trading, and short-selling available.
Tax Efficiency – Creation/redemption process reduces taxable distributions.
6. Disadvantages of ETFs
Trading Costs – Brokerage fees and bid-ask spreads can add up.
Tracking Error – ETFs may not perfectly track their underlying index.
Overtrading Risk – Intraday liquidity may encourage speculative behavior.
Leverage & Inverse ETFs Risks – Can lead to significant losses if misunderstood.
Concentration in Popular Sectors – Certain thematic ETFs may be too niche or volatile.
Part II: Index Trading
1. What is an Index?
An index is a statistical measure representing the performance of a group of securities. Examples:
S&P 500 (USA): 500 largest U.S. companies.
Nifty 50 (India): 50 largest companies listed on NSE.
Dow Jones Industrial Average: 30 U.S. blue-chip companies.
Indices serve as benchmarks to measure market or sector performance.
2. What is Index Trading?
Index trading refers to trading financial products based on stock market indices rather than individual stocks.
Investors trade:
Index Futures – Contracts based on future value of an index.
Index Options – Options contracts linked to indices.
ETFs & Index Funds – Indirect way to trade indices.
CFDs (Contracts for Difference): Widely used in global markets.
3. Why Trade Indices?
Diversification – Exposure to entire markets or sectors.
Hedging – Protect portfolios from market downturns.
Speculation – Bet on broad market movements.
Benchmarking – Compare portfolio performance against indices.
4. Popular Global Indices
USA: S&P 500, Nasdaq-100, Dow Jones.
India: Nifty 50, Sensex, Bank Nifty.
Europe: FTSE 100 (UK), DAX 40 (Germany), CAC 40 (France).
Asia: Nikkei 225 (Japan), Hang Seng (Hong Kong), Shanghai Composite (China).
5. Strategies in Index Trading
Buy-and-Hold Strategy: Long-term investment in index ETFs.
Swing Trading: Trading short-to-medium-term index price movements.
Hedging: Using index futures to hedge stock portfolios.
Arbitrage: Exploiting mispricing between futures, ETFs, and underlying stocks.
Sector Rotation: Moving investments between indices/sectors depending on the economic cycle.
Options Strategies: Using index options for spreads, straddles, or covered calls.
Part III: ETFs vs. Index Funds vs. Index Trading
ETFs – Trade on exchanges, intraday pricing, lower costs.
Index Funds – Mutual funds tracking indices, priced once daily.
Index Trading (Futures/Options) – Derivatives-based, high leverage, short-term focus.
Example:
Long-term investor → Index Fund or ETF.
Active trader → Index futures, options, or leveraged ETFs.
Part IV: Risks in ETFs & Index Trading
Market Risk – Both ETFs and indices reflect market movements.
Liquidity Risk – Low-volume ETFs may have wide spreads.
Tracking Error – ETFs may deviate from index returns.
Leverage Risk – Amplified losses in leveraged ETFs/futures.
Currency Risk – International ETFs affected by forex fluctuations.
Concentration Risk – Indices may be dominated by a few large companies (e.g., FAANG in S&P 500).
Part V: ETFs & Index Trading in India
India has seen tremendous growth in ETFs and index trading:
Popular ETFs: Nippon India ETF Nifty BeES, SBI ETF Nifty Bank, ICICI Prudential Nifty Next 50 ETF.
Gold ETFs: Widely used as an alternative to physical gold.
Sector ETFs: Banking, IT, PSU ETFs gaining traction.
Index Futures/Options: Nifty 50 and Bank Nifty derivatives dominate NSE trading volumes.
Government and institutional investors (like EPFO) also allocate large sums to ETFs, boosting the industry further.
Part VI: Future of ETFs & Index Trading
Rise of Thematic & ESG ETFs – Growth in socially responsible investing.
Active ETFs – Managers offering active strategies via ETFs.
Crypto ETFs – Bitcoin and Ethereum ETFs expanding.
Tokenization & Blockchain ETFs – Future of transparent, decentralized ETF structures.
AI-driven Index Construction – Smart beta indices built using machine learning.
Conclusion
Exchange-Traded Funds (ETFs) and Index Trading have reshaped the way investors approach financial markets. They offer simplicity, diversification, transparency, and cost-effectiveness, making them ideal for both beginners and professionals.
ETFs provide access to a wide range of assets, from equities and bonds to commodities and currencies.
Index trading allows traders to speculate, hedge, or invest in entire markets rather than individual stocks.
Together, they represent the future of investing: efficient, scalable, and adaptable to changing global market trends.

ETHUSD – Short Setup at 4310 | Bearish Opportunity Ethereum is showing signs of rejection near 4310, a key resistance zone where price action has stalled. Momentum indicators suggest a short-term pullback, offering a clean intraday short setup.
🔻 Trade Idea: SELL ETHUSD @ 4310
- Stop Loss: 4328 (above resistance wick)
- Take Profit: 4290 (near support zone)
- Risk/Reward: ~1.1:1
📉 Technical Confluence:
- Bearish candle formation on 15M and 1H
- RSI divergence + MACD histogram fading
- Price rejected from upper channel boundary
- Volume declining on bullish attempts
💬 Narrative:
ETHUSD failed to break above 4310, signaling short-term bearish pressure. If price loses 4300, expect momentum toward 4290. Setup remains valid unless bulls reclaim 4328+ with strength.

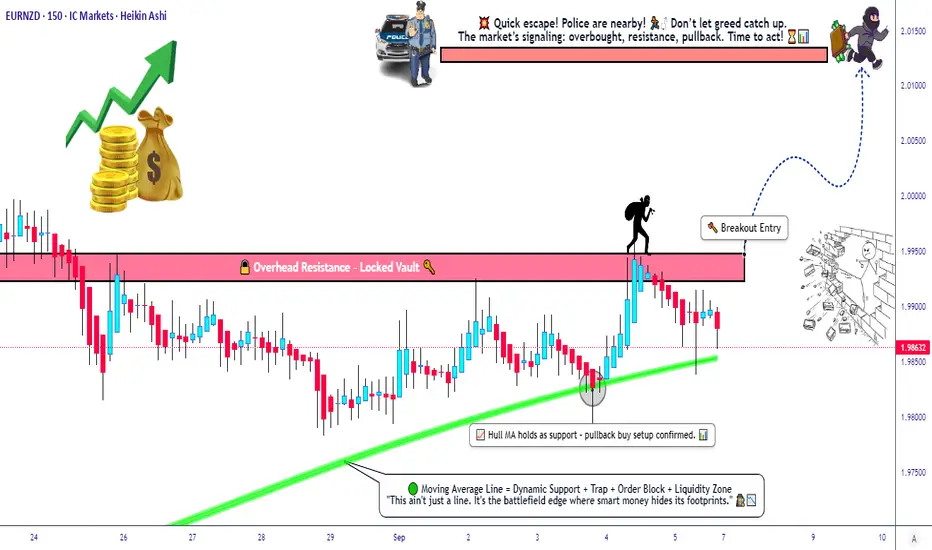
EURNZD: Ready To Loot 200+ Pips? Breakout Plan Active💰 EURNZD "Euro vs Kiwi" Forex Bank MONEY LOOTING PLAN (Swing/Day Trade) 🚀
📌 Trading Plan (Thief Layer Strategy)
Bias: Bullish (Pending Order Plan) 🟢
Breakout Entry: Watch for ⚡ breakout above 2.04500 (major resistance).
Layered Limit Orders (Thief Style):
Buy Limit @ 1.98800
Buy Limit @ 1.99000
Buy Limit @ 1.99200
Buy Limit @ 1.99500
(You can add more layers depending on your strategy.)
Stop Loss (Thief SL): @ 1.98500 📍
(Adjust SL as per your risk tolerance — this is not financial advice.)
Target: Strong resistance + overbought zone near 2.01300 🎯
(Take profit when satisfied — manage risk, lock profits, and don’t get trapped.)
⚠️ Tip: Set an alert on TradingView at the breakout level to catch moves without stress.
📊 EUR/NZD Market Snapshot (Sept 7, 2025)
Daily Change: +0.01% (Flat, stable vibes)
Current Momentum: Building energy for potential breakout 💥
🧑🤝🧑 Sentiment Outlook
Retail Traders: 61% Bearish 🐻 | 39% Bullish 🐂
→ Retail leaning short, expecting NZD strength.
Institutions: Mildly Bullish 🐂
→ Favoring EUR upside from Eurozone recovery flows.
Overall Mood: Neutral 😐 → Balance of caution + opportunity.
😨📈 Fear & Greed Index
Score: 49 ⚖️ (Neutral Zone)
→ Market is calm, neither overheated nor fearful.
🔍 Fundamental & Macro Overview
EUR Fundamentals: 7/10 💪
→ GDP +0.9%, inflation cooling (2.0%), ECB easing support.
NZD Fundamentals: 6/10 🛡️
→ GDP +1.2%, RBNZ steady, exports steady but China slowdown a drag.
Macro Score: Bullish Tilt 🟢
→ Interest rate gap favors EUR; Eurozone current account +3.4%.
🎯 Thief Strategy Reasoning — WHY THIS PLAN?
Technical: Breakout confirmation above 2.04500 + layered entries (Thief style).
Fundamental: EUR showing resilience while NZD faces export headwinds.
Macro: Eurozone edges ahead with positive balance & easing monetary stance.
Sentiment: Retail shorts fuel potential squeeze higher.
Fear & Greed: Balanced — supports controlled upside moves.
📈 Related Pairs to Watch
Correlated Assets Monitoring:
OANDA:EURAUD (Euro vs Australian Dollar)
OANDA:NZDCAD (New Zealand Dollar vs Canadian Dollar)
FX:EURUSD (Euro vs US Dollar)
OANDA:AUDNZD (Australian Dollar vs New Zealand Dollar)
Why watch these? They provide confirmation signals for EUR strength and NZD weakness across multiple fronts .
✨ “If you find value in my analysis, a 👍 and 🚀 boost is much appreciated — it helps me share more setups with the community!”
#EURNZD #Forex #SwingTrade #DayTrading #BreakoutStrategy #ThiefTrader #LayerStrategy #ForexCommunity #TradingViewIdea #FXSetups
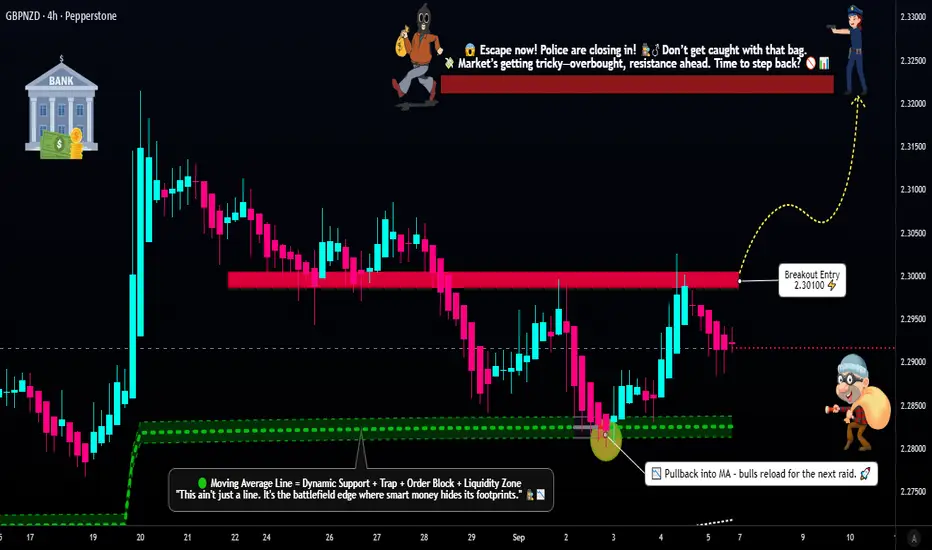
GBP/NZD Bullish Trap or Treasure? Watch Breakout!🔥 GBP/NZD “POUND vs KIWI” – Bank Money Robbery Plan 🎭 (Swing/Scalping)
📌 Trade Plan (Thief Strategy Style)
Bias: Bullish 🐂 (Pending Order Plan – watching resistance breakout)
Breakout Entry: ⚡ Above 2.30100 → Set alarm to catch breakout in TradingView alerts.
Layered Entries (Thief Style): Multiple buy limits after breakout confirmation
2.29000 | 2.29300 | 2.29600 | 2.30000 (you can adjust/increase layers as per your own plan).
Stop Loss (Thief SL): @ 2.28400 🛑 (adjust based on personal risk).
Target 🎯: 2.32300 → Police barricade resistance / overbought zone / liquidity trap.
⚠️ Note: Dear Ladies & Gentlemen (Thief OG’s) – TP is your own choice 🚪💰. Take the money when YOU want, at your own risk.
📊 GBP/NZD Market Sentiment Report (Updated: 07 Sept 2025)
Day’s Range: 2.2878 – 2.3017
52-Week Range: 2.0996 – 2.3365
Open: 2.2978 | Previous Close: 2.2980
😰 Fear & Greed Index (Market Sentiment)
Score: 53/100 (Neutral 😐)
Extreme Fear: 14% | Fear: 23% | Neutral: 15% | Greed: 46% | Extreme Greed: 2%
Indicators: Volatility, options activity & safe-haven demand suggest balanced sentiment.
🏦 Fundamental & Macro Score
Interest Rates:
🇬🇧 Bank of England: 4.0%
🇳🇿 Reserve Bank of NZ: 3.0%
1-Year Change: +7.86% 🟢 (GBP strength).
Key Drivers:
UK housing slowdown (mortgage approvals ↑ but construction contracted).
NZ building consents +5.4% in July → NZD resilience.
🎯 Retail & Institutional Sentiment
Retail Traders: Mixed positioning (both bullish & bearish flows).
Institutional Outlook: Cautious → GBP volatility + NZD’s China exposure.
🐂📉 Market Outlook (Medium-Term)
Overall Score: 55% Bullish 🟢
Support Factors: GBP rate advantage.
Risks: UK macro weakness + NZD strength in commodities.
💡 Why This Thief Plan?
✔ Breakout entry with layered buy limits = precision scaling 🎯
✔ Macro favors GBP over NZD (interest rate edge).
✔ Sentiment = neutral (room for breakout move).
✔ Liquidity pockets above → perfect robbery escape zone 🚔💨
🔎 Related FX Pairs to Watch
FX:GBPUSD | OANDA:GBPAUD | OANDA:GBPCAD | OANDA:EURNZD | OANDA:AUDNZD
✨ “If you find value in my analysis, a 👍 and 🚀 boost is much appreciated — it helps me share more setups with the community!”
#GBPNZD #Forex #SwingTrading #Scalping #PriceAction #ThiefStrategy #SmartMoney #BreakoutTrading #ForexCommunity #GBP #NZD
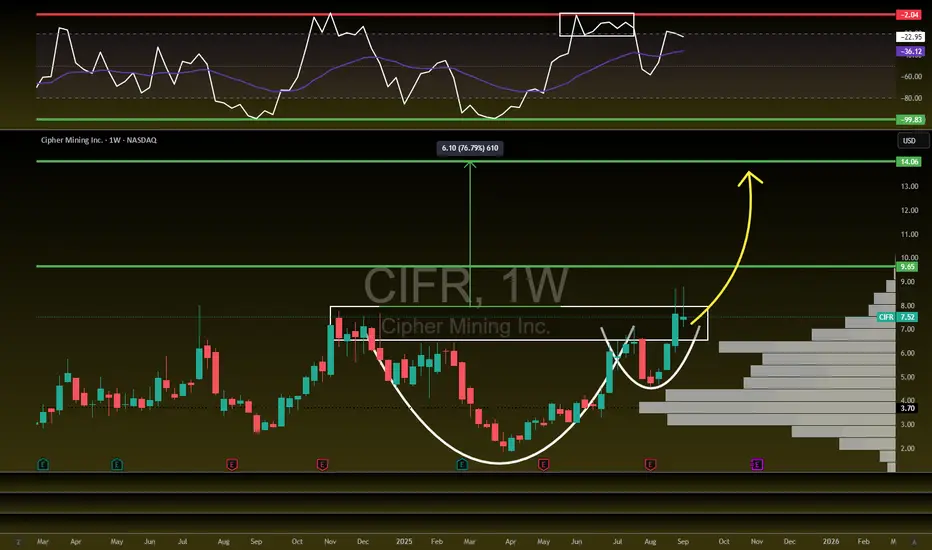
Could this be the next $IREN?NASDAQ:CIFR
Ended the week with a green big wick candle.
A follow through to the upside next week and a close above the cupnhandle breakout area means big things for this stock.
Breakout = $9.65/ $14 🎯
$RKLB - Can't Stop, Won't StopNASDAQ:RKLB - Can't Stop, Won't Stop
Holding uptrend and downtrend at the same time.
Breakout = $62.81
Breakdown = $33 Retest

HIMS Setting up AGAIN...NYSE:HIMS - Dip Buy Box Wins Again!
Second time bouncing off our $40-45 support.
Breaking out of downtrend with a strong bullish candle.
Target $67 then $73 🎯

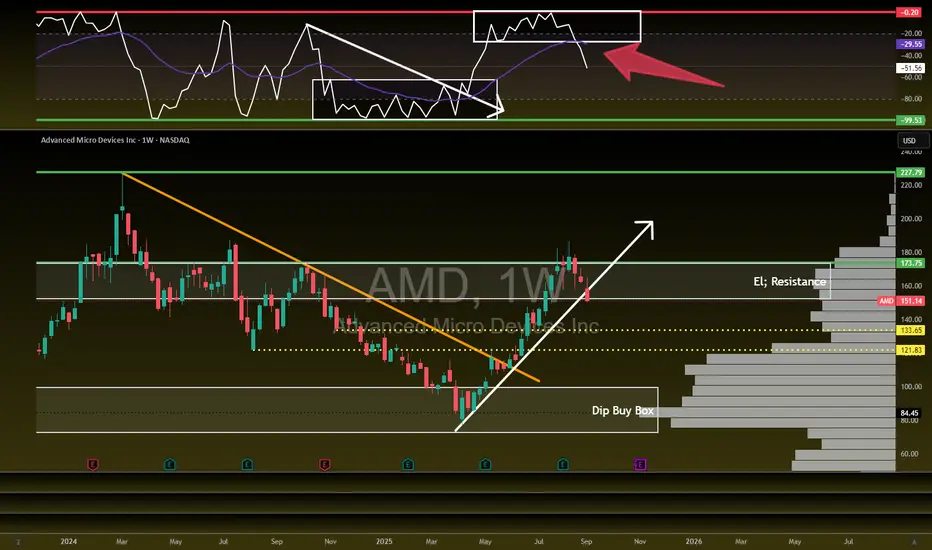
AMD - Free Fall TimeNASDAQ:AMD - Free Fall Time
Hit El' Resistance and collapsed. Uptrend broken.
WCB broken down and looking at $134 or $122 for a bottom from here.
Can't wait to get back into this trade once we flip again.
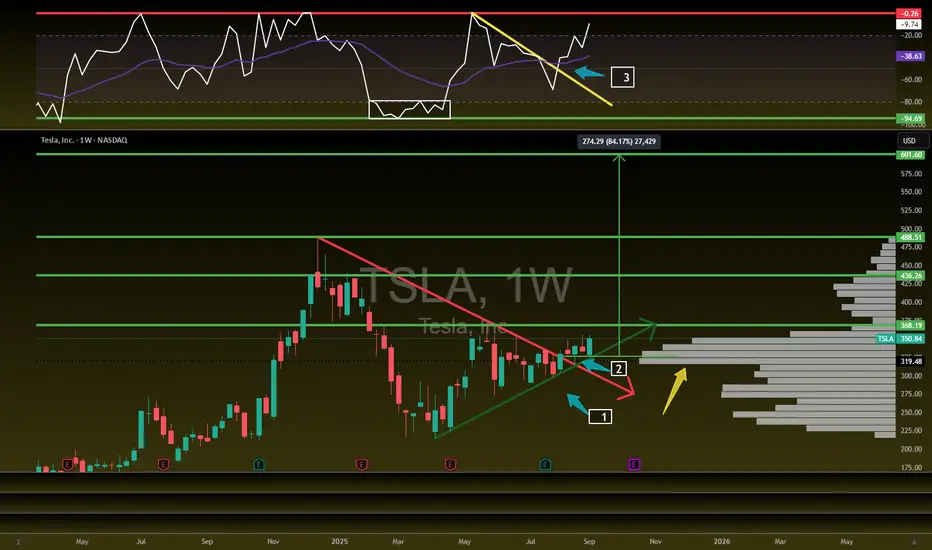
Tesla Looks Primed!NASDAQ:TSLA Looks primed!
Bullish as all getup!
Breaking out-Volume Shelf-Bullish Willy
Targets: $368/ 436/ 488/ 601
Role of Technology in Global Markets 1. Historical Evolution of Technology in Markets
a. Early Communication Systems
In the 1800s, financial markets were largely local. Traders depended on physical meetings or handwritten letters to exchange market information.
The invention of the telegraph (1837) and later the telephone (1876) dramatically reduced the time it took to transmit financial information across cities and countries. For example, stock prices could be sent from New York to London in minutes instead of weeks.
b. Electronic Trading Emergence
The 20th century saw the development of electronic ticker systems, allowing near real-time updates of market prices.
By the 1970s and 1980s, exchanges began experimenting with electronic order-matching systems. NASDAQ, founded in 1971, became the world’s first electronic stock exchange.
c. The Internet Revolution
The 1990s introduced the internet into global markets. Online trading platforms allowed retail investors to directly access markets without relying solely on brokers.
E-commerce platforms like Amazon and Alibaba transformed global consumer markets, while digital communication allowed businesses to operate internationally with ease.
d. 21st-Century Transformations
Today’s markets are dominated by high-frequency trading (HFT), artificial intelligence (AI)-driven strategies, blockchain technologies, cloud computing, and mobile financial services.
Cross-border investing is instantaneous, and global markets operate nearly 24/7 with technology as their backbone.
2. Key Roles of Technology in Global Markets
a. Enhancing Market Efficiency
Technology reduces information asymmetry by providing real-time access to prices, news, and economic data.
Algorithms match buyers and sellers instantly, narrowing bid-ask spreads and improving liquidity.
b. Democratization of Access
Earlier, only wealthy institutions could access sophisticated markets. Now, mobile apps and online brokerages allow small retail investors across the world to trade with minimal costs.
Platforms like Robinhood, Zerodha, and eToro have expanded participation, enabling global capital flows.
c. Speed and Automation
High-frequency trading systems can execute thousands of trades per second, exploiting micro-price differences across exchanges.
Automation has also entered settlement systems. For example, blockchain-based smart contracts can settle cross-border payments instantly, reducing costs and delays.
d. Integration of Global Trade and Supply Chains
Technology supports global commerce through logistics software, digital supply chain management, and e-commerce.
Platforms like Amazon, Alibaba, and Shopify connect producers in one country directly with consumers worldwide.
e. Data and Analytics
Markets today thrive on data. Artificial intelligence and machine learning analyze billions of data points—from satellite images to social media sentiment—to predict economic and financial trends.
Big data tools allow investors and companies to manage risks better, anticipate market shifts, and optimize operations.
f. Financial Innovation
Technology has given rise to new asset classes such as cryptocurrencies, NFTs, and tokenized securities.
Decentralized Finance (DeFi) platforms now allow global lending, borrowing, and investing without intermediaries.
3. The Role of Technology Across Market Segments
a. Stock Markets
Stock exchanges globally, like NYSE, NASDAQ, London Stock Exchange, and NSE India, operate through highly advanced trading platforms.
Investors across the world can place trades in milliseconds, and order books are updated in real-time.
AI-driven portfolio management tools (robo-advisors) help retail investors diversify globally at low costs.
b. Foreign Exchange (Forex) Markets
The forex market is the world’s largest, trading over $7 trillion daily. Technology enables real-time currency trading across time zones.
Electronic Communication Networks (ECNs) match global buyers and sellers, improving liquidity and reducing barriers.
Mobile apps allow individuals to hedge against currency risk or speculate, regardless of location.
c. Commodities and Energy Markets
Technology enables smart logistics, digital commodity trading platforms, and automated hedging strategies.
For oil, metals, and agricultural products, satellite data and IoT devices provide real-time production and supply information, improving transparency.
d. Cryptocurrency and Digital Assets
Blockchain technology has created entirely new forms of global markets.
Bitcoin, Ethereum, and other cryptocurrencies trade on global exchanges accessible 24/7.
DeFi protocols allow people to lend, borrow, and earn interest globally without banks.
e. E-commerce and Consumer Markets
Global consumer markets are dominated by digital platforms. Amazon, Alibaba, Flipkart, and Mercado Libre connect sellers and buyers worldwide.
Payment technologies like PayPal, UPI, and digital wallets facilitate seamless cross-border transactions.
4. Benefits of Technology in Global Markets
Accessibility: Investors and businesses worldwide can participate, regardless of geography.
Efficiency: Faster transactions, lower costs, and transparent processes.
Liquidity: Electronic platforms ensure deep pools of buyers and sellers.
Innovation: Emergence of new asset classes and financial instruments.
Transparency: Real-time reporting and monitoring reduce fraud and insider advantages.
Inclusivity: Small investors and businesses gain entry into markets once dominated by large institutions.
5. Risks and Challenges of Technology in Global Markets
a. Cybersecurity Threats
Global markets face risks of hacking, data breaches, and fraud.
High-profile exchange hacks (like Mt. Gox in 2014) show how vulnerable digital markets can be.
b. Market Volatility
Algorithmic trading sometimes amplifies volatility, as seen in the “Flash Crash” of May 2010 when the Dow dropped nearly 1,000 points within minutes.
c. Digital Divide
While technology democratizes access, millions worldwide remain excluded due to lack of internet, devices, or digital literacy.
d. Regulatory Challenges
Cross-border digital markets are hard to regulate uniformly. For example, cryptocurrency regulations differ drastically between countries, creating uncertainty.
e. Over-Reliance on Technology
System failures, outages, or glitches can halt global trading. For instance, NYSE and NSE India have both faced trading halts due to technical issues.
6. The Future of Technology in Global Markets
a. Artificial Intelligence (AI) and Machine Learning
AI will further automate trading, risk management, and fraud detection.
Predictive analytics will become central to investment decisions.
b. Blockchain and Decentralization
Blockchain has the potential to eliminate intermediaries in global markets, reducing costs and improving efficiency.
Tokenization may allow fractional ownership of real-world assets like real estate and art.
c. Quantum Computing
Quantum technology could revolutionize market modeling, encryption, and trading strategies, offering new levels of computational power.
d. Sustainable and Green Technology
Technology will enable carbon credit markets, renewable energy trading platforms, and ESG-focused investing.
Blockchain can track supply chain sustainability and ethical sourcing.
e. Global Financial Inclusion
Mobile banking and fintech will bring billions of unbanked individuals into the global financial system, especially in developing nations.
7. Case Studies
Robinhood and Gamestop (2021): Showed how technology and social media democratize access but also create risks of market manipulation.
Alibaba Singles’ Day Sales: A showcase of how e-commerce technology creates global consumer demand, with billions in sales in a single day.
Cryptocurrency Boom: Bitcoin’s rise to a trillion-dollar asset class highlights the disruptive role of blockchain in global finance.
Tesla’s Global Supply Chain: Use of AI, automation, and digital logistics to manage global production and delivery networks.
Conclusion
Technology is not just an enabler but the backbone of modern global markets. It drives speed, efficiency, innovation, and inclusivity, ensuring that capital, goods, services, and information flow seamlessly across borders. However, its power also comes with risks—cyber threats, volatility, inequality, and regulatory challenges—that must be managed carefully.
As we look ahead, technology’s role will only deepen, with AI, blockchain, and fintech shaping the next wave of market evolution. The ultimate challenge will be to harness technology’s benefits while creating safeguards that ensure global markets remain fair, stable, and inclusive for all.
Risks in International Markets1. Economic Risks
1.1 Exchange Rate Volatility
Currency fluctuations are one of the most prominent risks in international trade and investment. A company exporting goods may see profits wiped out if the foreign currency weakens against its home currency.
Example: An Indian IT company billing clients in U.S. dollars may face reduced revenues when the rupee strengthens against the dollar.
1.2 Inflation and Deflation
High inflation erodes purchasing power, increases input costs, and disrupts profit margins. Conversely, deflation can reduce demand and stall economic activity.
Example: Argentina’s chronic inflation crisis often discourages foreign investors who fear value erosion.
1.3 Interest Rate Fluctuations
Central banks’ monetary policies impact borrowing costs and investment flows. An unexpected hike in interest rates in one country may cause sudden capital flight from emerging markets.
Example: The U.S. Federal Reserve’s interest rate hikes often trigger volatility in Asian and African markets.
1.4 Recession and Economic Slowdowns
Global recessions reduce demand for exports, depress commodity prices, and weaken consumer confidence.
Example: The 2008 global financial crisis led to massive declines in cross-border trade and investment.
2. Financial Risks
2.1 Credit and Default Risks
Companies operating in international markets face the risk of counterparties defaulting on payments.
Example: During the 1997 Asian financial crisis, many firms defaulted, leaving global suppliers unpaid.
2.2 Liquidity Risks
Some foreign markets lack depth, meaning it may be difficult to sell assets quickly without losses.
2.3 Market Volatility
Stock, bond, and commodity markets in emerging economies are often more volatile due to low investor confidence, political instability, or weak regulations.
Example: The Russian stock market has historically experienced extreme volatility linked to sanctions and oil price movements.
2.4 Capital Flow Reversals
Large and sudden withdrawals of foreign portfolio investments can destabilize markets.
3. Political Risks
3.1 Government Instability
Frequent changes in government, corruption, or coups create uncertainty.
Example: Political turmoil in Pakistan often deters foreign direct investment.
3.2 Nationalization and Expropriation
Governments may seize control of foreign assets.
Example: Venezuela nationalized foreign oil companies in the 2000s, leading to billion-dollar losses for firms like ExxonMobil.
3.3 Geopolitical Conflicts
Wars, sanctions, and territorial disputes disrupt supply chains and investments.
Example: The Russia-Ukraine conflict caused global energy and food price spikes.
3.4 Protectionism
Tariffs, quotas, and restrictions limit free trade.
Example: The U.S.–China trade war imposed heavy tariffs, hurting exporters worldwide.
4. Legal and Regulatory Risks
4.1 Differing Legal Systems
What is legal in one country may be illegal in another.
Example: Intellectual property protection is strong in the U.S. but weak in some Asian economies, leading to counterfeiting risks.
4.2 Taxation Policies
Double taxation or unexpected tax reforms can erode profits.
4.3 Contract Enforcement
Weak judicial systems may delay or prevent resolution of business disputes.
4.4 Compliance and Standards
Businesses must comply with varying labor, safety, and environmental laws across markets.
5. Cultural and Social Risks
5.1 Consumer Preferences
Products that succeed in one country may fail elsewhere due to cultural differences.
Example: Walmart struggled in Germany because its retail culture clashed with German shopping habits.
5.2 Communication Barriers
Misunderstandings due to language or etiquette can harm negotiations.
5.3 Labor Relations
Different countries have unique labor practices and union dynamics.
5.4 Social Unrest
Strikes, protests, or civil movements can disrupt operations.
6. Technological Risks
6.1 Cybersecurity Threats
Cross-border businesses face heightened risks of hacking, fraud, and cyber-espionage.
Example: Global ransomware attacks like WannaCry hit companies operating internationally.
6.2 Technological Obsolescence
Rapid innovation means products and processes can quickly become outdated.
6.3 Digital Divide
Operating in markets with poor digital infrastructure limits efficiency.
7. Environmental and Natural Risks
7.1 Climate Change
Rising sea levels, extreme weather, and changing agricultural patterns disrupt global supply chains.
Example: Floods in Thailand (2011) severely disrupted global automobile and electronics supply chains.
7.2 Natural Disasters
Earthquakes, hurricanes, or pandemics can shut down markets overnight.
Example: The COVID-19 pandemic brought unprecedented disruption to international trade.
7.3 Environmental Regulations
Stricter global climate policies increase compliance costs.
8. Operational Risks
8.1 Supply Chain Disruptions
Globalized production systems are highly vulnerable to bottlenecks.
Example: The 2021 Suez Canal blockage caused billions in trade losses.
8.2 Infrastructure Limitations
Poor roads, ports, and logistics reduce efficiency.
8.3 Management Complexity
Coordinating diverse teams across countries increases risks of inefficiency.
9. Case Studies
2008 Global Financial Crisis – Showed how interconnected financial systems amplify risks.
Brexit – Created uncertainty for businesses operating across the UK and EU.
COVID-19 Pandemic – Highlighted vulnerabilities in supply chains and global health systems.
U.S.–China Trade War – Demonstrated how political tensions affect global markets.
10. Risk Mitigation Strategies
Hedging against currency and commodity risks.
Diversification across markets and sectors.
Political risk insurance for investments in volatile regions.
Robust compliance programs for navigating legal risks.
Cultural training for international teams.
Digital security investments to counter cyber threats.
Supply chain resilience through multiple sourcing and local alternatives.
Conclusion
International markets present immense opportunities for growth and diversification. However, these opportunities are shadowed by complex risks ranging from currency volatility and political instability to technological disruptions and environmental challenges.
For investors, corporations, and policymakers, success lies not in avoiding risks but in understanding, anticipating, and managing them strategically. A structured approach to risk assessment, combined with adaptive strategies, enables global players to thrive in uncertain environments.
The modern world demands resilience—businesses must prepare for shocks, governments must design stable frameworks, and investors must remain vigilant. By doing so, the promise of international markets can outweigh their perils.
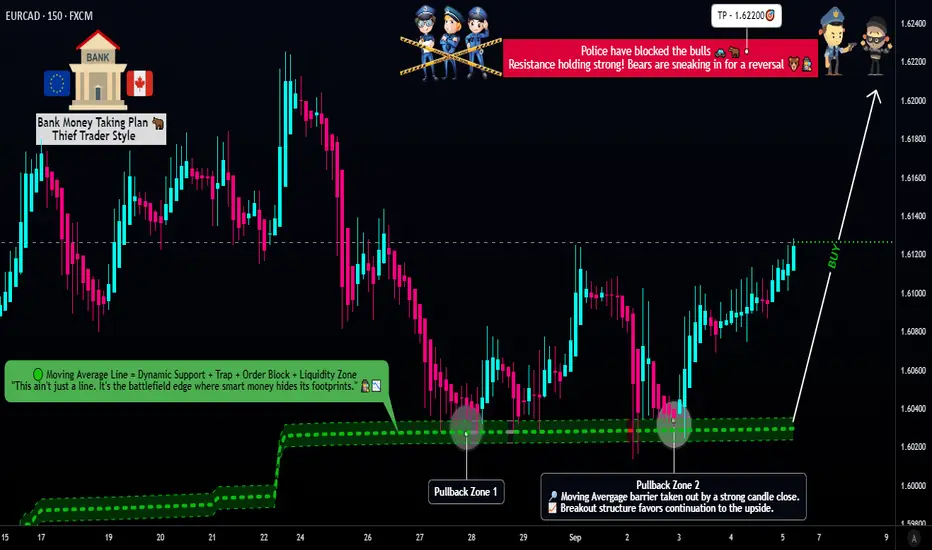
EUR/CAD: Launching Long! Layered Entry Strategy For Gains💸 EUR/CAD "Euro vs Loonie" Bank Plan (Swing / Scalping) 📊
🎯 Trading Plan (Thief Layering Strategy)
Asset: EUR/CAD
Setup: Bullish Hull Moving Average breakout + retest 🟢
Entry (Layering Style): Multiple buy limit orders at
1.60800
1.60900
1.61000
1.61200
(You can expand layers based on your own risk preference)
Stop Loss (SL): Thief SL @ 1.60600 (adjust to your own risk strategy) 🛡️
Target (TP): Resistance "police barricade" around 1.62200 🏁
⚠️ Note: This is not financial advice — manage your own TP and risk as per your trading plan.
🔍 Why This Plan? (Fundamental + Macro + Sentiment + Thief Blend)
📈 Real-Time Snapshot (Sept 5, 2025)
EUR/CAD Spot Rate: 1.6025
Daily Change: +0.12%
52-Week Range: 1.4650 – 1.6350
👥 Trader Sentiment
Retail Traders: 42% Long 🐂 | 58% Short 🐻
Institutions: 55% Long 🐂 | 45% Short 🐻
😱 Investor Mood (Fear & Greed)
Index: 48/100 → Neutral ⚖️ (leaning fear due to global trade + US jobs data)
📋 Fundamentals
Score: 62/100 🟢
Drivers:
Eurozone growth resilient, ECB steady at 2% 🏦
Canada facing weak jobs data, BoC at 2.75% 🛢️
Oil prices steady, modest CAD support ⚡
🌍 Macro Score
Score: 58/100 🟡
Factors:
Global trade tensions weigh on CAD 🛡️
Eurozone recovery boosts EUR 💪
US policy uncertainty adds volatility 🌪️
🧭 Overall Market Outlook
Bias: Neutral → Slightly Bullish Tilt 📈
Why: ECB support + Eurozone recovery outweigh CAD’s oil-linked strength. Range likely 1.60 – 1.63 short-term.
🚦 Related Pairs to Watch
FX:EURUSD , OANDA:USDCAD , OANDA:GBPCAD , OANDA:EURGBP
Keep an eye on BLACKBULL:WTI (Oil) for CAD correlation.
✨ “If you find value in my analysis, a 👍 and 🚀 boost is much appreciated — it helps me share more setups with the community!”
#EURCAD #Forex #TradingPlan #SwingTrading #Scalping #ThiefStrategy #HullMovingAverage #Fundamentals #MacroAnalysis #Sentiment #FXCommunity
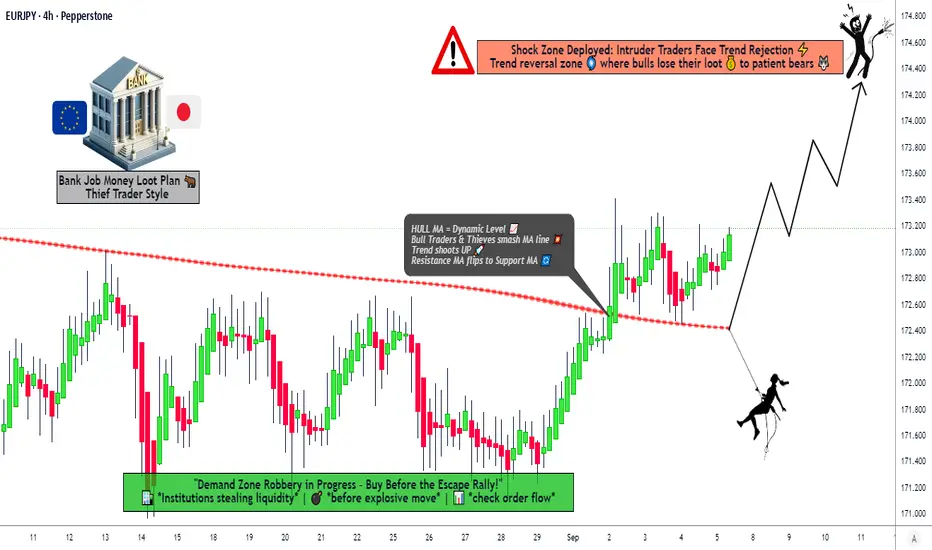
EUR/JPY Bank Heist Is LIVE! Bullish Breakout Plan >>>🚀 EUR/JPY "The Yuppy" Bank Heist Plan (Swing/Scalping Trade) 🚀
Professional Thief Strategy for High-Probability Breakout Trading
🎯 Executive Thief Summary
Asset: EUR/JPY "The Yuppy" (The Euro-Yen Cross)
Strategy: Bullish Hull MA Breakout & Retest with Layered Entry Approach
Timeframe: Swing/Scalping (1H-4H Charts)
Current Price: ¥173.15 | Daily Change: +0.10% (+0.17)
Trade Bias: Mildly Bullish (65% Bullish Score) ✅
Thief Note: This plan combines technical breakout dynamics with fundamental macro drivers for a high-probability heist operation!
📊 Technical Heist Plan
🎮 Entry Strategy (Layered Limit Orders)
The Thief's Multi-Layer Entry Approach for Optimal Positioning:
Layer 1: ¥172.60 (Initial breakout retest zone) ⚡
Layer 2: ¥172.70 (Volume-weighted support area) ⚡
Layer 3: ¥172.80 (Hull MA confluence zone) ⚡
Layer 4: ¥173.00 (Dynamic support & momentum acceleration) ⚡
Thief Tip: You can add additional layers based on your risk appetite and capital allocation strategy!
🛡️ Risk Management
Stop Loss: ¥172.20 (Below 100-day EMA & key support) ❌
Position Sizing: Risk no more than 1-2% per trade layer
Adjustment Note: Dear Thief OG's - Modify your SL based on your individual risk tolerance and strategy parameters
🎯 Profit Targets
Primary Target: ¥174.30 (High-voltage resistance zone) ✅
Context: RSI showing overbought conditions likely at this level - escape with stolen money before potential reversal!
🌍 Fundamental & Macro Context
🇪🇺 Eurozone Factors (EUR Strengths)
ECB Rate Policy: Hold at 2.15% (Hawkish Stance) 🦅
Inflation (HICP): 2.1% (Above ECB's 2% target - supportive for EUR)
Market Impact: Rate differentials favor EUR strength
🇯🇵 Japan Factors (JPY Weaknesses)
BoJ Policy: Dovish (Uncertain Timing for Hikes) 🕊️
Real Wages: Turned Positive (First Time in 7 Months - but gradual impact) ✅
Trade Deal: US-Japan Auto Tariff Reduction (JPY Positive but limited impact)
📅 Economic Calendar Watch
Eurozone GDP Data Today (09:00 GMT) - Potential short-term volatility driver
Risk: GDP miss could cause EUR pullback - monitor news flow
📊 Market Sentiment & Positioning
😰 Fear & Greed Index
Stock Market Sentiment: Greed (Score: 57/100) 📈
Crypto Sentiment: Neutral (Score: 50/100)
Key Drivers:
S&P 500 above 125-day moving average → Greed
Low put/call ratio → Optimism
Stable volatility (VIX) → Confidence
👥 Trader Sentiment
Retail Traders: Bullish (60% Long) 🟢 vs. Bearish (40% Short) 🔴
Institutional Traders: Bullish (55% Long) 🟢 vs. Bearish (45% Short) 🔴
Primary Reason: Carry trade appeal due to rate differentials
⚠️ Risk Factors & Considerations
🚨 Key Risks
Eurozone GDP Miss → EUR Pullback (Monitor 09:00 GMT release)
BoJ Surprise Hike → JPY Rally (Low probability but high impact)
Geopolitical Tensions → Safe-Haven JPY Demand (Always monitor global headlines)
📋 Trade Management Tips
Scale In: Use the layered entry approach to improve average entry price
Scale Out: Consider partial profits at ¥173.40 and ¥174.00 if momentum slows
News Awareness: Monitor ECB and BoJ speaker comments for unexpected guidance changes
📊 Related Pairs to Watch
EUR
Correlations:
EUR/USD - Direct EUR exposure
EUR/CHF - European cross rate
EUR/GBP - European monetary policy differentials
JPY
Correlations:
USD/JPY - Dollar-Yen dynamics
GBP/JPY - Risk-sensitive yen cross
AUD/JPY - Commodity-yen relationship
Thief Insight: Monitor these pairs for confirmation of broader EUR/JPY moves!
✨ Final Thief Notes
Why This Plan Works Now:
Technical breakout confirms bullish bias
Fundamental rate differentials favor EUR strength
Market sentiment supports risk-on environment
Layered entry approach provides optimal risk-reward
Trade Duration Expectation:
Swing Trade: 3-7 days for full target
Scalping Opportunities: 1-4 hour moves within the trend
✨ "If you find value in my analysis, a 👍 and 🚀 boost is much appreciated — it helps me share more setups with the community!"
📌 Hashtags
#EURJPY #ForexTrading #TechnicalAnalysis #SwingTrading #Scalping #BreakoutStrategy #HullMA #TradingSetup #ForexSignals #TradingView #BankHeistPlan #ThiefStrategy #RiskManagement
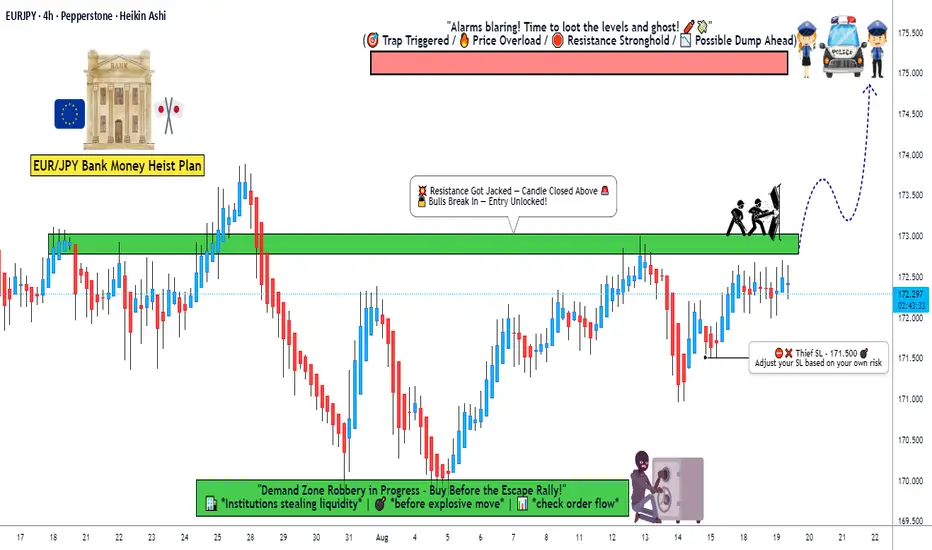
Ready To Raid The EUR/JPY? Bullish Breakout Plan Inside!🌟 ATTENTION ALL YEN YAKUZA & EURO EAGLES! 🌟
Dear Ladies & Gentleman of the High-Finance Underworld, 🕴️💎
Based on the 🔥ULTIMATE THIEF TRADING HEIST MANUAL🔥, here is the master plan to rob the EUR/JPY "The Yuppy" bank blind! This is a BULLISH pending order assault. Our aim is the luxurious 175.000 VIP Money Vault. 🏦💰✨
Entry: The Grand Heist Begins! ⚡
The Trigger: We wait for the BREAKOUT & HOLD above 173.000. This is when the guards change shifts! 🚨
The Layering Strategy (The Genius Move): The Thief doesn't just kick the door down; he picks all the locks at once! Place MULTIPLE BUY LIMIT ORDERS on any dip or retest to create a powerful average entry. Think like a pro!
1st Layer (The Decoy): @173.000 (After breakout confirm)
2nd Layer (The Bag Filler): @172.700
3rd Layer (The Masterstroke): @172.500
4th Layer (The Insurance Policy): @172.300
🤑 YOU CAN ADD MORE LAYERS BASED ON YOUR RISK APPETITE! 🤑
Stop Loss: The Escape Route! 🛑
"Yo, listen up! 🗣️" Do NOT set your stop loss until AFTER the 173.000 breakout is confirmed! The Thief's ultimate safety net is placed at @171.500. This is our emergency exit if the heist goes sideways.
⚠️ WARNING: You OG's can adjust this SL based on your own risk tolerance and number of layers. But remember, a real thief always has an exit plan! 👊😎
Target: The Getaway! 🎯
The police have set up a barricade at 175.500. We are not greedy! Our escape chopper is waiting at @175.000. GRAB THE STOLEN CASH AND GO! Don't wait for the cops! 🚁💵💨
⚠️TRADING ALERT: News Releases & Managing the Loot 📰🗞️
News can bring swat teams (volatility). To protect your stolen profits:
Avoid placing new layers during high-impact news.
Use a TRAILING STOP once we're in profit to lock in those stacks! 🔒💰
💖SUPPORT THE HEIST CREW!
💥SMASH THAT BOOST BUTTON!💥 It fuels our next grand robbery! Let's make stealing from the market look easy every single day. 🏆💪🤝❤️🎉🚀
I'll be back with another flawless plan. Stay sharp, stay profitable! 🤑🐱👤🤗🤩