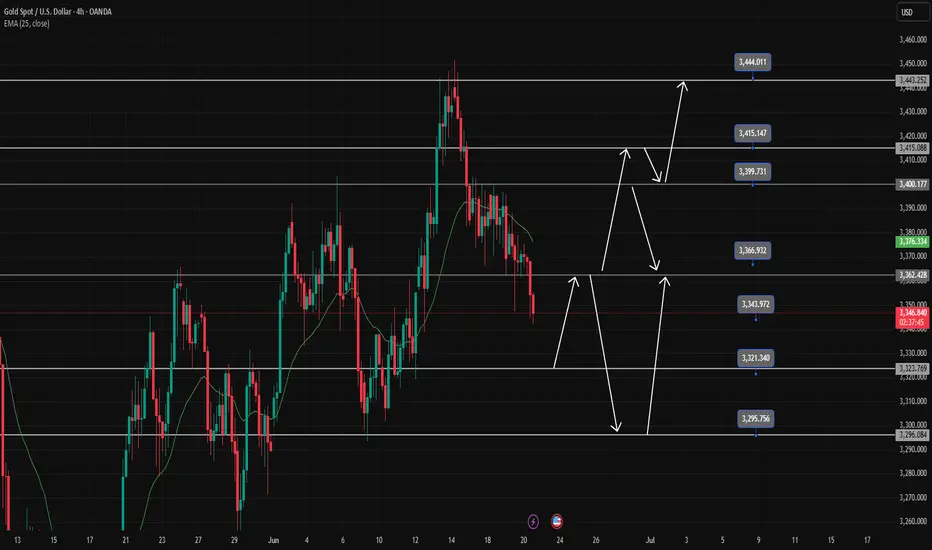
Gold Trading Strategy June 20Daily candle continues to show a struggle while the Sellers are dominating. Today there may be a deep sweep and then a recovery at the end of the day.
Yesterday's 3343 zone is reacting 5 prices in the direction of profit. Next support around 3323 pay attention to the next sweep. Pay attention to additional daily support at 3296 for today's buy strategy.
3362 gives a SELL Break out signal in the Asia-Europe session. If Gold closes back above 3362, then BUY to 3400 target the two upper resistance zones remain the same as yesterday at 3415 and 3443
Resistance: 3400-3415-3443
Support: 3323-3296
Break out: 3362
Trade-gold
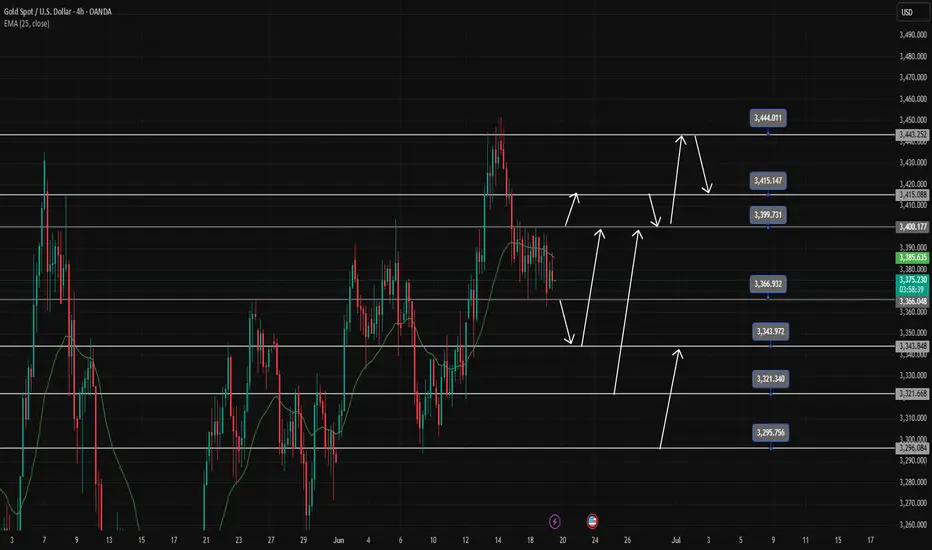
Gold Trading Strategy June 19Yesterday's D1 candle confirmed the Sell side after the FOMC announcement. Today's Asian session had a push but the European and American sessions are likely to sell again.
3366 will be an important breakout zone today, if broken through, the Sell side will continue to be strong and push the price deeper and limit buying when breaking this 3366 zone. 3344 is the first target, it is difficult for gold to break this zone but if it breaks right away, wait below 3296 to BUY for safety. Before that, pay attention to another support zone 3322.
3400 is the Breakout border zone from yesterday to today but gold has not broken it yet. To SELL this zone, you must also wait for the confirmation of the candle, but if you want to wait for a better SELL, you must wait for 3415 or wait at the ATH peak 3443. However, if it breaks 3400, waiting for a Buy test will be quite nice.
Support: 3343-3322-3296
Resistance: 3415-3443
Break out zone: 3366-3400
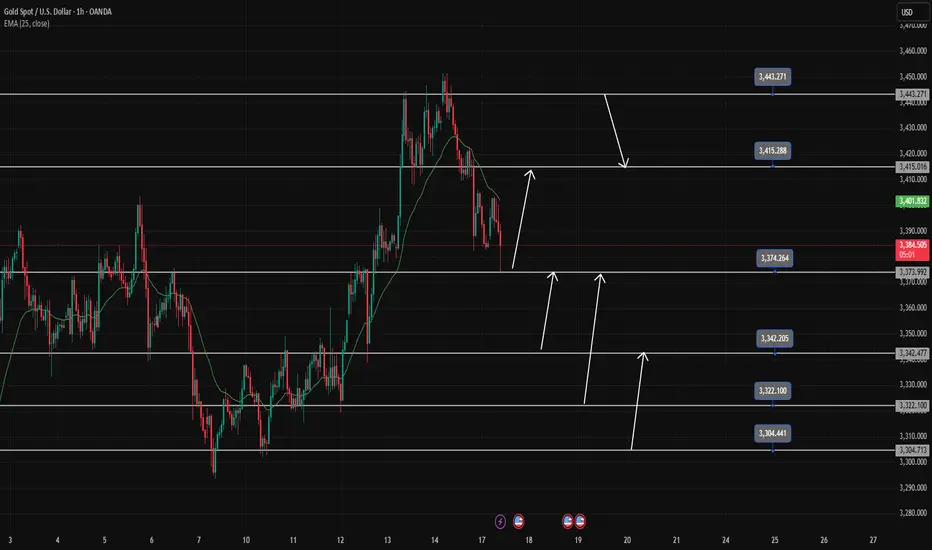
Gold trading strategy June 17D1 candle shows profit taking by sellers pushing the price back below 3400. In the current context, the pullback is only short-term and has not confirmed the reversal, but long-term Buy signals can still be noticed at important support zones.
Today, there are many price zones that can BUY Gold, so wait for confirmation before placing an order. Gold is heading towards the first support around 3375-3373 (this zone has just reacted 100 pips). This is also the Breakout zone. If it breaks this zone, Gold will reach 3343-3341 before it can BUY.
Note that to sell break 3373 and the SELL resistance point must wait for 3415 and the daily resistance 3443-3445
If there is a sweep to 3343 and bounces and closes above the 3373 breakout zone, it confirms that the uptrend will continue strongly in the near future.
The next BUY support zone to pay attention to is 3322-3320 and the 3305-3303 zone. The BUY target is always pushed further back to 3415 or to the peak around 3443.
SUPPORT: 3373;3342;3322;3304
RESISTANCE: 3415;3443
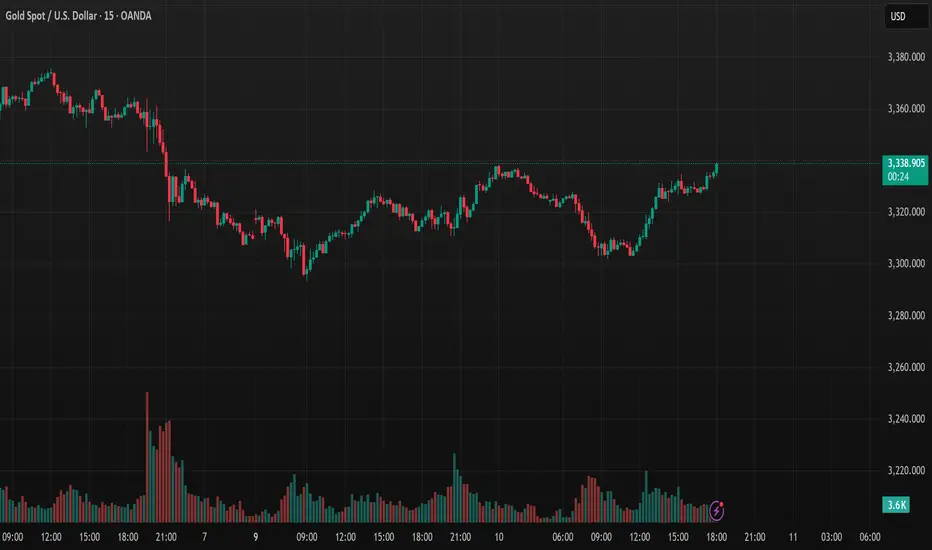
Gold drops over 20 USD, pressured by US-China negotiations.In the early trading session on Tuesday (June 10th), the price of gold XAUUSD dropped sharply from around 3,328 USD/ounce to about 3,305 USD/ounce.
Bloomberg pointed out that the price of gold decreased during the early Asian trading session on Tuesday when both sides in the US-China trade talks hinted at a willingness to make concessions.
The easing of tensions between Washington and Beijing could reduce the appeal of gold. Senior officials from the US and China initiated the second round of trade talks in London, the first since the Geneva meeting in early May.
On the afternoon of June 9th, local time, the first meeting of the China-US Economic and Trade Consultation Mechanism was held in London, UK. The meeting will continue on June 10th, local time.
The US delegation, led by Treasury Secretary Benjamin Bessant, also included Commerce Secretary Lutnick and US Trade Representative Greer. Bessant told reporters in London that they had a "good meeting," while Lutnick called the discussions "effective."
Bloomberg reported that the US hinted at the possibility of lifting export controls on certain technologies in exchange for China easing restrictions on rare earth exports.
The easing of tensions in the US-China trade war is a key factor currently creating downward pressure on gold, which has already risen more than 26% this year.
Gold traders are also awaiting the release of the US Consumer Price Index (CPI) data this week to assess the "health" of the US economy and predict the Federal Reserve's interest rate cut trajectory.
Technical Outlook for XAUUSD CAPITALCOM:GOLD
After recovering in yesterday's trading session, supported by the confluence of the EMA21 and Fibonacci retracement at 0.382%, gold has dropped back to test this area at the start of today's trading session.
Gold may continue to face selling pressure in the short term once the price breaks below the 0.382% Fibonacci retracement level, with the short-term target at around 3,250 USD, followed by the 0.50% Fibonacci retracement level.
However, as of now, the technical positions still show potential for price increase, as the support from EMA21 and the 0.382% Fibonacci retracement has not been broken. The short-term recovery target remains at 3,350 USD, followed by the key resistance level at 3,371 USD, which is also the price point of the 0.236% Fibonacci retracement.
Considering the current position, gold still has a bullish outlook, with the potential for a price drop mentioned earlier. The key levels to watch are as follows:
Support: 3,300 – 3,292 – 3,250 USD
Resistance: 3,350 – 3,371 USD
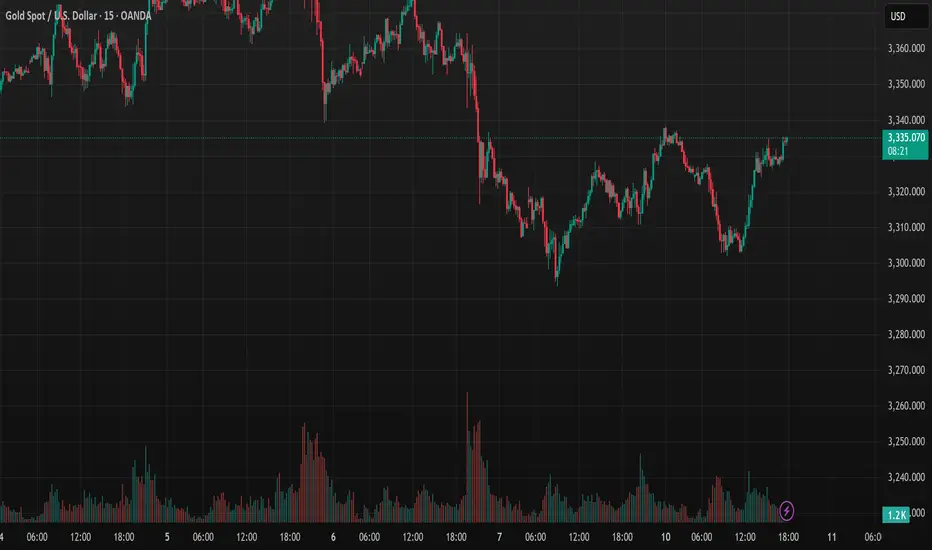
Analysis of Gold Trading Strategy for June 10th - 11th, 2025Identify strategies through this video:
Key Support and Resistance Levels of XAUUSD
Support Levels: 3,300 – 3,292 – 3,250 USD
Resistance Levels: 3,336 – 3,346 USD
With the current technical backdrop, gold still has short-term bullish potential, but it is essential to closely monitor key support and resistance levels. The gold market remains full of potential, but also presents challenges. Wishing you successful and effective trading!"
Trading Gold with Leverage: Smart or Dangerous?XAUUSD trading (Gold vs. US Dollar) is a popular choice among global traders due to its high liquidity, strong volatility, and profit potential. One of the tools that help traders amplify their returns is financial leverage. However, using leverage also carries significant risks if not managed properly. So, what exactly is leverage in XAUUSD trading? Should you use it? Let’s explore the advantages and disadvantages below.
1. What is Leverage in XAUUSD Trading?
Leverage is a financial tool that allows traders to control a larger position in the market than the capital they actually own. For example, with 1:100 leverage, you only need $1,000 to trade a position worth $100,000.
In the XAUUSD market, brokers often offer leverage ranging from 1:50 to 1:500, or even up to 1:2000—depending on their risk policies and regulations.
2. Pros of Using Leverage in XAUUSD Trading
🔹 Amplifies Potential Profits
Leverage allows traders to maximize profits with a relatively small amount of capital. When the market moves in the expected direction, the gains can be multiplied significantly.
🔹 Lower Capital Requirement
Instead of needing $10,000 to trade 1 lot of gold, a trader may only need $100–$500 depending on the leverage. This lowers the entry barrier and offers greater flexibility in capital management.
🔹 Enables Strategy Diversification
With the same amount of capital, traders can open multiple positions across different timeframes or strategies. Leverage allows for broader portfolio diversification while still maintaining control over total risk.
🔹 Takes Advantage of Short-Term Opportunities
Gold markets often react strongly to news and economic data. Leverage lets traders capitalize on short-term price swings, enabling faster profits without needing to hold positions long-term.
3. Cons and Risks of Using Leverage in XAUUSD Trading
Risk of Account Blowout
The higher the leverage, the lower the safety margin. A small market move against the position can trigger a margin call or stop-out, resulting in a full loss of the initial capital.
Emotional and Psychological Stress
High leverage often leads traders to gamble instead of follow a strategy, increasing the likelihood of emotional decisions and impulsive trading behaviors.
Difficult to Manage During Volatility
XAUUSD is a highly volatile asset, especially during U.S. sessions or major news releases (like CPI, Fed announcements, NFP). Over-leveraging can lead to rapid losses in seconds during sudden price spikes.
Increased Emotional Pressure
When using high leverage, every small fluctuation feels significant, causing stress and encouraging poor decisions—like exiting too early or revenge trading.
4. Conclusion: Should You Use Leverage in XAUUSD Trading?
Yes, but only with a disciplined and strategic approach.
Use moderate leverage (e.g. 1:100 or lower if you're a beginner)
Always set clear stop-loss and take-profit levels
Risk no more than 2% of your account per trade
Avoid “all-in” trades and don’t let emotions dictate position size
In Summary
Leverage in XAUUSD trading is a double-edged sword. Used wisely, it accelerates your profit potential. Used recklessly, it can wipe out your account in moments. The key is to trade with discipline, knowledge, and a solid plan to harness the power of leverage without falling into its traps.
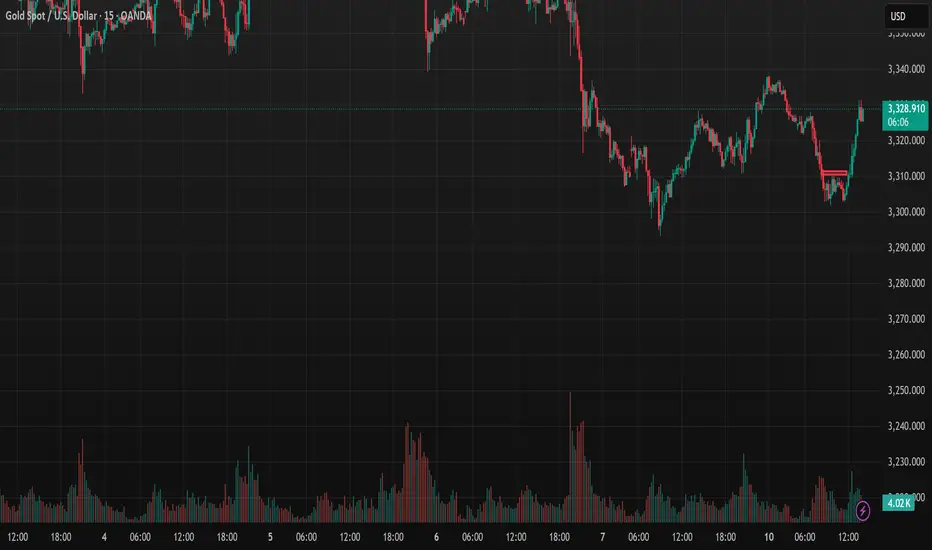
How to Use Fibonacci Extension for Effective ProfitHow to Use Fibonacci Extension for Effective Profit-Taking in Forex.
Fibonacci Extension is a powerful tool for identifying profit-taking levels in Forex, including XAU/USD trading. Here’s a concise, SEO-optimized guide to maximize your gains:
1. Understand Fibonacci Extension Levels
The 127.2%, 161.8%, and 261.8% extension levels predict price targets after a breakout, making them ideal for setting profit goals.
2. Identify Key Price Swings
Select swing low (e.g., 3.300 USD), swing high (e.g., 3.344.70 USD), and retracement low (e.g., 3.312.570 USD) on the chart.
3. Apply Fibonacci Extension
Draw from swing low to high, then extend from the retracement low. For example, 161.8% may project to approximately 3.360 USD.
4. Set Profit-Taking Targets
Conservative: Target 127.2% (e.g., 3.350 USD).
Aggressive: Aim for 161.8% (e.g., 3.360 USD), aligning with resistance levels.
5. Manage Risk
Place a stop-loss below the retracement low (e.g., 3.300 USD) and aim for a 1:2 risk-reward ratio.
6. Pro Tips
Combine with resistance, RSI, or volume; exit early if momentum fades. Update levels with new swings.
Leverage this strategy to optimize profits in volatile Forex markets like XAU/USD!
What is a Fibonacci Sequence and Its Application in Forex?What is a Fibonacci Sequence?
The Fibonacci sequence is a series of numbers where each number is the sum of the two preceding ones, typically starting with 0 and 1 (e.g., 0, 1, 1, 2, 3, 5, 8, 13, 21, ...). In trading, the Fibonacci retracement levels are derived from key ratios (23.6%, 38.2%, 50%, 61.8%, and 100%) based on this sequence. These levels are used to identify potential support and resistance zones where price reversals or continuations may occur.
Application in Forex
In Forex trading, Fibonacci retracement is a popular technical analysis tool applied to chart price movements to predict future price action:
- Identifying Support and Resistance**: Traders draw Fibonacci levels between a significant high and low on a chart. For example, after a price drop, the 61.8% retracement level often acts as support where the price might bounce back.
- Entry and Exit Points**: Forex traders use these levels to determine optimal entry points (e.g., buying near a 50% retracement) or exit points (e.g., taking profit near a 23.6% retracement after a rally).
- Stop-Loss and Take-Profit**: Fibonacci levels help set stop-loss orders below support (e.g., below 61.8%) or take-profit targets near resistance (e.g., 38.2% or 50%).
- Trend Confirmation**: In a downtrend, if the price retraces to the 38.2% level and resumes falling, it confirms the bearish trend. Conversely, a break above this level in an uptrend may signal bullish momentum.
Example in Practice
On the XAU/USD chart, if the price drops from 3.344.70 USD to 3.312.570 USD, Fibonacci levels can be plotted. The 38.2% retracement might fall around 3.330 USD, serving as a potential support zone for traders to watch.

What are Harmonic Price Patterns?Harmonic price patterns are chart patterns based on Fibonacci ratios and market geometry, used to identify potential reversal points in Forex. They rely on Fibonacci levels (e.g., 0.618, 0.786, 1.618) to measure price structures, predicting reversal zones (PRZ - Potential Reversal Zone).
Key Features:
- Based on Fibonacci ratios.
- Geometric structure with 4-5 points (X, A, B, C, D).
- Identifies PRZ for buy/sell opportunities.
- Symmetrical, reflecting market psychology.
Key Harmonic Patterns in Forex:
1. Gartley:
- AB retraces 61.8% of XA.
- D at 78.6% of XA.
- Buy/sell at D.
2. Bat:
- AB retraces 38.2-50% of XA.
- D at 88.6% of XA.
- High-precision at D.
3. Crab:
- CD extends 161.8% of XA.
- D at extreme levels.
- Suited for strong volatility.
4. Butterfly:
- AB retraces 78.6% of XA.
- D extends 127-161.8% of XA.
- End of strong trends.
5. Shark:
- AB retraces 113-161.8% of XA.
- D at 88.6-113% of XA.
- Volatile markets.
6. Cypher:
- CD retraces 78.6% of XC.
- Short-term timeframes.
How to Use:
1. Measure Fibonacci ratios to identify the pattern.
2. Locate PRZ at D, combine with support/resistance, RSI, or candlestick patterns.
3. Set stop-loss beyond PRZ, aim for risk/reward ≥ 1:2.
4. Enter trades at D after price/indicator confirmation.
Notes:
- Requires precise measurements.
- Combine with other tools for reliability.
- Practice on a demo account first.
- Avoid during high-volatility events (e.g., news releases).
Let me know if you need details on a specific pattern!
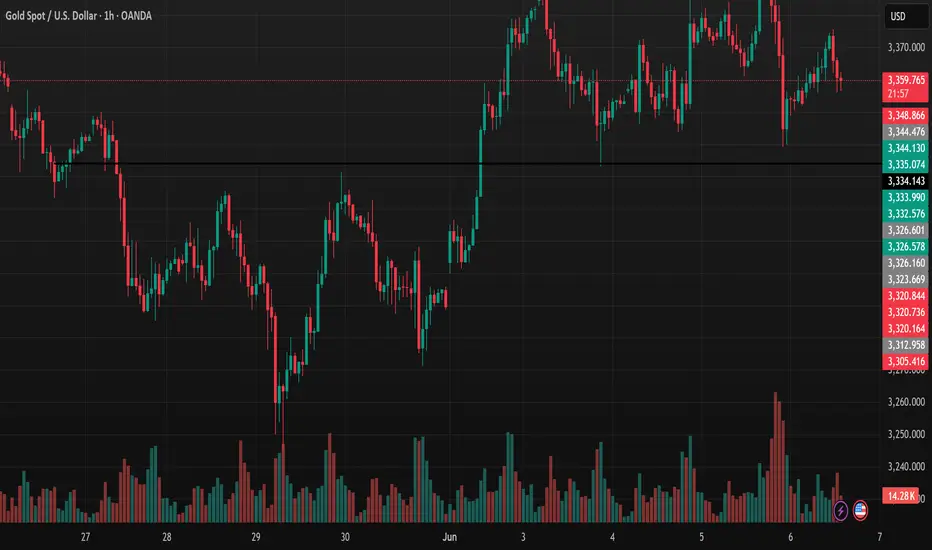
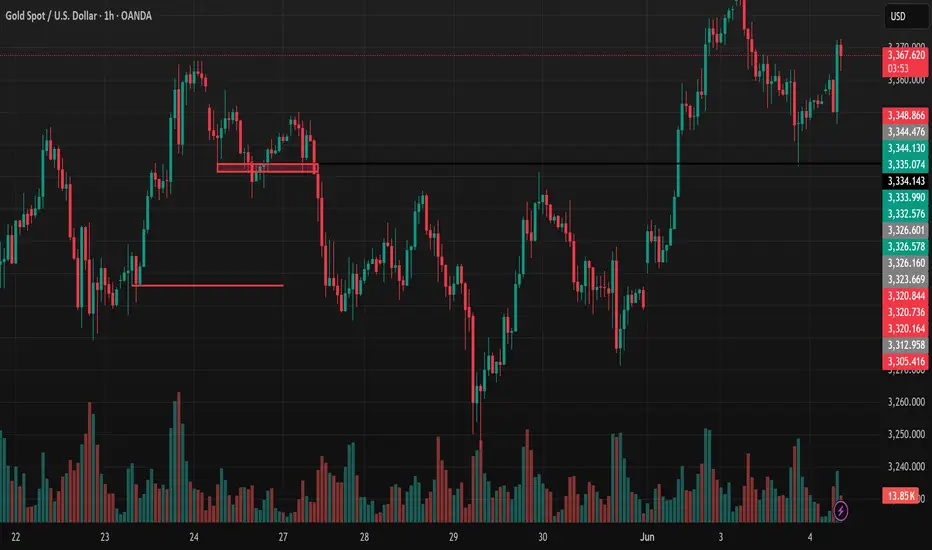
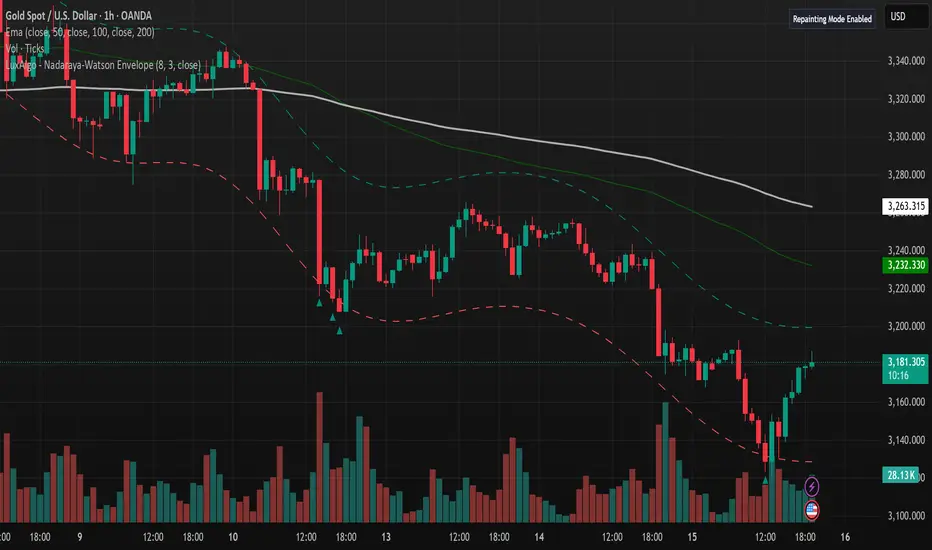
XAUUSD Slightly Up After Volatility: Analysis on 05/06/2025 The 1-hour TradingView chart for XAUUSD on 05/06/2025 shows gold prices trending slightly upward, currently trading around 3,373.885 USD/oz, up 0.03% (8.45 USD).
Prices experienced significant volatility recently, dropping to a low of around 3,220 USD/oz on 29/05 before surging to a peak of 3,375.315 USD/oz on 04/06, followed by a slight pullback.
Trading volume spiked notably during the price surge (03-04/06), indicating strong buying pressure, but tapered off during the correction, reflecting profit-taking.
Key resistance is currently at 3,375 USD/oz, with support at 3,326 USD/oz.
XAUUSD Trading Strategies
BUY XAUUSD around 3,365-3,368
Stoploss: 3,360
Take Profit : 3,372 .
SELL XAUUSD around 3,378-3,380 -
Stoploss: 3,385
Take Profit 1: 3,370
Note: Always set a Stoploss to manage risk.
Wishing you successful trades and a great day ahead! Stay informed and trade wisely.
Gold Stable Amid U.S. Data, Trade Tensions: XAUUSD TradesGold is trading steadily in the early morning session in Asia, supported by weak U.S. economic data released overnight. Service sector activity unexpectedly declined in May, while ADP data showed 37,000 jobs created, marking the slowest private sector hiring pace in over two years. Quasar Elizundia from Pepperstone stated in an email that this data has bolstered gold’s appeal as a safe-haven asset. The research strategist added that the international environment is also favorable for gold, noting trade tensions between the U.S. and China. Spot gold remained nearly unchanged at $3,374.86/oz.
Trading Strategies for XAUUSD
SELL XAUUSD around the 3390-3392 area
- SL: 3397
- TP1: 3385
- TP2: 3380
- TP3: 3374
BUY XAUUSD around the 3346-3348 area
- SL : 3340
- TP 1: 3352
- TP 2: 3356
- TP 3: 3361
Note: Always set a Stoploss in all cases to stay safe.
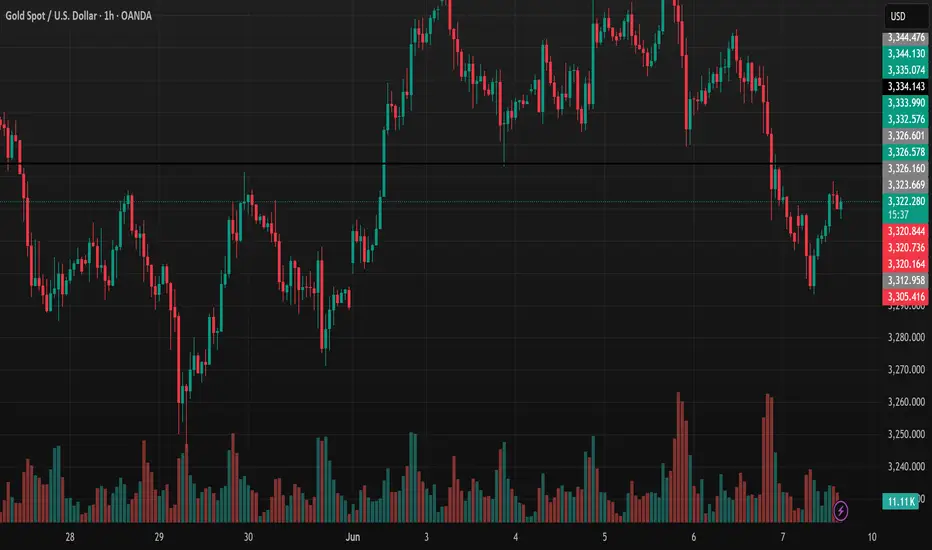
Gold prices dropped sharply from a nearly 4-week highMainly due to the strengthening U.S. Dollar, gold CAPITALCOM:GOLD prices dropped sharply from a nearly 4-week high, falling almost $30 in a single day on Tuesday, with a slight recovery during the Asian session today, Wednesday, June 4.
The Dollar Index rebounded from its lowest level in over a month, reached during early Tuesday trading, and ended the day up 0.6%, exerting moderate pressure on gold during yesterday’s session.
The Job Openings and Labor Turnover Survey (JOLTS) released by the U.S. Bureau of Labor Statistics on Tuesday showed that total job vacancies in the U.S. reached 7.39 million in April, up from 7.2 million in March. Economists had forecast 7.1 million job openings for April.
Gold prices (XAUUSD) fell on Tuesday as the unexpected rise in U.S. job openings boosted risk appetite and strengthened the Dollar, according to Bloomberg. The increase in job vacancies encouraged investors to believe that the U.S. economy remains resilient despite the tariff agenda pushed by President Trump.
Looking ahead, U.S. labor data, including Friday’s Non-Farm Payroll (NFP) report for May, could help guide the Federal Reserve’s monetary policy, Bloomberg noted. Lower interest rates are generally favorable for non-yielding assets like gold.
Gold traders will be awaiting key employment data, including the ADP report and the NFP report, to determine the Fed’s policy direction.
From a technical standpoint, there have been no significant changes on the chart or in the previous analyses, so readers can refer to the earlier publication linked below.
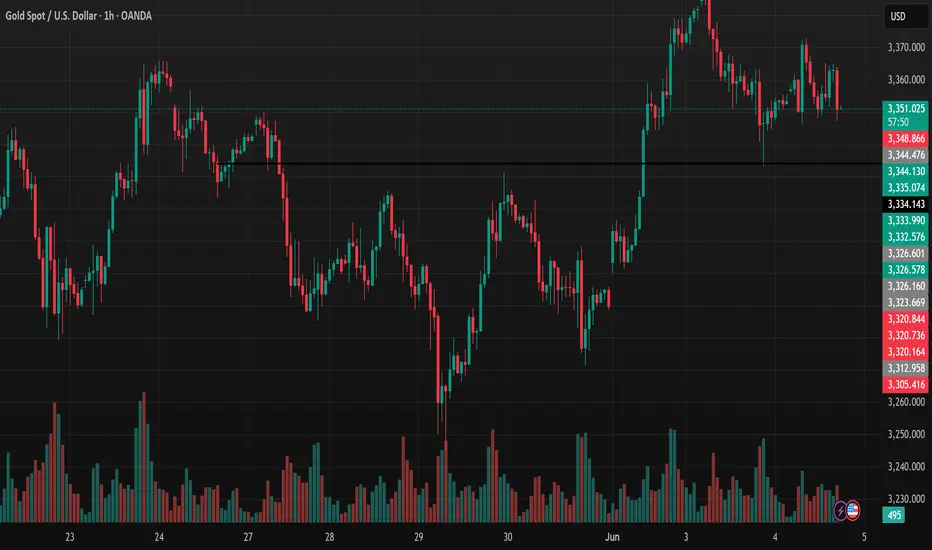
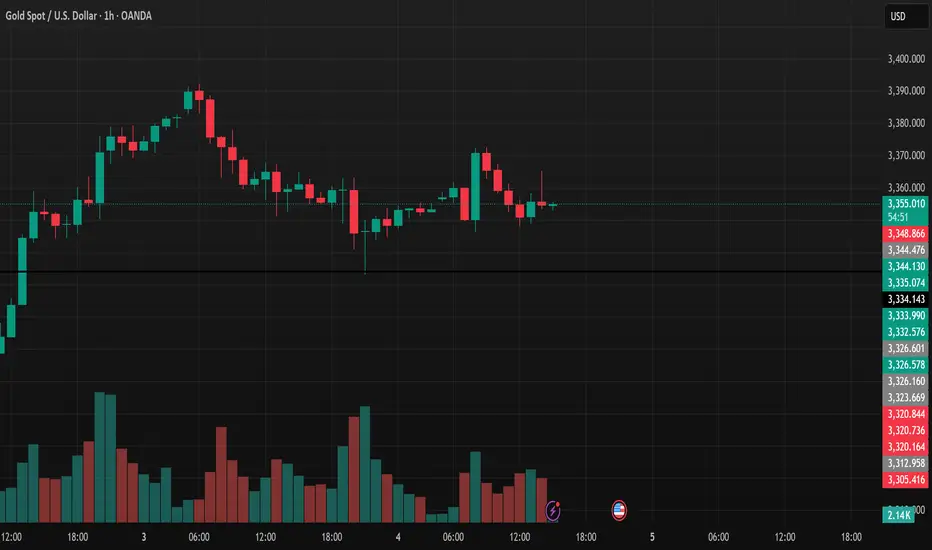
XAUUSD consolidation before a decisionGold FX:XAUUSD is currently hovering around 3,354 after a sharp drop from the recent high of 3,391. Sellers pushed the price down to the key support zone at 3,334–3,335, but bearish momentum has clearly weakened. The price is moving sideways with small-bodied candles and low volume, indicating the market is “holding its breath” ahead of the European or US sessions or potential market-moving news.
If this support zone holds and we see a clear bullish signal (such as an engulfing or marubozu candle), it could be a good entry for a buy position, targeting 3,365–3,370 initially and then aiming for a retest of 3,391. A safe stop-loss can be placed below 3,330. However, if price breaks below 3,334 and closes beneath it, the market may enter a deeper correction phase, with potential downside targets at 3,320 or even 3,305.
In short, this is a sensitive area where patience is key. Wait for clear confirmation before entering any trades, avoid rushing in, and stick strictly to your risk management rules.
Wishing all traders a clear mind, sharp strategy, and profitable results!
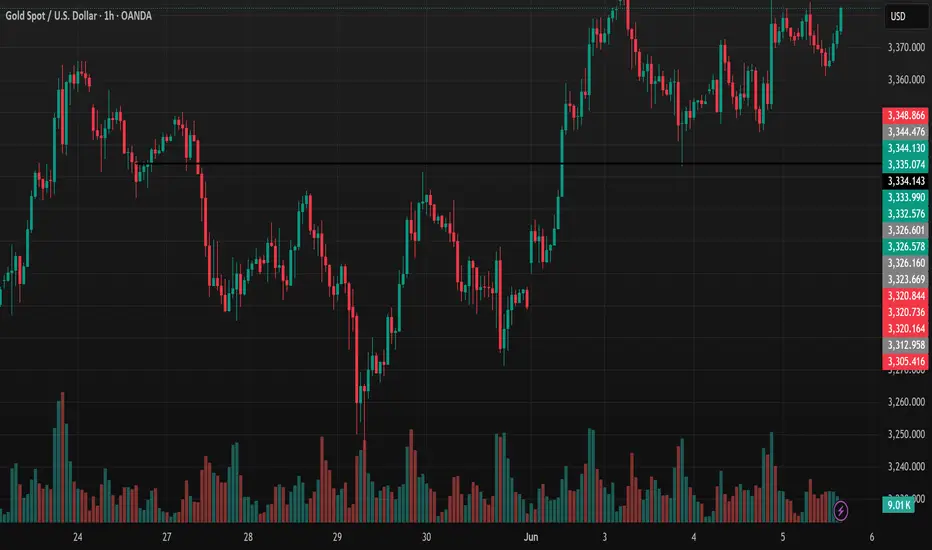
Gold Outlook: Breakout Signals Further Upside PotentialGold FX:XAUUSD is currently in a strong uptrend, backed by both technical breakout and positive fundamentals. The price has decisively cleared the key resistance zone of $3,365–$3,370 and is hovering around $3,368. A healthy pullback to retest this zone could offer a high-probability long setup, with the next target projected at $3,470.
On the macro side, renewed U.S.–China trade tensions—following Trump’s accusations and tariff threats—along with the ongoing Russia–Ukraine conflict, continue to fuel safe-haven demand for gold.
Technically, the structure remains bullish. However, a breakdown below $3,335 would invalidate the current setup and may lead to a deeper correction.
Let’s keep a close eye on this pullback zone. If momentum holds, gold could be gearing up for the next leg higher.
Take care and trade smart
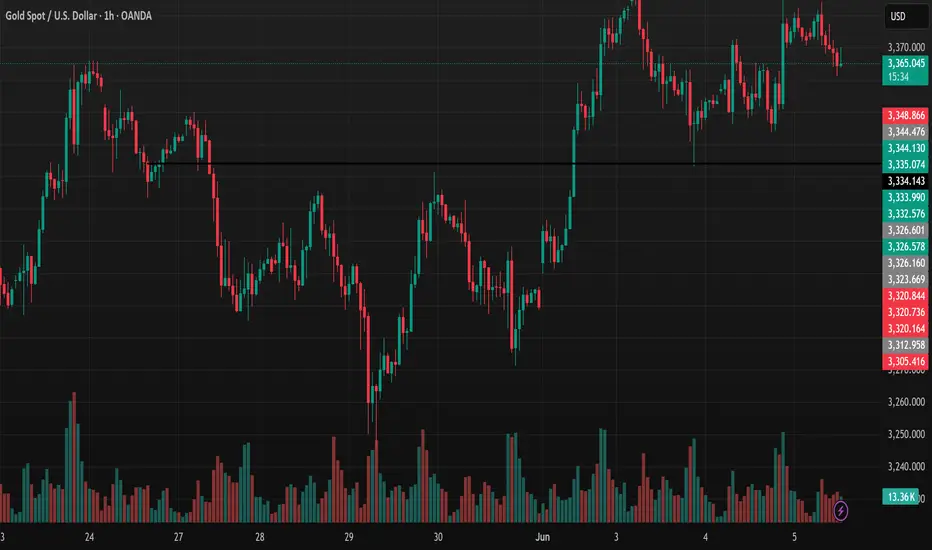
Gold Price Rises on Tariff Tensions and Geopolitical RisksGold jumped nearly 3% as President Trump announced plans to double tariffs on U.S. steel and aluminum imports to 50% starting June 4, fueling safe-haven demand and weakening the U.S. Dollar. The EU expressed strong regret and warned of potential countermeasures.
The rally continued on Tuesday (June 3) as geopolitical tensions escalated. Ukraine launched its largest drone attack on Russian airbases, while Moscow responded with long-range strikes on Kyiv. These events, combined with weak U.S. ISM Manufacturing PMI (May: 48.5, lowest since Nov), added to market anxiety.
Investors are watching the Fed’s upcoming statements for clues on rate direction. Lower interest rates and global instability continue to support gold’s bullish case.
Technical Outlook – XAUUSD
Gold hit $3,371, then pulled back slightly, but remains on track to reach $3,400 soon. A short-term bullish channel is forming, and RSI above 50 suggests more upside potential.
Pullbacks above the 21-day EMA and 0.382 Fibonacci level are likely temporary corrections or buy opportunities.
Support: 3,326 – 3,300 – 3,292
Resistance: 3,371 – 3,400 – 3,435

XAUUSD is currently displaying a classic upward trend structure
Welcome back, traders, to today’s gold market update!
XAUUSD is currently displaying a classic upward trend structure within a rising channel, signaling sustained bullish momentum. The price continues to form higher highs and higher lows—clear evidence that the uptrend remains intact. The recent pullback appears to be a healthy correction, potentially setting the stage for another leg higher.
At the moment, price is approaching a key support zone, marked by the lower boundary of the channel and a previous demand area. If this zone holds, it could present a strong re-entry opportunity for buyers, with the next bullish target projected around $3,450—aligning with both the midline of the ascending channel and a prior resistance level.
As long as the price remains above this support area and the rising trendline, the bullish scenario stays valid. However, a breakdown below this level could invalidate the setup and increase the likelihood of a deeper retracement.
Gold’s consolidation below $3,350 is partly due to the optimism following Trump’s decision to delay tariffs on EU goods, which has acted as a short-term drag on this safe-haven asset. Nonetheless, lingering U.S.-China trade tensions, persistent geopolitical uncertainties, expectations of Fed rate cuts, and broad weakness in the U.S. dollar continue to provide underlying support for gold in the medium term.
Thank you for tuning in, and wishing you successful and disciplined trading!
MT4 User Guide for BeginnersMetaTrader 4 (MT4) is a popular trading platform for Forex and gold markets. To get started, download the software from your broker’s website or install the MT4 app from the App Store or Google Play.
After installation, open the platform and log in using your account number, password, and the server provided by your broker. Once the bottom right corner shows “Connected,” you’re successfully logged in.
The MT4 interface includes: Market Watch (price list), Chart (candlestick chart), Terminal (order management), and Navigator (accounts and indicators). To open a chart, right-click on a symbol in Market Watch and select “Chart Window.” To add technical indicators, go to the Insert menu > Indicators.
To place an order, press F9 or right-click on the chart and choose “New Order,” then enter the volume and select Buy or Sell. You can also set Stop Loss and Take Profit levels if needed. For pending orders, choose the order type under “Pending Order,” set your desired price, and confirm.
To manage your trades, go to the “Trade” tab at the bottom where you can modify or close orders by right-clicking them. Trading history is available under the “Account History” tab.
MT4 supports chart customization, saving templates, and using advanced indicators. It’s a flexible platform suitable for both beginners and experienced traders. Practice regularly to master its features.
Good luck with your trading journey!
A wave of bargain hunting is giving short-term support to gold April’s U.S. CPI came in below expectations, cooling down hopes for Fed rate cuts. The U.S. Dollar index has also eased off its one-month high, while ongoing geopolitical concerns continue to back gold’s rise. On Wednesday morning (May 14), spot gold traded in a narrow range around $3,245 per ounce.
Inflation Data
April’s U.S. CPI rose only 0.2%, less than the expected 0.3%. This boosted gold as it doesn’t reduce the chances of Fed rate cuts, with markets still expecting cuts to continue in September. However, inflation could pick up again in the coming months due to tariff effects, so many investors still see gold as a solid hedge against inflation.
On Tuesday, both Do Nam Trung and Trump called on the Fed to cut rates.
Geopolitical Situation
Geopolitical tensions remain a strong support for gold. Talks between Ukraine and Russia are still uncertain, and although the India-Pakistan conflict has paused with a ceasefire, tensions haven’t eased much. These risks keep gold’s upside potential alive if markets face sudden shocks.
Gold Outlook
Gold faces three main challenges:
Progress in U.S.-China trade talks — even with a 90-day truce, tariffs remain in place.
Fed monetary policy — mild inflation data could pave the way for rate cuts.
Global geopolitical risks — especially the Russia-Ukraine peace talks and India-Pakistan tensions.
There’s little major economic data today. U.S. Secretary of State Rubio will attend a NATO meeting to discuss security priorities and the Russia-Ukraine war, while several Fed officials will speak, so investors should stay alert.
Technical Analysis (XAU/USD)
On the daily chart, gold is trading within a narrow range with short-term bearish pressure from the 21-day EMA. The 0.50 Fibonacci retracement near $3,228 is key support limiting further drops. If this level breaks, gold could fall toward $3,163.
For a new uptrend, gold needs to climb above the EMA21 and break through the $3,300 level.
Key levels to watch:
Support: 3,228 – 3,200 – 3,163 USD
Resistance: 3,245 – 3,292 – 3,300 USD
Wishing you a productive and successful trading day!
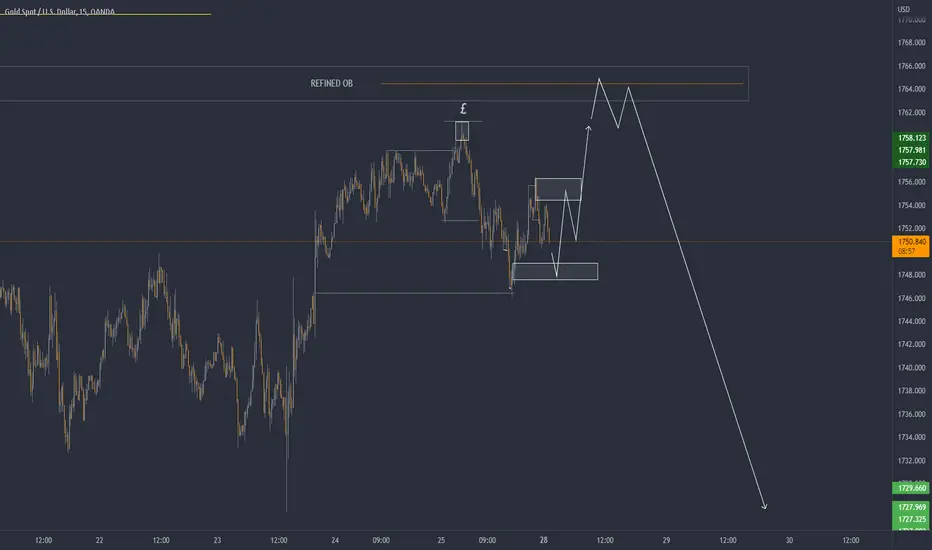
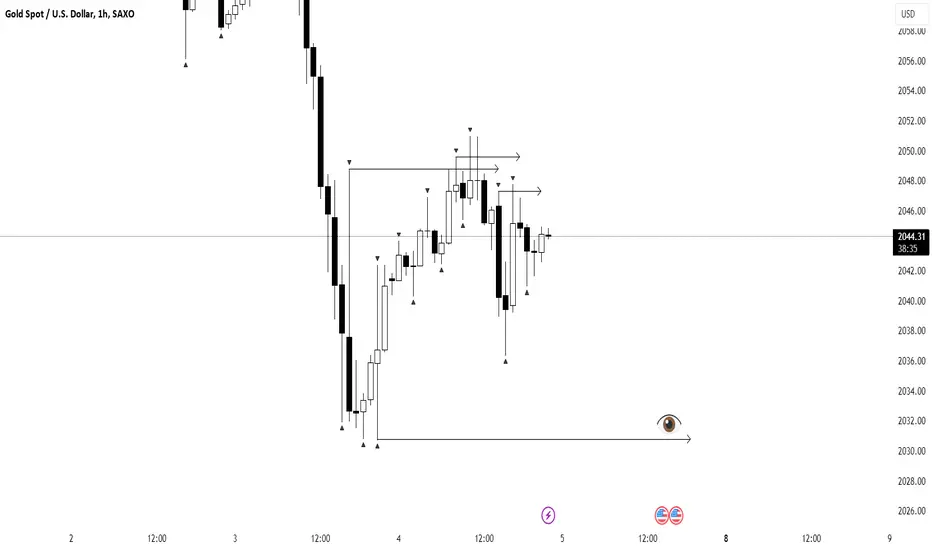
XAUUSD 1h1H - On the 1-hour timeframe, we are in a short direction, with the targets being the local low. It is also worth noting the emerging order flow, with a target at the minimum of 2030. The scenario will be invalidated if the price closes above 2050.
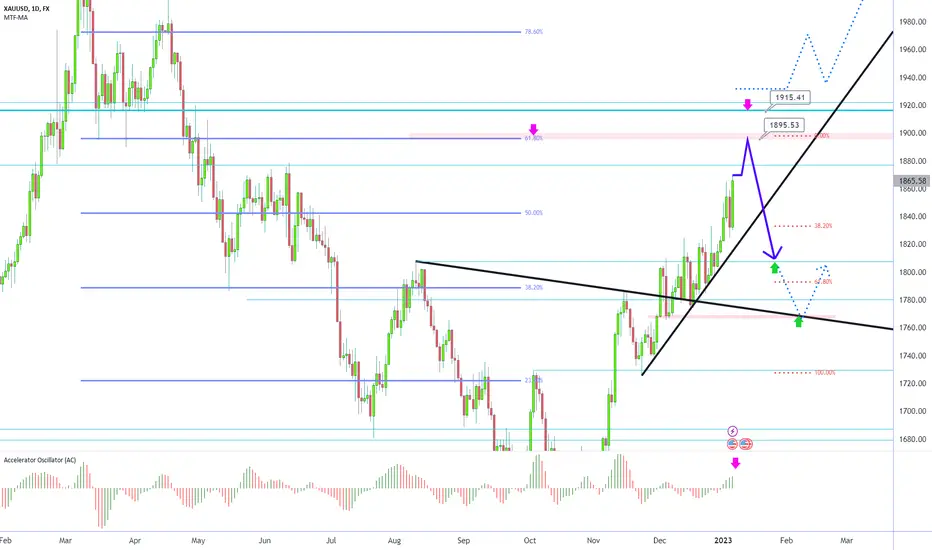
Gold daily chart say : fibo 61% 1895 is upper target see AC indicator going to full g and can turn red and down tend can start
put buystop on high is good idea but very low size and with sl
near fibo61% under that 2 red arrow i will looking for sell but after PINBAR comes on 1h-4h-daily chart ,i will sell ok? 100% put sl on pinbar high always (trends up and gold is super trendy can go to 2350-24000)
i have buy from 1730 from 30 days ago willl close them i 1895 , then sell i will hold my sell 2 week until near 1800 area
ALERT=break 1925 support can fly up to 2350 (fibo 161%)
if you have old sells put buystop on friday high ,break last high is new buy signal
wish you win , stand on very very low size ,big size= loss in this game
Trade Gold indicator support Multi Modeindicator support signal trade for Gold and forex
Trend :
EMA Trend Fibonacci (5EMA 13,21,55,89,144)
Stoch Rsi trend
Trade Zone option:
AO and AC for Trade Zone with EMA200
Engulfing Candle:
Auto detect Engulfing Candle
Signal BUY/SELL for Engulfing
Trade Signal Support:
Multi Strategy in One indicator
1. CCI and ATR
2. Stoch RSI
3. Bollinger Bands
4. Engulfing Candle
5. AOAC TradeZone
... and updating
Multi Symbol and Multi Time Frame:
Gold, Forex, Crystal and ... symbol
Single/Multi Time Frame:
M15, M30, H1, H4, D1
Multi Alert:
Single Alert in current symbol or list symbol and Timeframe
Support get any Alert from any indicator in chart.
indicator under development and completion
follow me for get new update.

XAUUSD long to shortVery possible setup on gold here we will watch pour zones to see how price reacts!
Always remember if price shows us something different, we will follow that movement....
LIKE THIS IDEA? SHOW US BY HITTING THAT LIKE & SHARE!