22.04.25 Morning ForecastPairs on Watch -
FX:AUS200
FX:AUDUSD
FX:EURUSD
FX:GBPUSD
A short overview of the instruments I am looking at for today, multi-timeframe analysis down to what I will be looking at for an entry. Enjoy!
Trade

EUR/USD Neutral, AUD/USD Neutral and EUR/AUD (Trade Recap)EUR/USD Neutral
Minimum entry requirements:
• 1H impulse down below area of interest.
• If tight non-structured 5 min continuation follows, reduced risk entry on the break of it.
• If tight structured 5 min continuation follows, reduced risk entry on the break of it or 5 min risk entry within it.
• If tight non-structured 15 min continuation follows, 5 min risk entry within it if the continuation is structured on the 5 min chart or reduced risk entry on the break of it.
• If tight structured 15 min continuation follows, reduced risk entry on the break of it or 15 min risk entry within it.
Minimum entry requirements:
• If structured 1H continuation forms, 1H risk entry within it.
AUD/USD Neutral
Minimum entry requirements:
• 1H impulse down below area of interest.
• If tight non-structured 5 min continuation follows, reduced risk entry on the break of it.
• If tight structured 5 min continuation follows, reduced risk entry on the break of it or 5 min risk entry within it.
• If tight non-structured 15 min continuation follows, 5 min risk entry within it if the continuation is structured on the 5 min chart or reduced risk entry on the break of it.
• If tight structured 15 min continuation follows, reduced risk entry on the break of it or 15 min risk entry within it.
Minimum entry requirements:
• If structured 1H continuation forms, 1H risk entry within it.

NZDJPY short oportunityWatch for end of retracment trade!
I think this can be good RR oportunity, the Target is to Low of previousextension.
On 4 chart we are already see some bearih divergances, But still in uptrend. Soo wiat for some kind of confirmation.
Trade safe ;)
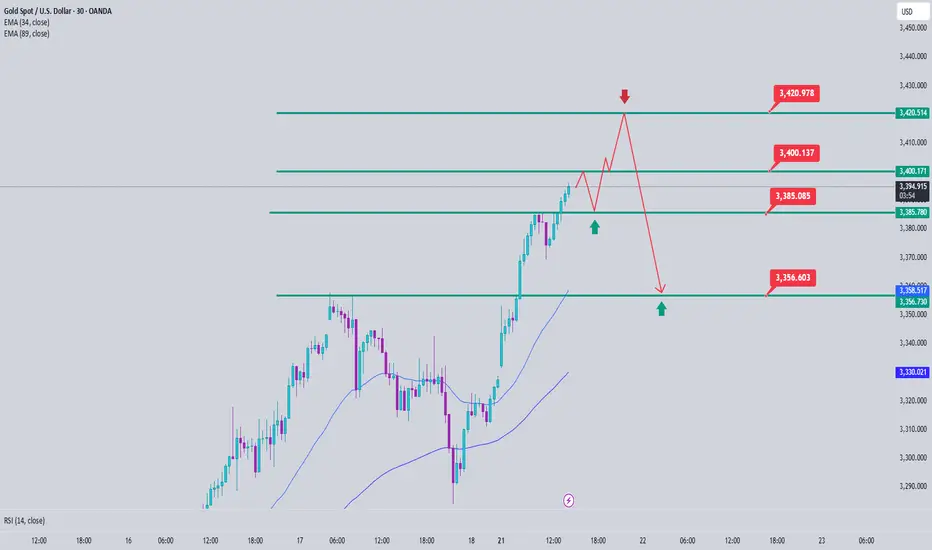
Gold Price Analysis April 21Gold price is currently at ATH and trading strategy is difficult. Gold is facing the round port level of 3400 and the lower boundary is the Break out zone around 3386. Any pullback of gold is considered as an opportunity to buy 3420 can be considered as today's boundary.
EUR/USD Short, AUD/USD Short and EUR/AUD Short (Trade Recap)EUR/USD Short
Minimum entry requirements:
• 1H impulse down below area of interest.
• If tight non-structured 5 min continuation follows, reduced risk entry on the break of it.
• If tight structured 5 min continuation follows, reduced risk entry on the break of it or 5 min risk entry within it.
• If tight non-structured 15 min continuation follows, 5 min risk entry within it if the continuation is structured on the 5 min chart or reduced risk entry on the break of it.
• If tight structured 15 min continuation follows, reduced risk entry on the break of it or 15 min risk entry within it.
AUD/USD Short
Minimum entry requirements:
• Break above area of value.
• 1H impulse down below area of interest.
• If tight non-structured 5 min continuation follows, reduced risk entry on the break of it.
• If tight structured 5 min continuation follows, reduced risk entry on the break of it or 5 min risk entry within it.
• If tight non-structured 15 min continuation follows, 5 min risk entry within it if the continuation is structured on the 5 min chart or reduced risk entry on the break of it.
• If tight structured 15 min continuation follows, reduced risk entry on the break of it or 15 min risk entry within it.
EUR/AUD Short
Minimum entry requirements:
• Corrective tap into area of value.
• 4H risk entry or 1H risk entry after 2 x 1H rejection candles.
Minimum entry requirements:
• Tap into area of value.
• 1H impulse down below area of value.
• If tight non-structured 5 min continuation follows, reduced risk entry on the break of it.
• If tight structured 5 min continuation follows, reduced risk entry on the break of it or 5 min risk entry within it.
• If tight non-structured 15 min continuation follows, 5 min risk entry within it if the continuation is structured on the 5 min chart or reduced risk entry on the break of it.
• If tight structured 15 min continuation follows, reduced risk entry on the break of it or 15 min risk entry within it.

21.04.25 Morning ForecastPairs on Watch -
FX:EURNZD
FX:EURAUD
FX:EURUSD
FX:AUDUSD
A short overview of the instruments I am looking at for today, multi-timeframe analysis down to what I will be looking at for an entry. Enjoy!

XAGUSD - Retest of Local Top Likely to Precede Deeper CorrectionSilver has staged an impressive recovery from its early April low near $2,830, rallying back toward the key psychological level of $3,300. Currently, price action suggests we'll see a final push higher into the resistance zone highlighted in blue (approximately $3,300-$3,320) before encountering significant selling pressure. This anticipated pullback makes technical sense considering the speed of the recent recovery and the horizontal resistance level at $3,250, which has historically acted as a significant pivot point. Traders should exercise caution as silver approaches this resistance zone, as exhaustion signals may soon emerge after this rapid recovery phase, potentially offering favorable short-entry opportunities once the retest completes.
Disclosure: I am part of Trade Nation's Influencer program and receive a monthly fee for using their TradingView charts in my analysis.

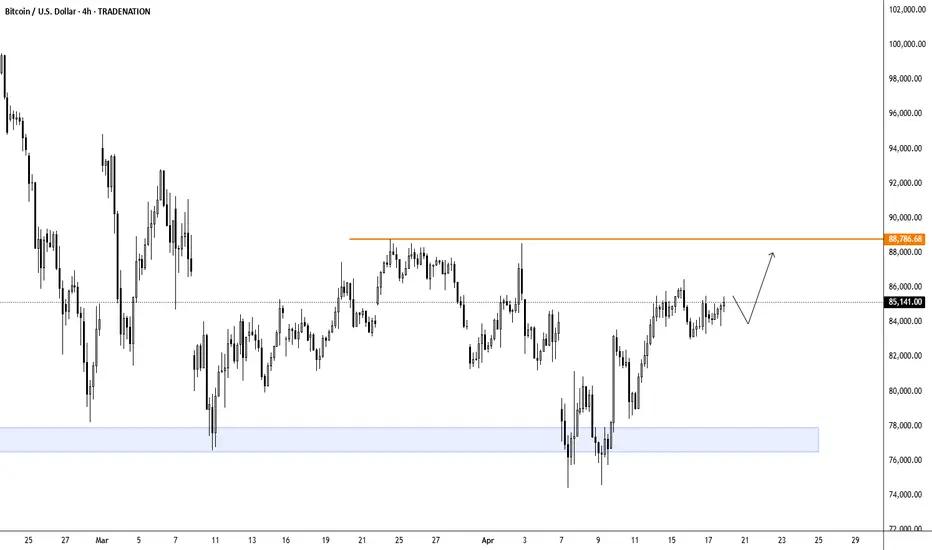
BTCUSD - Technical Structure Shows Bullish Continuation AheadBitcoin is currently showing signs of strength as it consolidates around the $85,000 level, with technical evidence suggesting a higher probability move to the upside. The chart depicts a recovery from the recent support zone (highlighted in blue) around $76,000-$77,000, with price action forming a series of higher lows since early April. While some short-term volatility may persist, the overall structure appears bullish as BTC continues to hold above the critical $85,000 horizontal level. Traders should watch for a potential pullback before the anticipated upward continuation, as suggested by the brief downward movement in the arrow pattern, which could offer an attractive entry opportunity before the next leg higher.
Disclosure: I am part of Trade Nation's Influencer program and receive a monthly fee for using their TradingView charts in my analysis.
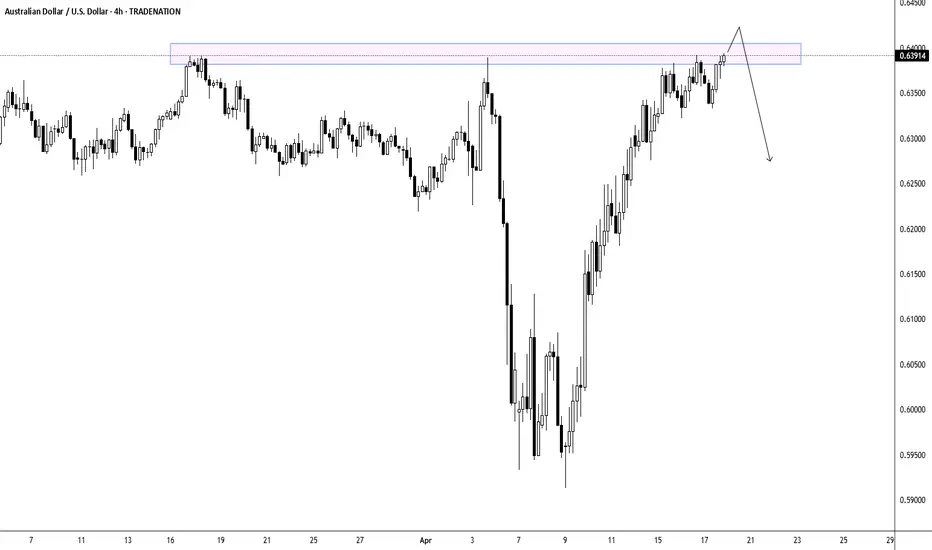
AUDUSD - Resistance Test Points to Imminent Price CorrectionThe AUD/USD pair has shown impressive upside momentum in recent days, recovering sharply from its early April lows near 0.5900 to now testing the key resistance zone highlighted in blue around 0.6400. After such a substantial rally of approximately 500 pips, technical indicators suggest the pair is becoming overextended in the short term. We anticipate a corrective pullback as price encounters this significant resistance level, which previously acted as support in mid-March. This correction would be a healthy development within the broader market structure, potentially setting up better entry opportunities for those still bullish on the Australian dollar in the medium term.
Disclosure: I am part of Trade Nation's Influencer program and receive a monthly fee for using their TradingView charts in my analysis.
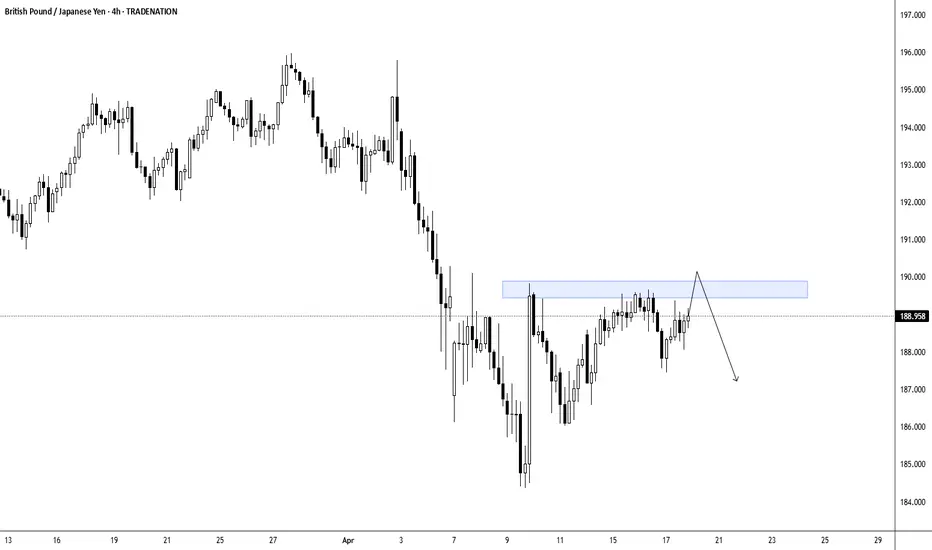
GBPJPY - Sell Opportunity Following Resistance Test?Based on the 4-hour chart of GBP/JPY, the pair has been consolidating within a range after a significant decline from the 195.00 area. The currency is currently testing resistance around the 189.00 level, marked by the blue highlighted zone. We anticipate a temporary break above this consolidation zone as price completes a correction, which would offer an attractive selling opportunity. Traders should watch for price action confirmation after the break above the zone before entering short positions, as the broader trend appears to remain bearish.
Disclosure: I am part of Trade Nation's Influencer program and receive a monthly fee for using their TradingView charts in my analysis.
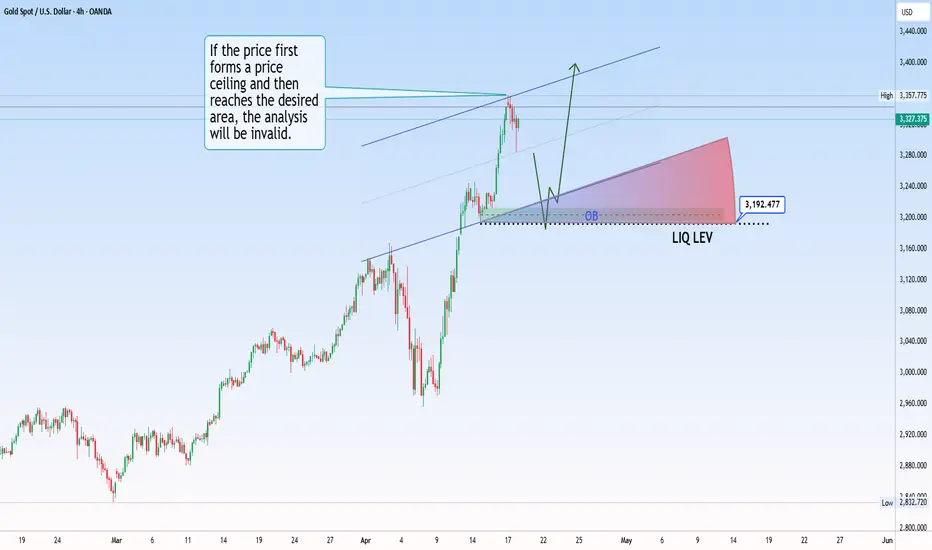
GOLD 4H ANALYZEHello dear traders,
I’ve been away for a while, but I’m back now to share fresh market analysis and trading signals.
As you can see on the gold (XAUUSD) chart, we’re continuously seeing the formation of new price highs. Every price correction in key zones can offer a great buying opportunity.
The price range between 3190 and 3195 is a high-potential buying area.
Make sure to pay attention to the note highlighted in the image.
Wishing you all success and happiness!
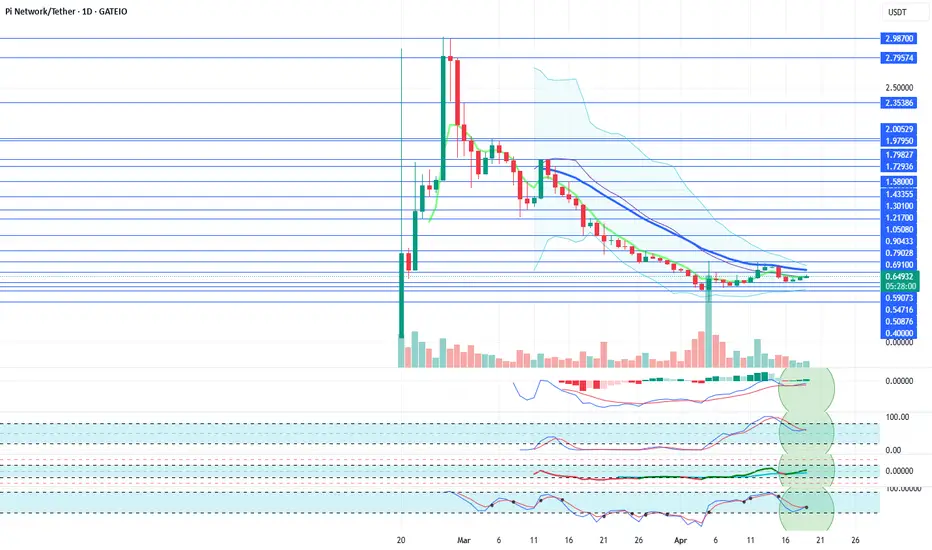
PIUSDT Daily Technical AnalysisPIUSDT Daily Technical Analysis
Pi Network Coin indicators are POSITIVE.
On April 14th, Pi Network Coin faced a strong sell-off after failing to break above the 21-day moving average (0.75121), dropping down to the support level at 0.59073 before attempting to recover. If this support holds, it may test the 21-day moving average (now at 0.71713) again. If it can rise above this level, it will also break through the 0.69100 resistance at the same time. Overall, we can say that Pi Network Coin has halted its downtrend and increased the probability of a new upward move. Positive news from the Pi Network team could support a price increase. At these price levels, accumulating Pi Network Coin for long-term investment might be a reasonable decision. The final decision is yours. In the medium term, there's also a possibility that Pi Network Coin could retest the $3 level.
For users of the Pi app who have locked coins, if there's no urgent need, they can choose to relock their coins for another 2-week period instead of selling. They can then track the price every two weeks and decide to relock again if appropriate. The long-term potential for the price to reach much higher levels still remains strong.
THIS IS NOT INVESTMENT ADVICE.
The information, comments, and recommendations here do not constitute investment advice. Investment advisory services are provided within the framework of an agreement to be signed between the investor and brokerage firms, portfolio management companies, or non-deposit-taking banks. The content shared here reflects only personal opinions. These views may not be suitable for your financial situation, risk, and return preferences. Therefore, no investment decisions should be made solely based on this content.
If you'd like to avoid missing out on our technical analyses with positive or risky indicators, please follow and like us — we'd appreciate your support!
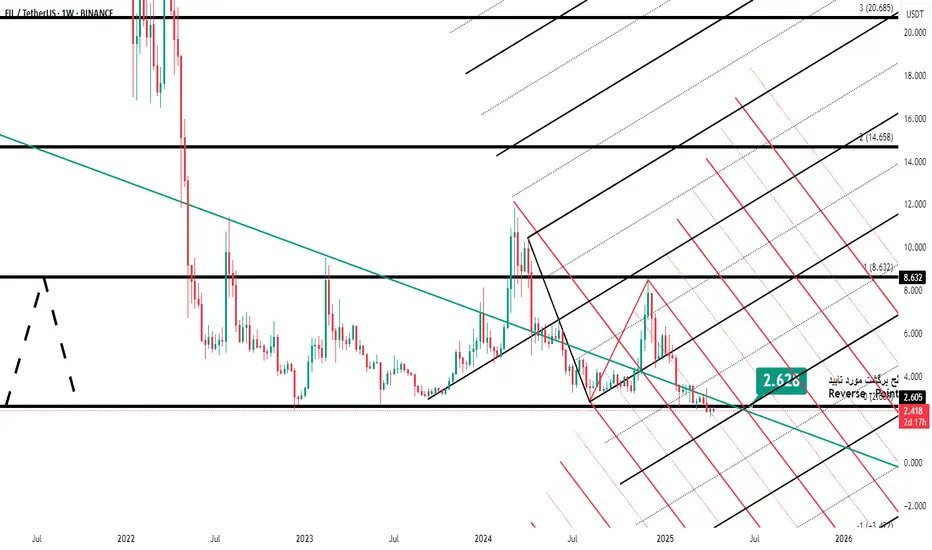
FILUSDT-Analysis-WeeeklyIn the Weekly timeframe FILUSDT reached a powerful reverse point
** No FUTURES **
Target = 7.5$
18.04.25 Morning ForecastPairs on Watch -
FX:NZDUSD
FX:AUDUSD
FX:EURNZD
FX:USDJPY
A short overview of the instruments I am looking at for today, multi-timeframe analysis down to what I will be looking at for an entry. Enjoy!

EUR/NZD Short, GBP/USD Long, AUD/USD Short and GBP/AUD ShortEUR/NZD Short
Minimum entry requirements:
• Corrective tap into area of value.
• 4H risk entry or 1H risk entry after 2 x 1H rejection candles.
Minimum entry requirements:
• Tap into area of value.
• 1H impulse down below area of value.
• If tight non-structured 5 min continuation follows, reduced risk entry on the break of it.
• If tight structured 5 min continuation follows, reduced risk entry on the break of it or 5 min risk entry within it.
• If tight non-structured 15 min continuation follows, 5 min risk entry within it if the continuation is structured on the 5 min chart or reduced risk entry on the break of it.
• If tight structured 15 min continuation follows, reduced risk entry on the break of it or 15 min risk entry within it.
GBP/USD Long
Minimum entry requirements:
• Corrective tap into area of value.
• 4H risk entry or 1H risk entry after 2 x 1H rejection candles.
Minimum entry requirements:
• Tap into area of value.
• 1H impulse up above area of value.
• If tight non-structured 5 min continuation follows, reduced risk entry on the break of it.
• If tight structured 5 min continuation follows, reduced risk entry on the break of it or 5 min risk entry within it.
• If tight non-structured 15 min continuation follows, 5 min risk entry within it if the continuation is structured on the 5 min chart or reduced risk entry on the break of it.
• If tight structured 15 min continuation follows, reduced risk entry on the break of it or 15 min risk entry within it.
AUD/USD Short
Minimum entry requirements:
• Break above area of value.
• 1H impulse down below area of interest.
• If tight non-structured 5 min continuation follows, reduced risk entry on the break of it.
• If tight structured 5 min continuation follows, reduced risk entry on the break of it or 5 min risk entry within it.
• If tight non-structured 15 min continuation follows, 5 min risk entry within it if the continuation is structured on the 5 min chart or reduced risk entry on the break of it.
• If tight structured 15 min continuation follows, reduced risk entry on the break of it or 15 min risk entry within it.
GBP/AUD Short
Minimum entry requirements:
• Corrective tap into area of value.
• 4H risk entry or 1H risk entry after 2 x 1H rejection candles.
Minimum entry requirements:
• Tap into area of value.
• 1H impulse down below area of value.
• If tight non-structured 5 min continuation follows, reduced risk entry on the break of it.
• If tight structured 5 min continuation follows, reduced risk entry on the break of it or 5 min risk entry within it.
• If tight non-structured 15 min continuation follows, 5 min risk entry within it if the continuation is structured on the 5 min chart or reduced risk entry on the break of it.
• If tight structured 15 min continuation follows, reduced risk entry on the break of it or 15 min risk entry within it.

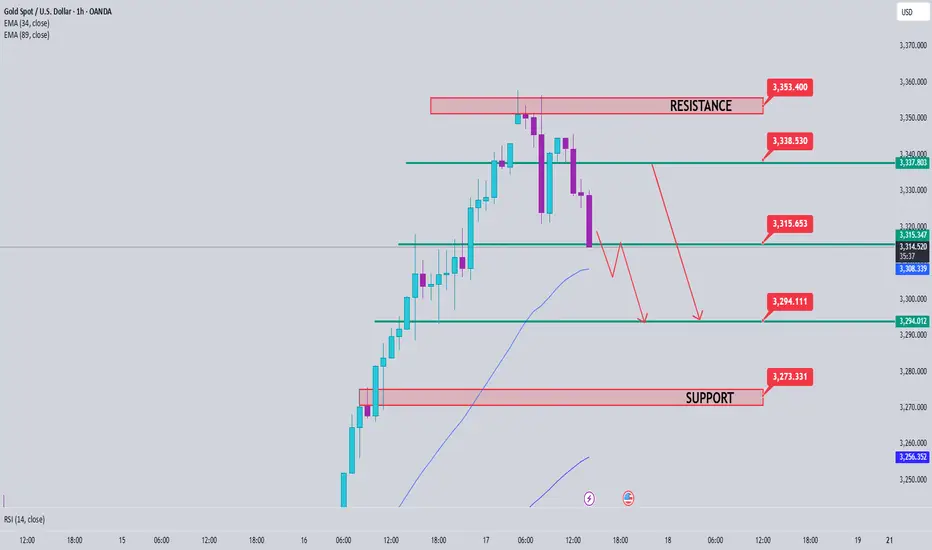
Gold Analysis April 17Another day of half-full D candle increase but today there is a bearish wave appearing
The h4 frame has shown signs of sellers jumping into the market and H1 also formed bearish waves.
The bearish wave formed with support 3322. Breaking 3322 is very easy to form a strong bearish wave but the necessary condition is that the 3315 zone will have to be broken. If 3315 increases, 3338 is the zone that the Sellers are also waiting for. 3354-3355 ATH zone will still have a reaction from the Sellers before creating a new ATH.
Trading zone when there is confirmation
Price zones to pay attention to BUY 3315, 3293, 3275
Price zones to pay attention to SELL 3337, 3354
Trading opportunity for COWUSDTBased on technical factors there is a Sell position in :
📊 COWUSDT
🔴 Sell Now
🪫Stop loss 0.3620
🔋Target 0.1900
📏 R/R 1,2
💸RISK : 1%
We hope it is profitable for you ❤️
Please support our activity with your likes👍 and comments📝

17.04.25 Morning ForecastPairs on Watch -
FX:GBPCAD
FX:EURAUD
FX:GBPAUD
A short overview of the instruments I am looking at for today, multi-timeframe analysis down to what I will be looking at for an entry. Enjoy!

Gold Price Analysis April 16Gold price is at ATH and no stopping point is seen
safe trading strategy can only be waiting for retest of strong buying zones to BUY
There is no specific strategy when gold is at the current price range. Today's strategy focuses on Buy around 3275-3273. The best zone to BUY today is 3246-3244. 3313 is a notable Fibonacci resistance zone, breaking this zone Gold will head to the next Fibonacci zone around 3350.
wish you a successful trading day.

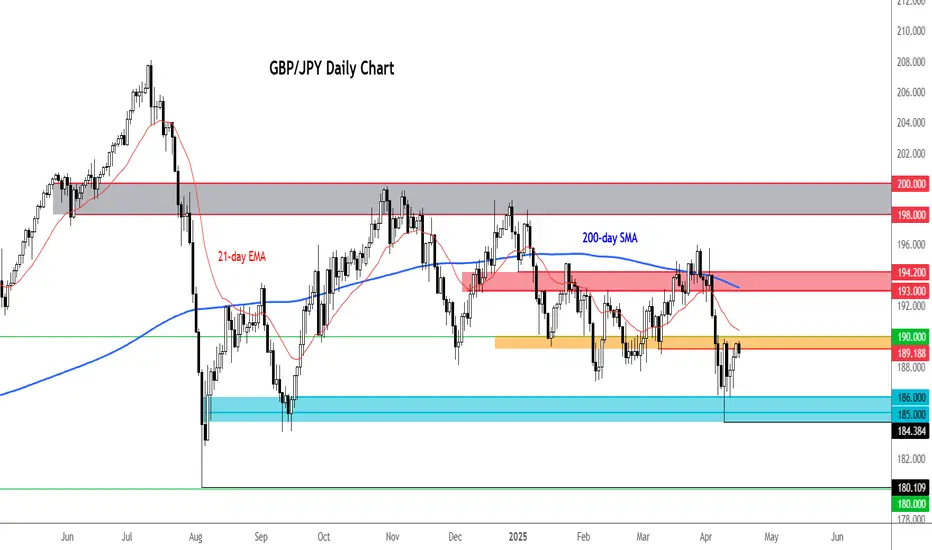
GBP/JPY testing critical zoneThe GBP/JPY is testing a critical resistance area between 189.20 to 190.00. For as long as this area holds as resistance, the path of least resistance remains to the downside.
Should the selling resume from here, we could see the Guppy trade down to test the key support range between 185.00 to 186.00 again.
However, if the GBP/JPY breaks decisively above the 189.20 to 190.00 range, then that could potentially pave the way for a short-squeeze rally towards the next major resistance in the 193.00 to 194.20 range, where we also have the 200 day MA converging.
By Fawad Razaqzada, market analyst with FOREX.com
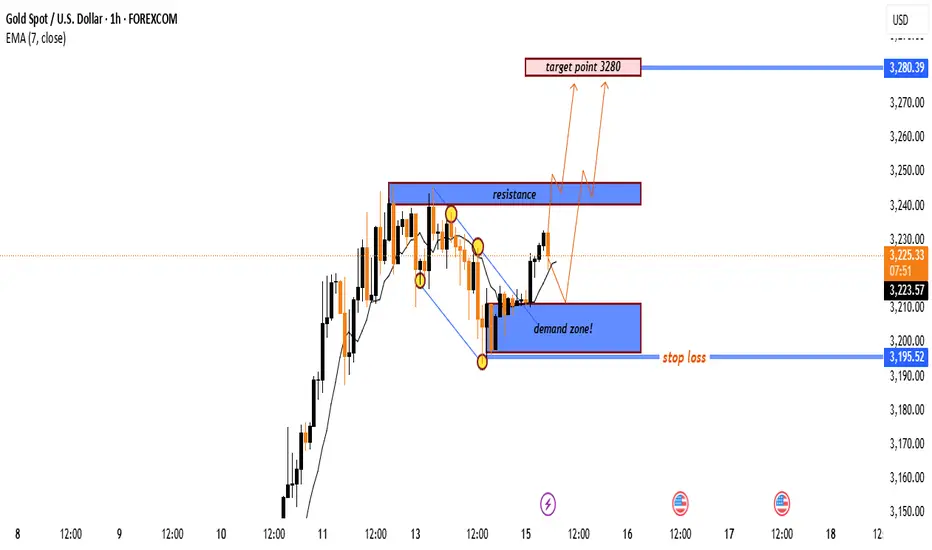
"Gold Bullish Setup: From Demand Zone to 3280 Target!"🟦 Key Zones
🔵 Demand Zone (Support):
📍 Around 3,210 – 3,200
🟢 Buyers stepped in here previously, forming a base for a potential upmove.
🔴 Resistance Zone:
📍 Around 3,240 – 3,250
🚫 Sellers have rejected price from this level several times.
🎯 Target Point:
📍 3280
🚀 If price breaks resistance, this is the expected move.
❌ Stop Loss:
📍 3,195.52
🛡️ Placed just below the demand zone to minimize downside risk.
📊 Price Action & Indicators
* 🟠 Current Price: 3,225.32
* 📉 EMA (7): 3,223.57 – providing dynamic support
* 🔼 Trend: Short-term uptrend with higher lows
🧠 Trade Idea
* ✅ Entry: Around 3,220–3,225
* ❌ Stop Loss: 3,195.52
* 🎯 Take Profit: 3,280
* 📌 Risk-Reward: Favorable if resistance breaks
📈 Possible Scenarios
🔸 Scenario 1:
✨ Immediate breakout through resistance → target 3,280
🔸 Scenario 2:
🔁 Pullback to demand zone → bounce → then move toward 3,280
16.04.25 Morning ForecastPairs on Watch -
FX:CHFJPY
FX:GBPAUD
FX:EURNZD
FX:USDJPY
A short overview of the instruments I am looking at for today, multi-timeframe analysis down to what I will be looking at for an entry. Enjoy!

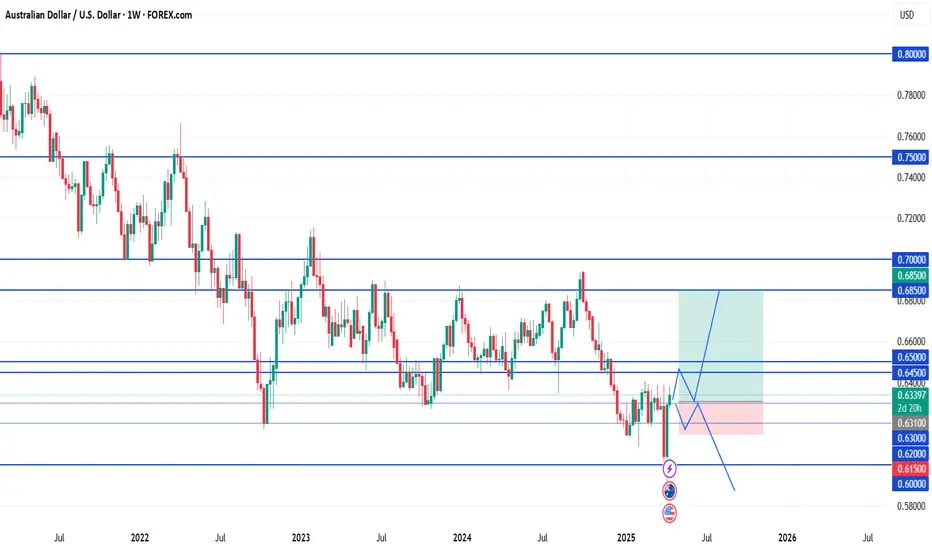
AUD/USD⚔️ Strategy Options:
🟢 Bullish Tactical Play (Range Swing):
Only valid if price closes weekly above 0.6450.
Entry: Buy limit on retest of 0.6310
SL: 0.6150
TP1: 0.6500
TP2: 0.6850
This is a short-term retracement play against a longer-term bearish trend.
🔴 Bearish Trend Continuation:
Ideal if weekly closes below 0.6200
Entry: Sell retrace at 0.6300
SL: 0.6460
TP1: 0.6000
TP2: 0.5800–0.5650
This aligns with macro pressure (risk-off + China slowdown) and offers clean structure.