USD/JPY Short, AUD/NZD Short, AUD/JPY Neutral and EUR/USD ShortUSD/JPY Short
Minimum entry requirements:
- If tight non-structured 5 min continuation forms, reduced risk entry on the break of it.
- If tight structured 5 min continuation forms, reduced risk entry on the break of it or 5 min risk entry within it.
- If tight non-structured 15 min continuation forms, 5 min risk entry within it if the continuation is structured on the 5 min chart or reduced risk entry on the break of it.
- If tight structured 15 min continuation forms, reduced risk entry on the break of it or 15 min risk entry within it.
AUD/NZD Short
Minimum entry requirements:
- If tight non-structured 15 min continuation forms, 5 min risk entry within it if the continuation is structured on the 5 min chart or reduced risk entry on the break of it.
- If tight structured 15 min continuation forms, reduced risk entry on the break of it or 15 min risk entry within it.
AUD/JPY Neutral
Minimum entry requirements:
- If structured 1H continuation forms, 1H risk entry within it.
Minimum entry requirements:
- 1H impulse down below area of value.
- If tight non-structured 5 min continuation follows, reduced risk entry on the break of it.
- If tight structured 5 min continuation follows, reduced risk entry on the break of it or 5 min risk entry within it.
- If tight non-structured 15 min continuation follows, 5 min risk entry within it if the continuation is structured on the 5 min chart or reduced risk entry on the break of it.
- If tight structured 15 min continuation follows, reduced risk entry on the break of it or 15 min risk entry within it.
EUR/USD Short
Minimum entry requirements:
- Tap into area of value.
- 1H impulse down below area of value.
- If tight non-structured 15 min continuation follows, 5 min risk entry within it if the continuation is structured on the 5 min chart or reduced risk entry on the break of it.
- If tight structured 15 min continuation follows, reduced risk entry on the break of it or 15 min risk entry within it.
Trade

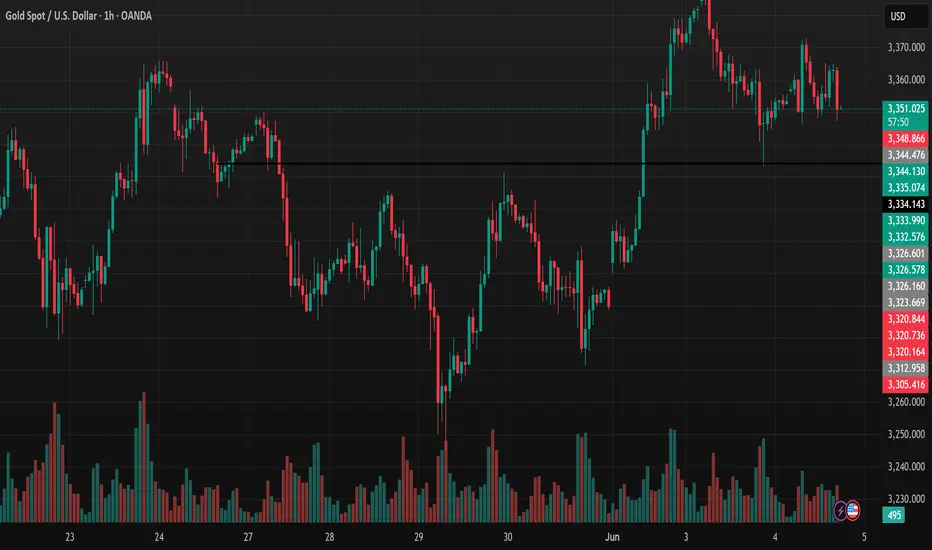
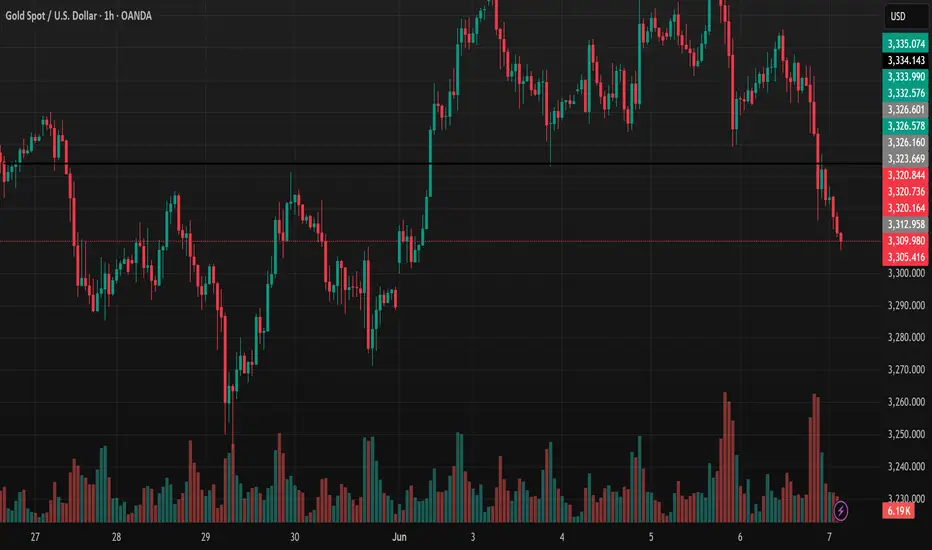
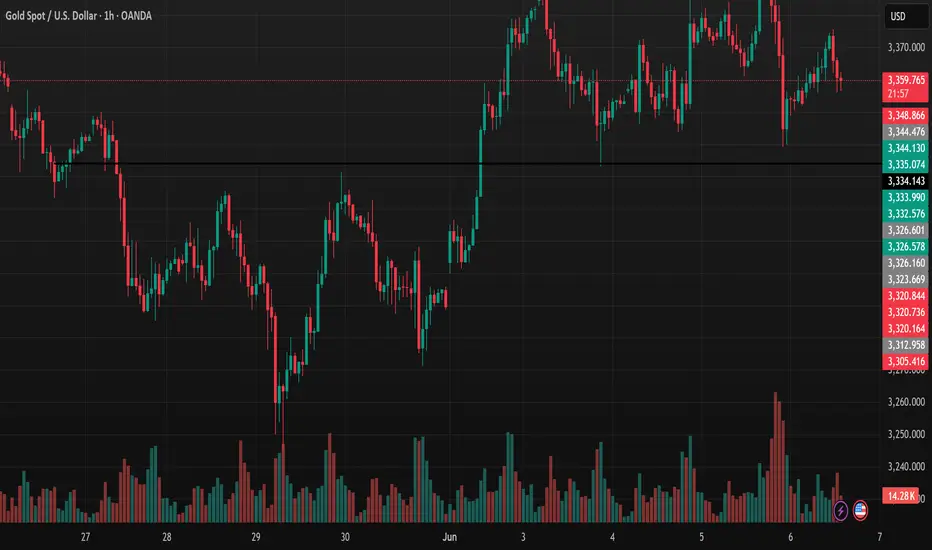
Gold Price XAU/USD: Downtrend and OpportunitiesGold FX:XAUUSD Price XAU/USD Analysis Today: Downtrend Signals, What Opportunities for Investors? Updated at 13:57 on 09/06/2025 (+07) - The 1-hour trading view chart for the XAU/USD (Gold Spot / U.S. Dollar) pair indicates that gold prices are experiencing a significant decline, drawing attention from investors. Let’s dive into a detailed analysis of the current trend and short-term outlook based on the latest data.
Current Gold Price and Recent Movements According to the chart, the spot gold price is currently fluctuating around 3.322.44 USD/ounce, down 0.24% in the latest trading session (as of 13:56 UTC-7). The highest point in the past hour reached 3.323.020 USD, while the lowest was 3.312.570 USD. A clear downtrend began from a local peak near 3.344.70 USD, with dominant red candlesticks reflecting strong selling pressure.
Technical Analysis Support and Resistance: The nearest support level is around 3.300 USD, where the price may find buying interest to rebound. The next key resistance level is 3.350 USD, a threshold that the price has failed to break in the recent session. If selling pressure persists, a deeper support level could be 3.280 USD. Trading Volume: Trading volume spiked during the decline, particularly between 6 AM and 7 AM (UTC), indicating significant participation from investors offloading their positions. Market Momentum: The price is currently below the short-term moving average, signaling a bearish trend in the short term. However, if the price holds above 3.300 USD, it could open opportunities for a recovery toward 3.330-3.350 USD. Factors Influencing Gold Prices Recent U.S. economic data, particularly the non-farm payrolls report, may be the primary driver behind the pressure on gold prices. A stronger U.S. dollar and rising bond yields have reduced gold’s appeal. Additionally, global market sentiment, including geopolitical factors and the upcoming CPI data release on June 11, 2025, will also impact the next trend.
Outlook and Investment Suggestions Short-Term: With the current decline, investors might consider buying in the support zone of 3.300 USD if reversal signals appear (e.g., a strong bullish candlestick or increased buying volume). However, caution is advised if the price breaks below 3.280 USD. Long-Term: The bullish trend for gold remains intact due to demand from central banks and its role as a safe-haven asset. This could be an opportunity to accumulate if the price corrects further. Conclusion The XAU/USD gold price is facing downward pressure in today’s trading session, but the 3.300 USD support level is a critical point to watch closely. Investors should combine technical analysis with economic news to make informed decisions. Stay updated regularly to seize opportunities in this volatile market!
SEO Keywords: Gold price today, XAU/USD analysis, gold price forecast 2025, gold investment, gold support and resistance, latest gold news.
09.06.25 Morning ForecastPairs on Watch -
FX:USDJPY
FX:AUDNZD
FX:AUDJPY
FX:CHFJPY
A short overview of the instruments I am looking at for today, multi-timeframe analysis down to what I will be looking at for an entry. Enjoy!

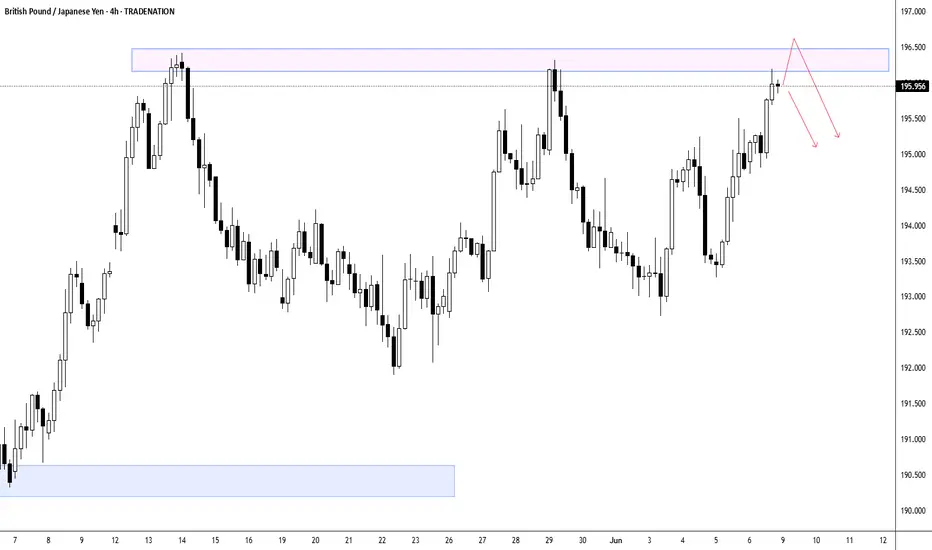
GBPJPY - Major Resistance Zone Threatens Further UpsideThe GBP/JPY 4-hour chart reveals the pair is approaching a critical resistance zone around the 196.00-196.50 level, marked by the upper boundary of the highlighted rectangular area, which represents a significant technical ceiling that has been tested multiple times over the past month. This resistance level coincides with previous swing highs and appears to be acting as a formidable barrier to further upside progress, suggesting that traders should exercise heightened caution as selling pressure is likely to intensify in this area. The pair's recent rally from the May lows around 190.50 has been impressive, but the multiple rejections from this upper resistance zone indicate that institutional sellers may be positioned to defend these levels aggressively. Given the historical significance of this resistance area and the potential for profit-taking after the substantial advance, market participants should be prepared for increased volatility and possible reversal signals as the pair approaches or tests this key technical barrier, making risk management particularly crucial at current levels.
Disclosure: I am part of Trade Nation's Influencer program and receive a monthly fee for using their TradingView charts in my analysis.
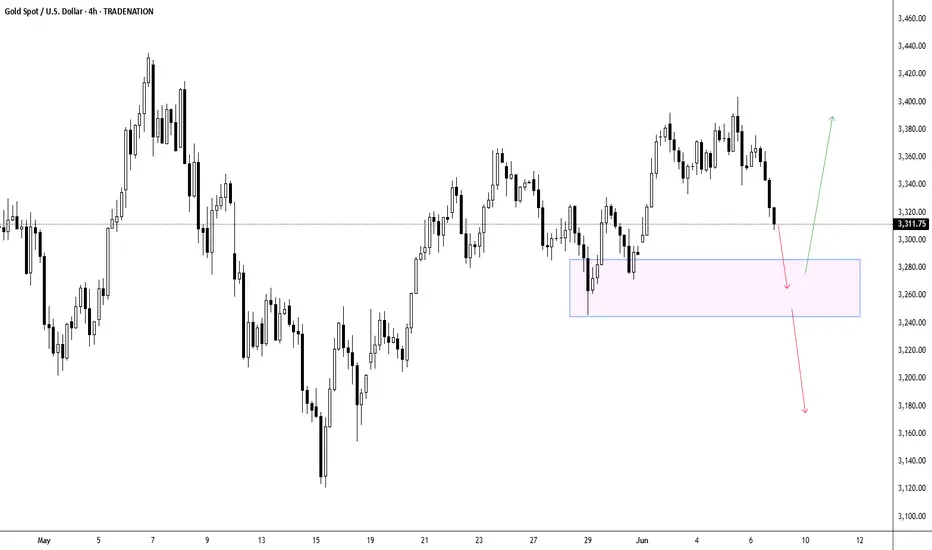
XAUUSD - $3,260 Support Level to Determine Next Directional MoveLooking at this Gold 4-hour chart, the precious metal is approaching a critical inflection point as it tests the key support zone around $3,260, which represents a confluence of previous swing lows and represents the lower boundary of the recent consolidation range. Two distinct scenarios emerge from this technical setup: first, gold could find buyers at this support level and stage a bounce back toward the $3,400 resistance area, particularly if broader market conditions favor safe-haven assets or if dollar weakness provides additional tailwinds for the metal. Alternatively, a decisive break below the $3,260 support could trigger further selling pressure and open the door for a deeper correction toward the $3,180-$3,160 zone, especially if risk appetite improves or if stronger economic data reduces demand for defensive assets. The outcome will largely depend on how price action unfolds at this crucial support level, with volume and momentum providing key clues about which scenario is more likely to play out in the near term.
Disclosure: I am part of Trade Nation's Influencer program and receive a monthly fee for using their TradingView charts in my analysis.
BTCUSD - Technical Setup Points to Renewed UpsideLooking at this Bitcoin/USD daily chart, the technical setup strongly favors upside continuation despite the recent pullback from the $113,000 highs. The cryptocurrency has demonstrated remarkable resilience by maintaining support above the $100,000 psychological level after its dramatic surge from the March lows around $60,000, representing an 80%+ rally that established a clear bullish trend structure. The current consolidation pattern around $104,000 appears to be a healthy correction within the broader uptrend, with the green arrow projection suggesting potential for further gains toward the $115,000+ region. Key supporting factors include the sustained break above multiple resistance levels, the formation of higher lows throughout the uptrend, and the relatively shallow nature of the current pullback compared to the magnitude of the preceding advance. While short-term volatility remains elevated, the overall momentum and trend structure indicate that buyers are likely to step in on any weakness, making a resumption of the uptrend the higher probability scenario.
Disclosure: I am part of Trade Nation's Influencer program and receive a monthly fee for using their TradingView charts in my analysis.

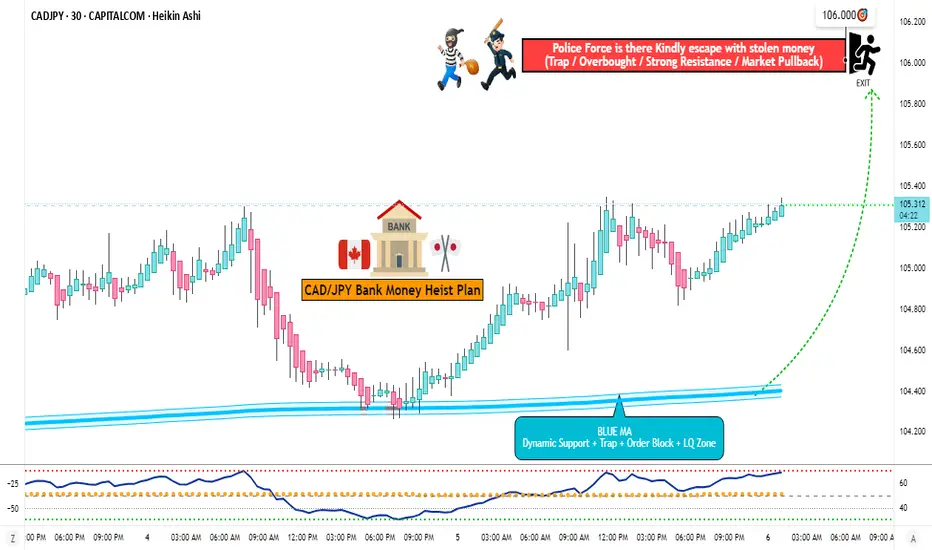
CAD/JPY "Loonie-Yen" Forex Bank Bullish Heist Plan🌟Hi! Hola! Ola! Bonjour! Hallo! Marhaba!🌟
Dear Money Makers & Robbers, 🤑 💰💸✈️
Based on 🔥Thief Trading style technical and fundamental analysis🔥, here is our master plan to heist the CAD/JPY "Loonie-Yen" Forex Bank. Please adhere to the strategy I've outlined in the chart, which emphasizes long entry. Our aim is the high-risk Red Zone. Risky level, overbought market, consolidation, trend reversal, trap at the level where traders and bearish robbers are stronger. 🏆💸Book Profits Be wealthy and safe trade.💪🏆🎉
Entry 📈 : "The vault is wide open! Swipe the Bullish loot at any price - the heist is on!
however I advise to Place buy limit orders within a 15 or 30 minute timeframe most recent or swing, low or high level for pullback entries
Stop Loss 🛑:
Thief SL placed at the recent / nearest low level Using the 30Min timeframe (104.800) swing trade basis.
SL is based on your risk of the trade, lot size and how many multiple orders you have to take.
🏴☠️Target 🎯: 106.000 (or) Escape Before the Target
🧲Scalpers, take note 👀 : only scalp on the Long side. If you have a lot of money, you can go straight away; if not, you can join swing traders and carry out the robbery plan. Use trailing SL to safeguard your money 💰.
CAD/JPY "Loonie-Yen" Forex Market Heist Plan (Scalping / Day Trade) is currently experiencing a bullishness,., driven by several key factors.☝🏻👆🏻☝🏻👆🏻
📰🗞️Get & Read the Fundamental, Macro, COT Report, Quantitative Analysis, Sentimental Outlook, Intermarket Analysis, Future trend targets..., go ahead to check 👉👉👉🔗
📌Keep in mind that these factors can change rapidly, and it's essential to stay up-to-date with market developments and adjust your analysis accordingly.
⚠️Trading Alert : News Releases and Position Management 📰 🗞️ 🚫🚏
As a reminder, news releases can have a significant impact on market prices and volatility. To minimize potential losses and protect your running positions,
we recommend the following:
Avoid taking new trades during news releases
Use trailing stop-loss orders to protect your running positions and lock in profits
💖Supporting our robbery plan 💥Hit the Boost Button💥 will enable us to effortlessly make and steal money 💰💵. Boost the strength of our robbery team. Every day in this market make money with ease by using the Thief Trading Style.🏆💪🤝❤️🎉🚀
I'll see you soon with another heist plan, so stay tuned 🤑🐱👤🤗🤩
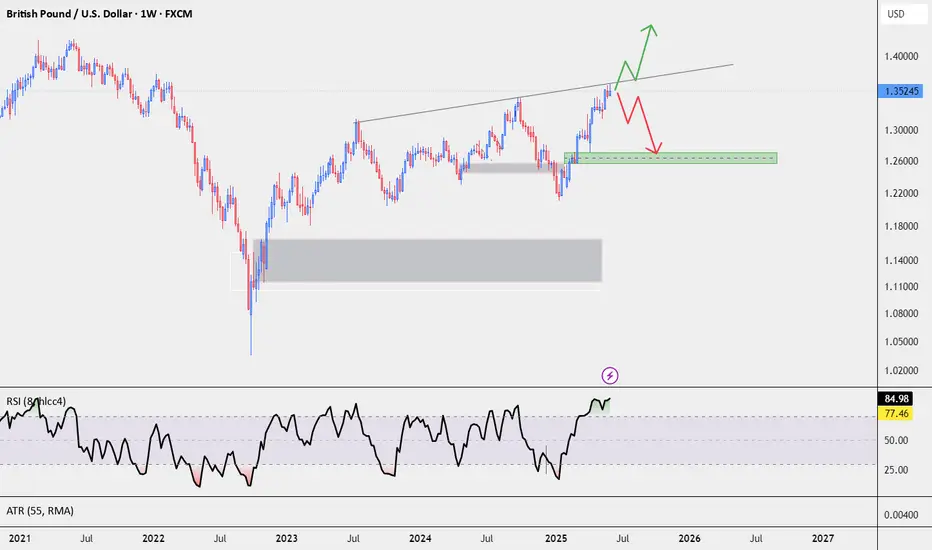
GBPUSDHI
According to our style, we should wait for the formation of a pivot to confirm the bullish trend.
Gold Market Update Ahead of US Jobs Data
On Friday, gold edged up slightly ahead of key US jobs data (NFP). Optimism over a US-China deal and USD profit-taking are capping gold’s gains. A weak NFP (<100,000) would bolster expectations of a Fed rate cut (54% chance in September), supporting gold, while a strong NFP (>200,000) would pressure it downward.
Technically, the market is bullish, with prices consolidating in the 3300-3340 range after breaking resistance. A shakeout at support is possible before the trend resumes.
Resistance: 3375, 3391, 3414
Support: 3339, 3331
Forecasting prices before NFP is tough, so it’s best to wait for the data and monitor price reactions. Prices may stay range-bound until next week, depending on fundamentals.
Best regards,
Harmonic AB=CD Pattern Guide for TradingViewThe Harmonic AB=CD pattern is a powerful technical analysis tool used to predict price reversals in financial markets. Based on Fibonacci ratios, it helps traders identify high-probability entry and exit points. This concise guide is designed for TradingView users to apply the pattern effectively.
Pattern Overview
- Structure: Four points (A, B, C, D). AB and CD legs are equal in length or follow Fibonacci ratios.
- Fibonacci Ratios:
- BC retraces 61.8%-78.6% of AB.
- CD equals AB (1:1) or extends 1.272/1.618 of BC.
- Types:
- Bullish: Signals a buy at point D (price rises).
- Bearish: Signals a sell at point D (price falls).
How to Identify and Trade
1. Spot AB: Find a clear price swing from A to B.
2. Measure BC: Use TradingView’s Fibonacci Retracement tool to confirm BC retraces 61.8%-78.6% of AB.
3. Project CD: Use Fibonacci Extension to project CD, matching AB’s length or extending 1.272/1.618 of BC.
4. Confirm D: Check for confluence with support/resistance, candlestick patterns (e.g., doji), or indicators (e.g., RSI divergence).
5. Trade Execution:
- Bullish: Buy at D, set stop-loss below D, target point C or A.
- Bearish: Sell at D, set stop-loss above D, target point C or A.
Tips for TradingView
- Use TradingView’s Fib tools for precision.
- Confirm signals with additional indicators (e.g., MACD, volume).
- Avoid choppy markets; focus on trending or range-bound charts.
The AB=CD pattern is a reliable method for spotting reversals when used with proper confirmation. By mastering Fibonacci tools on TradingView and combining the pattern with other signals, traders can enhance their decision-making and improve trade outcomes. Practice on historical charts to build confidence.
What are Harmonic Price Patterns?Harmonic price patterns are chart patterns based on Fibonacci ratios and market geometry, used to identify potential reversal points in Forex. They rely on Fibonacci levels (e.g., 0.618, 0.786, 1.618) to measure price structures, predicting reversal zones (PRZ - Potential Reversal Zone).
Key Features:
- Based on Fibonacci ratios.
- Geometric structure with 4-5 points (X, A, B, C, D).
- Identifies PRZ for buy/sell opportunities.
- Symmetrical, reflecting market psychology.
Key Harmonic Patterns in Forex:
1. Gartley:
- AB retraces 61.8% of XA.
- D at 78.6% of XA.
- Buy/sell at D.
2. Bat:
- AB retraces 38.2-50% of XA.
- D at 88.6% of XA.
- High-precision at D.
3. Crab:
- CD extends 161.8% of XA.
- D at extreme levels.
- Suited for strong volatility.
4. Butterfly:
- AB retraces 78.6% of XA.
- D extends 127-161.8% of XA.
- End of strong trends.
5. Shark:
- AB retraces 113-161.8% of XA.
- D at 88.6-113% of XA.
- Volatile markets.
6. Cypher:
- CD retraces 78.6% of XC.
- Short-term timeframes.
How to Use:
1. Measure Fibonacci ratios to identify the pattern.
2. Locate PRZ at D, combine with support/resistance, RSI, or candlestick patterns.
3. Set stop-loss beyond PRZ, aim for risk/reward ≥ 1:2.
4. Enter trades at D after price/indicator confirmation.
Notes:
- Requires precise measurements.
- Combine with other tools for reliability.
- Practice on a demo account first.
- Avoid during high-volatility events (e.g., news releases).
Let me know if you need details on a specific pattern!
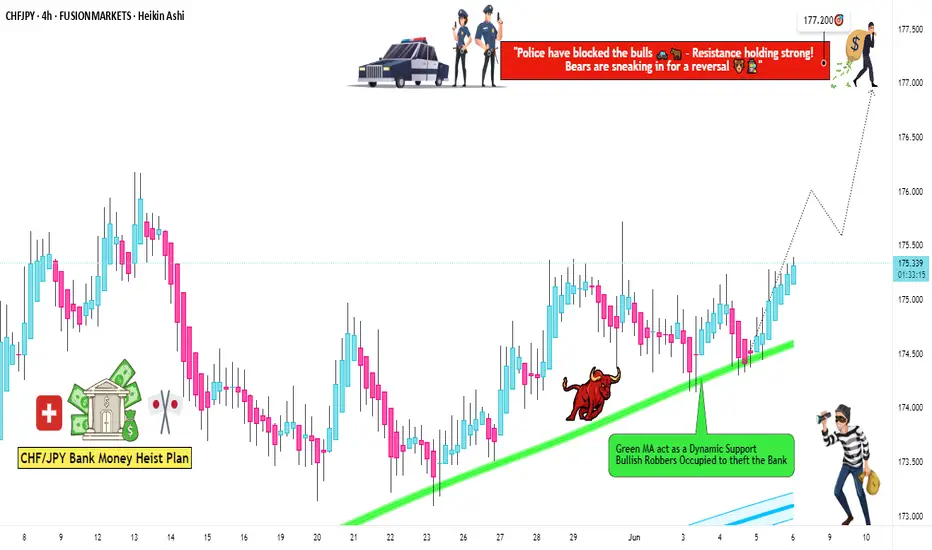
"CHF/JPY Bullish Trap? We’re Stealing Profits Anyway!"🔥 Swiss-Yen Bank Heist: Bullish Loot Grab! (CHF/JPY Master Plan) 🔥
🌟 Hi! Hola! Ola! Bonjour! Hallo! Marhaba! 🌟
Attention Money Makers & Market Robbers! 🤑💰💸✈️
Based on the 🔥Thief Trading Style🔥 (technical + fundamental analysis), we’re plotting a bullish heist on the CHF/JPY "Swiss-Yen" Forex Bank. Follow the strategy on the chart—long entry is our golden ticket! Target? The high-risk Red Zone—where police traps, overbought signals, and bearish robbers lurk. But we’re sneaky thieves… and we always get the loot! 🏆💸
📈 Entry: "The vault is wide open!" Swipe bullish gains at any price—the heist is LIVE!
Pro Tip: Place buy limit orders within 15-30 min (swing lows/highs).
🛑 Stop Loss:
Thief-style SL at recent 4H swing low (174.100) (Day/scalping trade)
Adjust based on your risk, lot size, and multiple orders.
🎯 Target: 177.200 (Time to cash out!)
🧲 Scalpers: Eyes here! 👀
Only scalp LONG.
Big money? Charge in! Small budget? Join swing traders and execute the robbery.
Trailing SL = Your money’s bodyguard. 💰
Why CHF/JPY?
Bullish momentum fueled by:
Fundamentals (COT reports, macro trends)
Sentiment + Intermarket analysis (Check our bioo for deep dives! 🔗👉👉👉)
⚠️ Trading Alert: News = Chaos! 📰🗞️🚫
Avoid new trades during major news.
Trailing stops = Profit protector.
💖 Support the Heist!
Smash the Boost Button! 💥
Strengthen our robbery squad. Steal profits daily with the Thief Trading Style! 🏆💪🚀
Stay tuned—another heist drops soon! 🤑🐱👤🤩
06.06.25 Morning ForecastPairs on Watch -
FX:EURUSD
FX:AUDUSD
FX:USDJPY
FX:AUDCAD
A short overview of the instruments I am looking at for today, multi-timeframe analysis down to what I will be looking at for an entry. Enjoy!


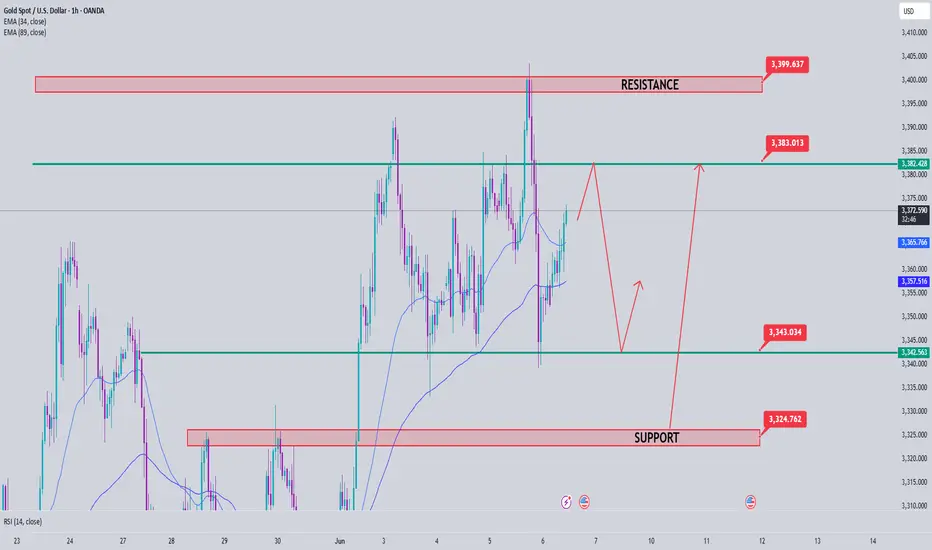
Gold Price Analysis June 63 D1 candles closed without breaking through 50% of the previous bullish main candle. Today's main view will be BUY up to 34xx
Today's resistance is around 3413 for the SELL strategy of the US Session. The Asian and European Session is looking for a BUY point. There was just a nice BUY beat around 3363 where the price swept liquidity to 3369.
3382 is the target for the BUY order and this area can SELL Scalp in today's Asian and European session because today's target is up to 3413.
In the direction of Gold Down, contrary to the analysis, the support zone 3341 and support 3324 will support the upward force of gold prices.
Breakout boundary zone 3382 and 3341. Note that the break out does not block the train
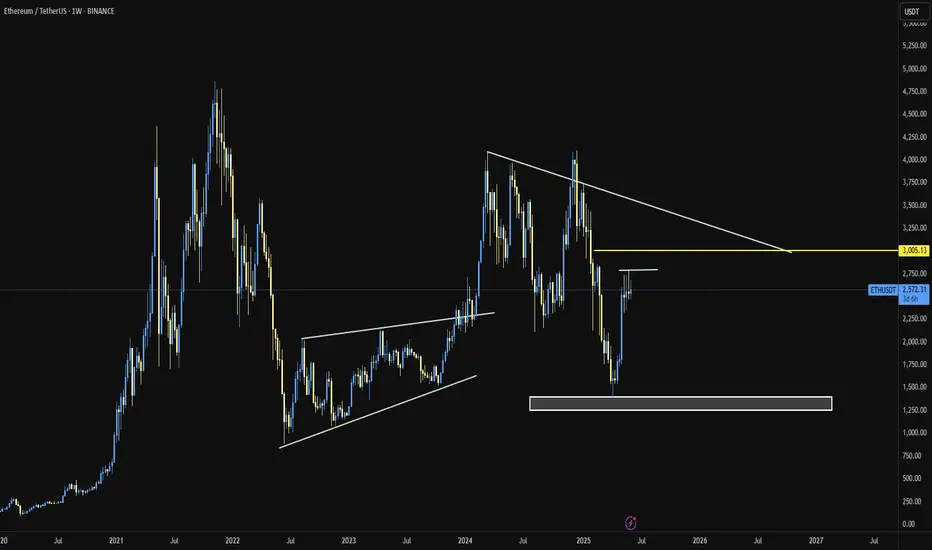
ETH/USDTStrong Accumulation can be seen on #ETH, BlackRock buying more than usual, as well as bigger wallets and whales are accumulating heavily in the last two weeks. Something is loading for ETH and I think our decision to swap all of our XRP into ETH will play out big. In the meantime. Since taking full profit on XRP, its down 7% since then, meanwhile our ETH position is at 6% in profit. This is the beginning
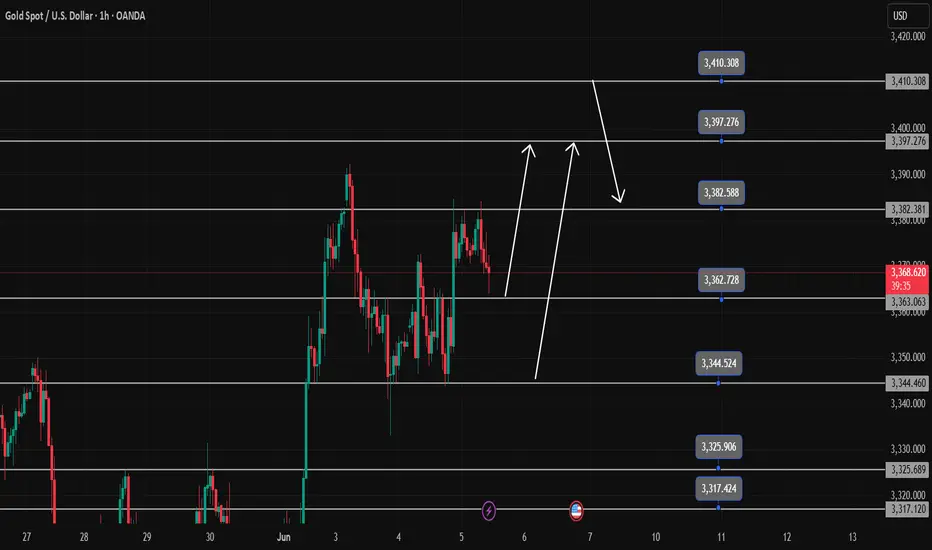
Gold Trading Strategy Overview June 5There is not much surprise with the D candlestick having increased again. The increase can completely reach 3408 today.
The H1 wave structure also shows that the trend is increasing strongly and heading towards above 3400. 3363 is considered the first BUY support zone in the Asian and European sessions today.
3344 is the most important boundary zone of the trend, breaking this zone will cause the uptrend to break to 3400 in the short term and must wait for new uptrend waves.
In the opposite direction, 3382 is the resistance zone of the Asian and European sessions today and is also the breakout zone, this zone will reach above 3400 but before that there will be a reaction around 3397, which is a very likely flash break zone of the previous peak.
Resistance: 3382-3397-3410
Support: 3363-3344-3325-3317
Pay attention to trading at support and resistance zones when there is confirmation
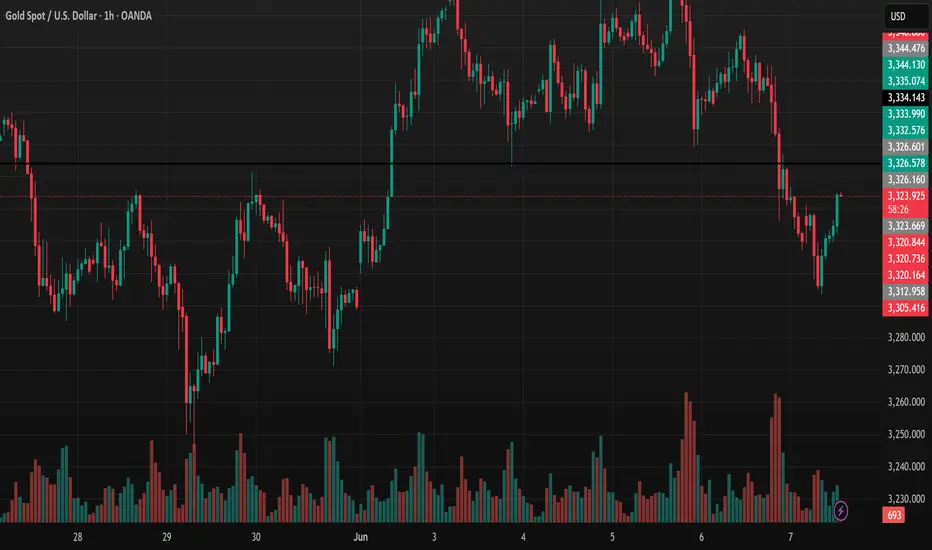
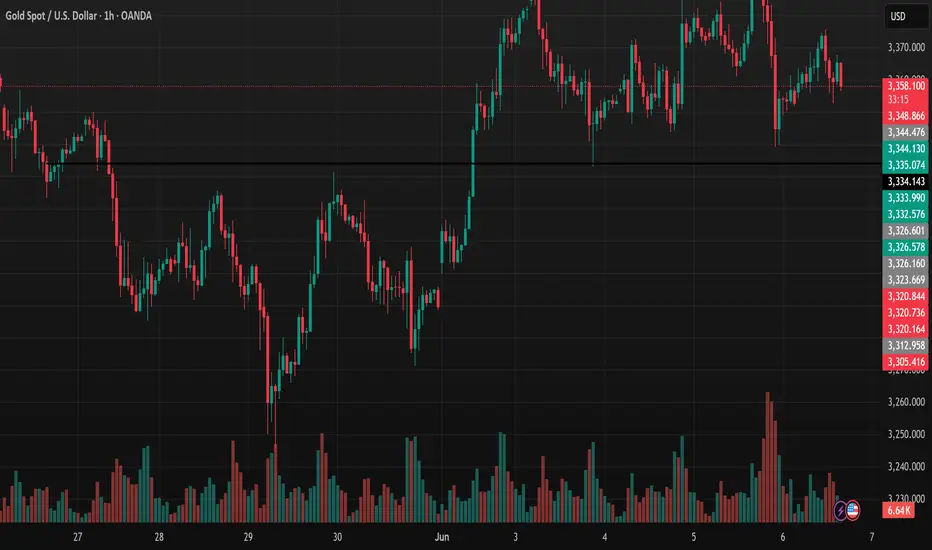
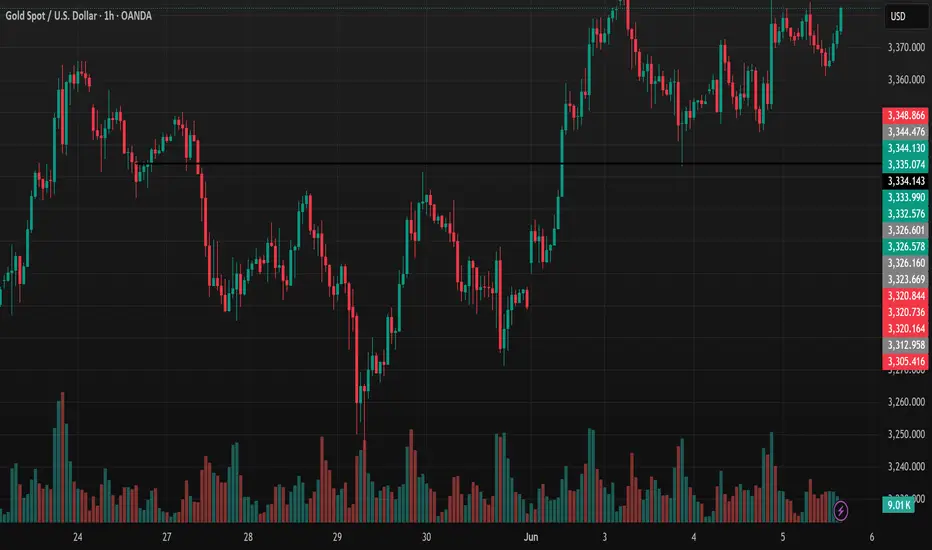
XAUUSD Slightly Up After Volatility: Analysis on 05/06/2025 The 1-hour TradingView chart for XAUUSD on 05/06/2025 shows gold prices trending slightly upward, currently trading around 3,373.885 USD/oz, up 0.03% (8.45 USD).
Prices experienced significant volatility recently, dropping to a low of around 3,220 USD/oz on 29/05 before surging to a peak of 3,375.315 USD/oz on 04/06, followed by a slight pullback.
Trading volume spiked notably during the price surge (03-04/06), indicating strong buying pressure, but tapered off during the correction, reflecting profit-taking.
Key resistance is currently at 3,375 USD/oz, with support at 3,326 USD/oz.
XAUUSD Trading Strategies
BUY XAUUSD around 3,365-3,368
Stoploss: 3,360
Take Profit : 3,372 .
SELL XAUUSD around 3,378-3,380 -
Stoploss: 3,385
Take Profit 1: 3,370
Note: Always set a Stoploss to manage risk.
Wishing you successful trades and a great day ahead! Stay informed and trade wisely.
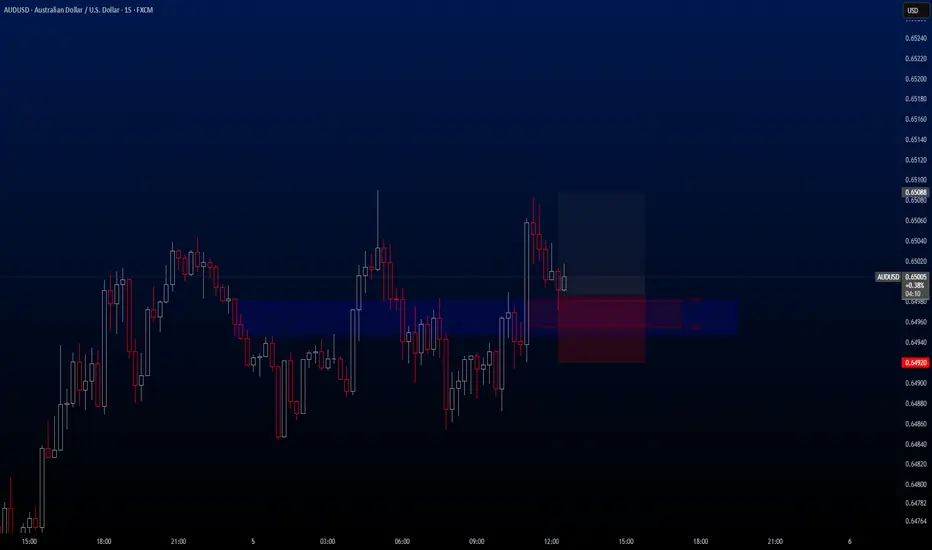
AUDUSD Hello traders. Today I spotted a buy opportunity on the AUDUSD pair and wanted to share it with you as well. We’re seeing an ideal pullback setup on this one.
🔍 Trade Details
✔️ Timeframe: 15-Minute
✔️ Risk-to-Reward Ratio: 1:1.50
✔️ Trade Direction: Buy
✔️ Entry Price: 0.64987
✔️ Take Profit: 0.65088
✔️ Stop Loss: 0.64920
🔔 Disclaimer: This is not financial advice. I’m simply sharing a trade I’ve taken based on my personal trading system, strictly for educational and illustrative purposes.
📌 Interested in a systematic, data-driven trading approach?
💡 Follow the page and turn on notifications to stay updated on future trade setups and advanced market insights.
05.06.25 Morning ForecastPairs on Watch -
FX:AUDUSD
OANDA:XPTUSD
A short overview of the instruments I am looking at for today, multi-timeframe analysis down to what I will be looking at for an entry. Enjoy!

Gold Stable Amid U.S. Data, Trade Tensions: XAUUSD TradesGold is trading steadily in the early morning session in Asia, supported by weak U.S. economic data released overnight. Service sector activity unexpectedly declined in May, while ADP data showed 37,000 jobs created, marking the slowest private sector hiring pace in over two years. Quasar Elizundia from Pepperstone stated in an email that this data has bolstered gold’s appeal as a safe-haven asset. The research strategist added that the international environment is also favorable for gold, noting trade tensions between the U.S. and China. Spot gold remained nearly unchanged at $3,374.86/oz.
Trading Strategies for XAUUSD
SELL XAUUSD around the 3390-3392 area
- SL: 3397
- TP1: 3385
- TP2: 3380
- TP3: 3374
BUY XAUUSD around the 3346-3348 area
- SL : 3340
- TP 1: 3352
- TP 2: 3356
- TP 3: 3361
Note: Always set a Stoploss in all cases to stay safe.
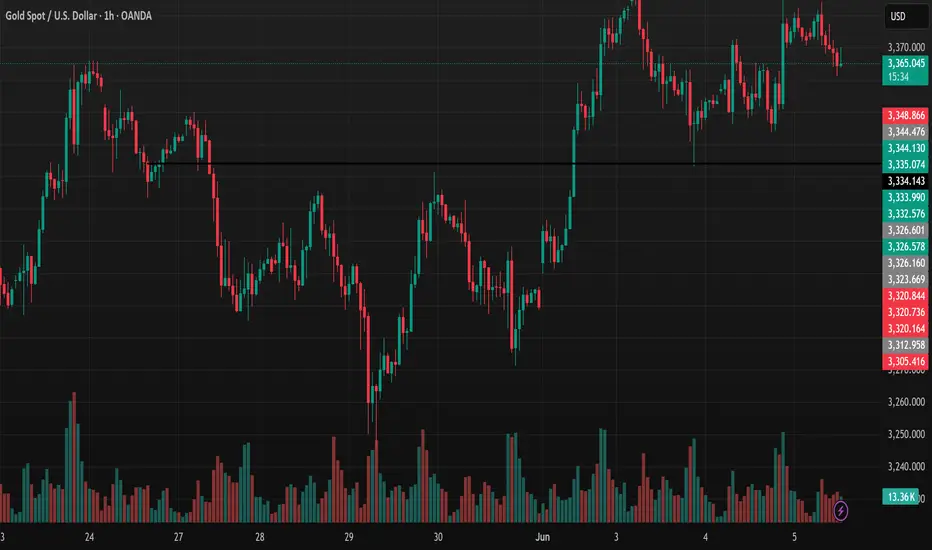
Trading Strategy After ADP Nonfarm NewsPay attention to the trading range in the US session when ADP news is released. 3365 and 3343 are sideways ranges.
We can wait for a breakout trading strategy of this price range.
H1 closes above 3350, we will have a trading strategy towards 3365 and wait for the reaction in the next range. If it breaks, DCA will go up to 3390.
If it closes below 3351, wait for it to close below 3343 and retest to SELL to 3325

Gold prices dropped sharply from a nearly 4-week highMainly due to the strengthening U.S. Dollar, gold CAPITALCOM:GOLD prices dropped sharply from a nearly 4-week high, falling almost $30 in a single day on Tuesday, with a slight recovery during the Asian session today, Wednesday, June 4.
The Dollar Index rebounded from its lowest level in over a month, reached during early Tuesday trading, and ended the day up 0.6%, exerting moderate pressure on gold during yesterday’s session.
The Job Openings and Labor Turnover Survey (JOLTS) released by the U.S. Bureau of Labor Statistics on Tuesday showed that total job vacancies in the U.S. reached 7.39 million in April, up from 7.2 million in March. Economists had forecast 7.1 million job openings for April.
Gold prices (XAUUSD) fell on Tuesday as the unexpected rise in U.S. job openings boosted risk appetite and strengthened the Dollar, according to Bloomberg. The increase in job vacancies encouraged investors to believe that the U.S. economy remains resilient despite the tariff agenda pushed by President Trump.
Looking ahead, U.S. labor data, including Friday’s Non-Farm Payroll (NFP) report for May, could help guide the Federal Reserve’s monetary policy, Bloomberg noted. Lower interest rates are generally favorable for non-yielding assets like gold.
Gold traders will be awaiting key employment data, including the ADP report and the NFP report, to determine the Fed’s policy direction.
From a technical standpoint, there have been no significant changes on the chart or in the previous analyses, so readers can refer to the earlier publication linked below.