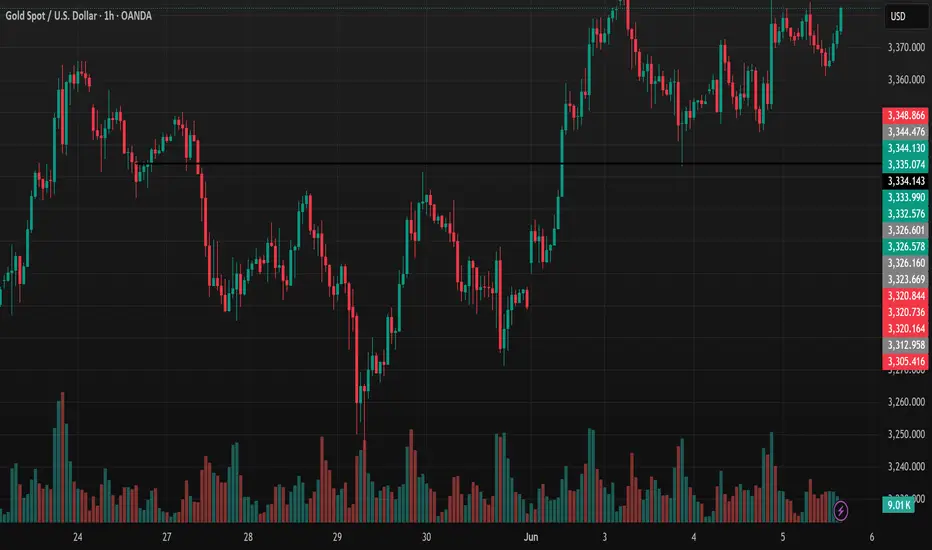
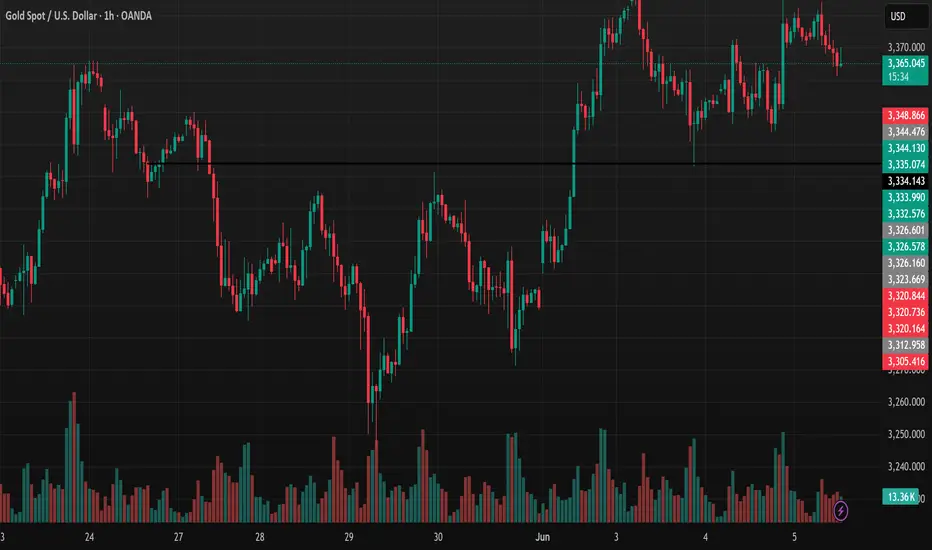
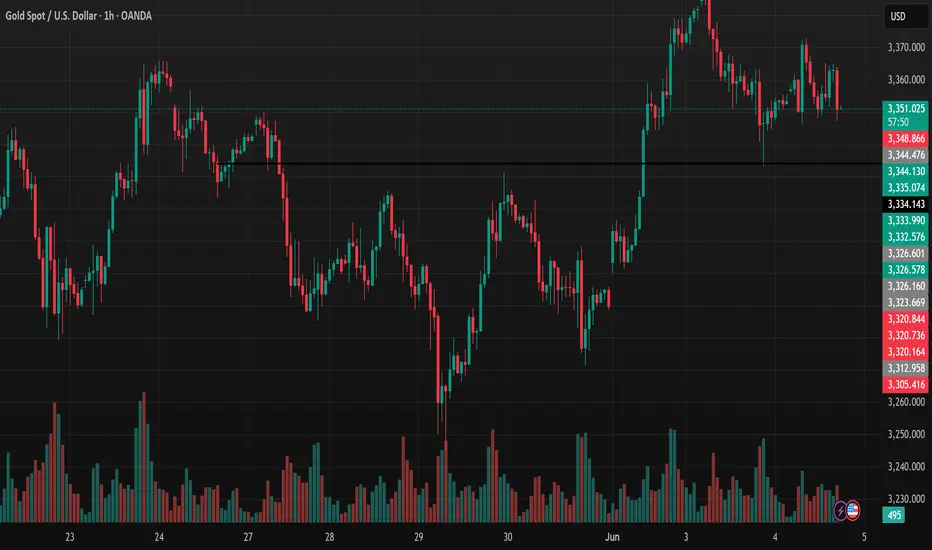
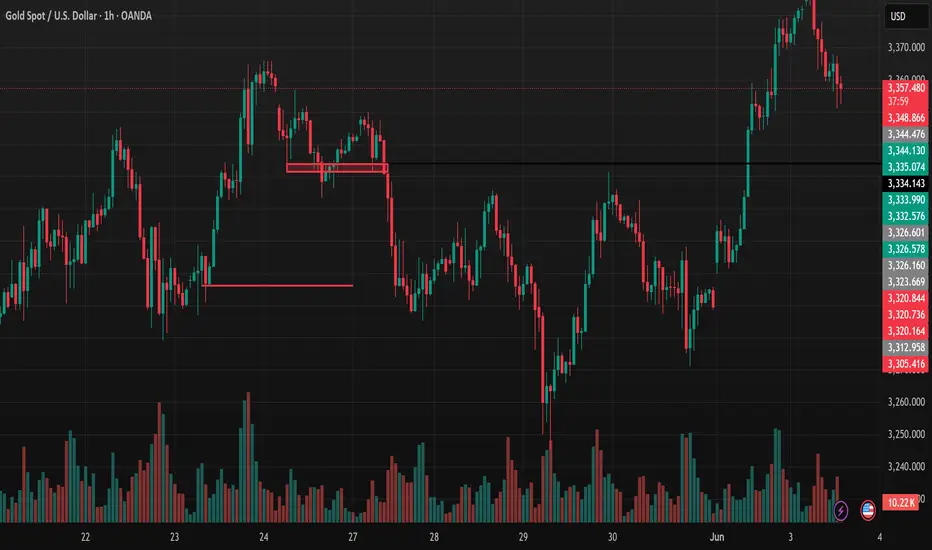
XAUUSD Slightly Up After Volatility: Analysis on 05/06/2025 The 1-hour TradingView chart for XAUUSD on 05/06/2025 shows gold prices trending slightly upward, currently trading around 3,373.885 USD/oz, up 0.03% (8.45 USD).
Prices experienced significant volatility recently, dropping to a low of around 3,220 USD/oz on 29/05 before surging to a peak of 3,375.315 USD/oz on 04/06, followed by a slight pullback.
Trading volume spiked notably during the price surge (03-04/06), indicating strong buying pressure, but tapered off during the correction, reflecting profit-taking.
Key resistance is currently at 3,375 USD/oz, with support at 3,326 USD/oz.
XAUUSD Trading Strategies
BUY XAUUSD around 3,365-3,368
Stoploss: 3,360
Take Profit : 3,372 .
SELL XAUUSD around 3,378-3,380 -
Stoploss: 3,385
Take Profit 1: 3,370
Note: Always set a Stoploss to manage risk.
Wishing you successful trades and a great day ahead! Stay informed and trade wisely.
Trade
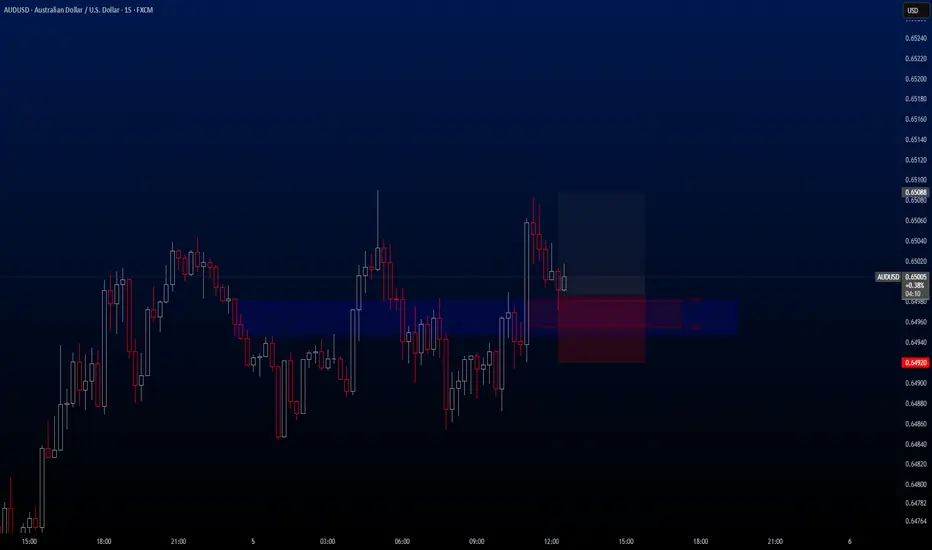
AUDUSD Hello traders. Today I spotted a buy opportunity on the AUDUSD pair and wanted to share it with you as well. We’re seeing an ideal pullback setup on this one.
🔍 Trade Details
✔️ Timeframe: 15-Minute
✔️ Risk-to-Reward Ratio: 1:1.50
✔️ Trade Direction: Buy
✔️ Entry Price: 0.64987
✔️ Take Profit: 0.65088
✔️ Stop Loss: 0.64920
🔔 Disclaimer: This is not financial advice. I’m simply sharing a trade I’ve taken based on my personal trading system, strictly for educational and illustrative purposes.
📌 Interested in a systematic, data-driven trading approach?
💡 Follow the page and turn on notifications to stay updated on future trade setups and advanced market insights.
05.06.25 Morning ForecastPairs on Watch -
FX:AUDUSD
OANDA:XPTUSD
A short overview of the instruments I am looking at for today, multi-timeframe analysis down to what I will be looking at for an entry. Enjoy!

Gold Stable Amid U.S. Data, Trade Tensions: XAUUSD TradesGold is trading steadily in the early morning session in Asia, supported by weak U.S. economic data released overnight. Service sector activity unexpectedly declined in May, while ADP data showed 37,000 jobs created, marking the slowest private sector hiring pace in over two years. Quasar Elizundia from Pepperstone stated in an email that this data has bolstered gold’s appeal as a safe-haven asset. The research strategist added that the international environment is also favorable for gold, noting trade tensions between the U.S. and China. Spot gold remained nearly unchanged at $3,374.86/oz.
Trading Strategies for XAUUSD
SELL XAUUSD around the 3390-3392 area
- SL: 3397
- TP1: 3385
- TP2: 3380
- TP3: 3374
BUY XAUUSD around the 3346-3348 area
- SL : 3340
- TP 1: 3352
- TP 2: 3356
- TP 3: 3361
Note: Always set a Stoploss in all cases to stay safe.
Trading Strategy After ADP Nonfarm NewsPay attention to the trading range in the US session when ADP news is released. 3365 and 3343 are sideways ranges.
We can wait for a breakout trading strategy of this price range.
H1 closes above 3350, we will have a trading strategy towards 3365 and wait for the reaction in the next range. If it breaks, DCA will go up to 3390.
If it closes below 3351, wait for it to close below 3343 and retest to SELL to 3325

Gold prices dropped sharply from a nearly 4-week highMainly due to the strengthening U.S. Dollar, gold CAPITALCOM:GOLD prices dropped sharply from a nearly 4-week high, falling almost $30 in a single day on Tuesday, with a slight recovery during the Asian session today, Wednesday, June 4.
The Dollar Index rebounded from its lowest level in over a month, reached during early Tuesday trading, and ended the day up 0.6%, exerting moderate pressure on gold during yesterday’s session.
The Job Openings and Labor Turnover Survey (JOLTS) released by the U.S. Bureau of Labor Statistics on Tuesday showed that total job vacancies in the U.S. reached 7.39 million in April, up from 7.2 million in March. Economists had forecast 7.1 million job openings for April.
Gold prices (XAUUSD) fell on Tuesday as the unexpected rise in U.S. job openings boosted risk appetite and strengthened the Dollar, according to Bloomberg. The increase in job vacancies encouraged investors to believe that the U.S. economy remains resilient despite the tariff agenda pushed by President Trump.
Looking ahead, U.S. labor data, including Friday’s Non-Farm Payroll (NFP) report for May, could help guide the Federal Reserve’s monetary policy, Bloomberg noted. Lower interest rates are generally favorable for non-yielding assets like gold.
Gold traders will be awaiting key employment data, including the ADP report and the NFP report, to determine the Fed’s policy direction.
From a technical standpoint, there have been no significant changes on the chart or in the previous analyses, so readers can refer to the earlier publication linked below.
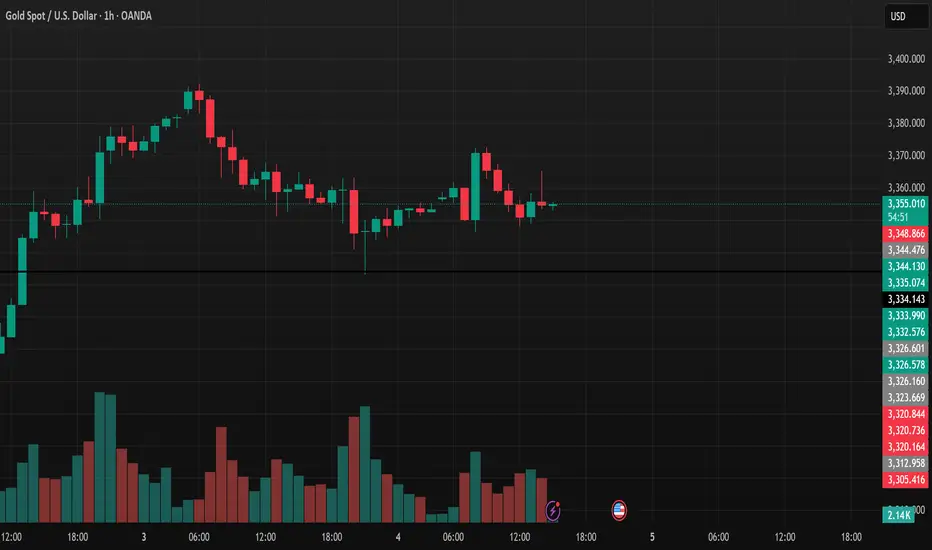
XAUUSD consolidation before a decisionGold FX:XAUUSD is currently hovering around 3,354 after a sharp drop from the recent high of 3,391. Sellers pushed the price down to the key support zone at 3,334–3,335, but bearish momentum has clearly weakened. The price is moving sideways with small-bodied candles and low volume, indicating the market is “holding its breath” ahead of the European or US sessions or potential market-moving news.
If this support zone holds and we see a clear bullish signal (such as an engulfing or marubozu candle), it could be a good entry for a buy position, targeting 3,365–3,370 initially and then aiming for a retest of 3,391. A safe stop-loss can be placed below 3,330. However, if price breaks below 3,334 and closes beneath it, the market may enter a deeper correction phase, with potential downside targets at 3,320 or even 3,305.
In short, this is a sensitive area where patience is key. Wait for clear confirmation before entering any trades, avoid rushing in, and stick strictly to your risk management rules.
Wishing all traders a clear mind, sharp strategy, and profitable results!
04.06.25 Morning ForecastPairs on Watch -
FX:EURUSD
FX:USDJPY
FX:GBPCHF
OANDA:XPTUSD
A short overview of the instruments I am looking at for today, multi-timeframe analysis down to what I will be looking at for an entry. Enjoy!

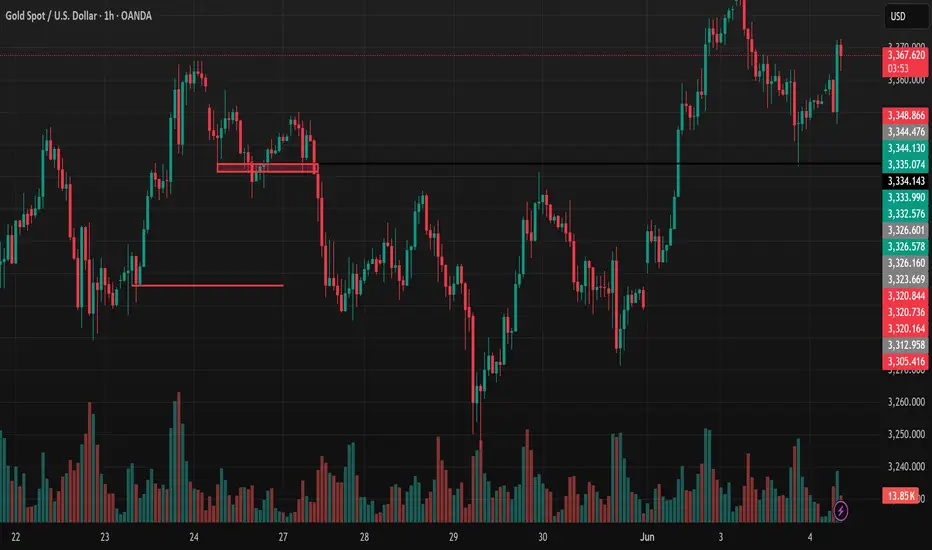
Gold Outlook: Breakout Signals Further Upside PotentialGold FX:XAUUSD is currently in a strong uptrend, backed by both technical breakout and positive fundamentals. The price has decisively cleared the key resistance zone of $3,365–$3,370 and is hovering around $3,368. A healthy pullback to retest this zone could offer a high-probability long setup, with the next target projected at $3,470.
On the macro side, renewed U.S.–China trade tensions—following Trump’s accusations and tariff threats—along with the ongoing Russia–Ukraine conflict, continue to fuel safe-haven demand for gold.
Technically, the structure remains bullish. However, a breakdown below $3,335 would invalidate the current setup and may lead to a deeper correction.
Let’s keep a close eye on this pullback zone. If momentum holds, gold could be gearing up for the next leg higher.
Take care and trade smart
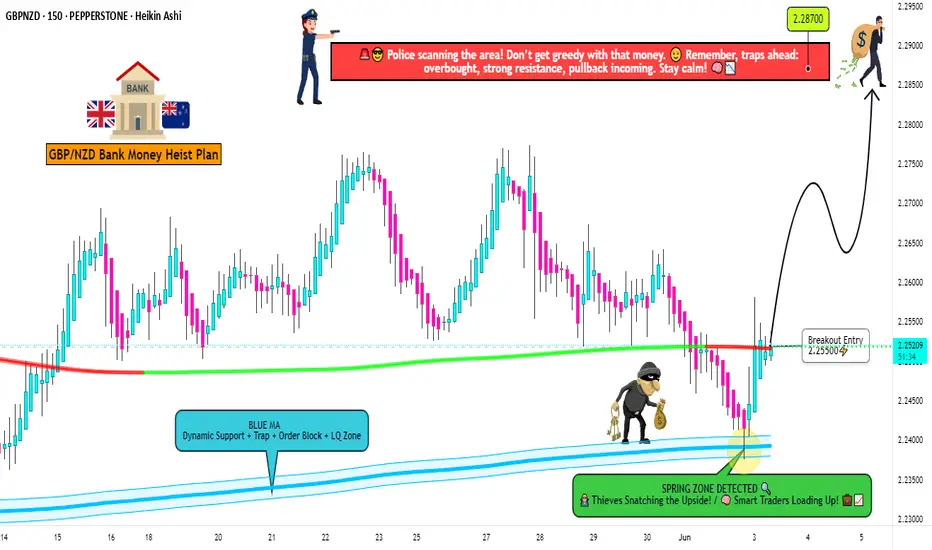
"GBP/NZD: The Perfect Long Trade (Risk-Managed Heist Plan)"🏦💰 GBP/NZD BANK HEIST: The Ultimate Sterling vs. Kiwi Money Grab! 💰🏦
🌟 Hi! Hola! Ola! Bonjour! Hallo! Marhaba! 🌟
Attention all Money Makers & Market Robbers! 🤑💸✈️
Based on the 🔥Thief Trading Style🔥 (technical + fundamental analysis), here’s our master plan to loot the GBP/NZD "Sterling vs Kiwi" Forex Bank Heist!
📜 THE HEIST BLUEPRINT:
✅ Entry Strategy (Long Only!) 📈
"The heist is ON! Wait for the breakout above the previous high (2.25500) – then strike! Bullish profits await!"
Option 1: Place Buy Stop orders above the Moving Average.
Option 2: Use Buy Limit orders near recent swing lows (15-30 min timeframe) for pullback entries.
📌 Pro Tip: Set an ALERT for the breakout entry—don’t miss the robbery window!
🛑 Stop Loss (Listen Up!)
"Yo, thieves! 🗣️ If you’re entering on a Buy Stop, DO NOT set your SL until after the breakout! 🚀 Place it where I say (or wherever you dare 😈), but remember—your risk, your rules! ⚠️🔥"
📍 Thief SL Placement: Nearest swing low (1H timeframe) – 2.23700 (adjust based on risk & lot size).
🎯 Profit Target: 2.28700 (Time to escape with the loot!)
⚡ Scalpers’ Note: Only scalp LONG! Big wallets? Go all in. Small wallets? Ride the swing. Use trailing SL to protect your stolen cash! 💰
📰 WHY THIS HEIST? (Fundamental Edge)
GBP/NZD is showing bullish momentum due to:
Macroeconomic factors
COT Report insights
Sentiment shifts & intermarket trends
🔗 Full analysis? Check our bio0 for the deep dive!
⚠️ Trading Alert: News = Danger Zone! 📰🚫
Avoid new trades during high-impact news.
Use trailing stops to lock in profits & dodge volatility traps.
💥 BOOST THE HEIST!
💖 Support the robbery crew—SMASH THAT LIKE BUTTON! 💖
🚀 More heists coming soon—stay tuned, thieves! 🏆🤝🎉
Gold Price Rises on Tariff Tensions and Geopolitical RisksGold jumped nearly 3% as President Trump announced plans to double tariffs on U.S. steel and aluminum imports to 50% starting June 4, fueling safe-haven demand and weakening the U.S. Dollar. The EU expressed strong regret and warned of potential countermeasures.
The rally continued on Tuesday (June 3) as geopolitical tensions escalated. Ukraine launched its largest drone attack on Russian airbases, while Moscow responded with long-range strikes on Kyiv. These events, combined with weak U.S. ISM Manufacturing PMI (May: 48.5, lowest since Nov), added to market anxiety.
Investors are watching the Fed’s upcoming statements for clues on rate direction. Lower interest rates and global instability continue to support gold’s bullish case.
Technical Outlook – XAUUSD
Gold hit $3,371, then pulled back slightly, but remains on track to reach $3,400 soon. A short-term bullish channel is forming, and RSI above 50 suggests more upside potential.
Pullbacks above the 21-day EMA and 0.382 Fibonacci level are likely temporary corrections or buy opportunities.
Support: 3,326 – 3,300 – 3,292
Resistance: 3,371 – 3,400 – 3,435

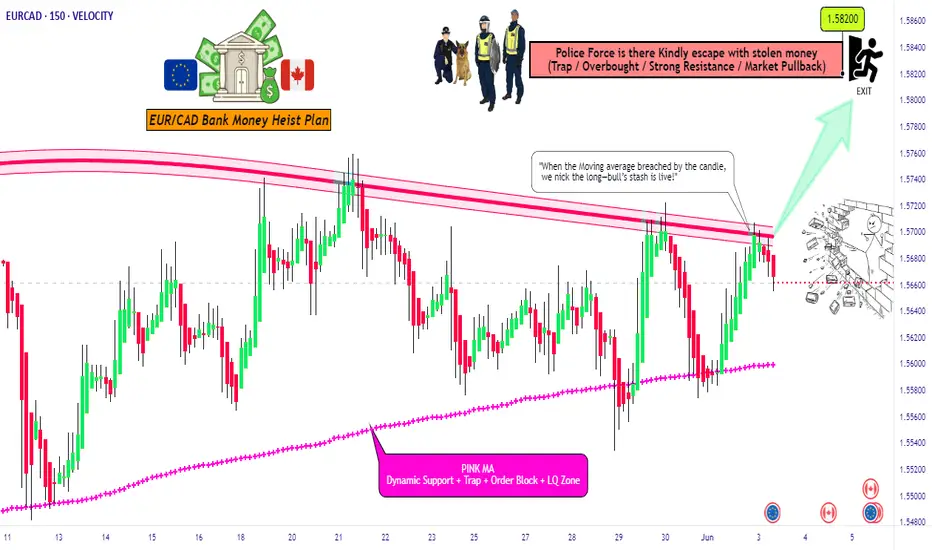
EUR/CAD Raid Alert: Last Chance to Loot This Bullish Breakout!🏴☠️ EUR/CAD LOOT ALERT: Can We Steal 100 Pips Before the Trap Springs? (Thief Trading Blueprint)
🌟 Hola! Bonjour! Ciao! Hallo! Marhaba! 🌟
Attention Forex Bandits & Loonie Raiders! 💶🦫💰
🔥 Thief Trading Intel: We're targeting EUR/CAD for a MA breakout heist! Long entry only - eyeing that 1.57200 breakout level. High-risk MA Zone ahead: overbought, consolidating, perfect for our ambush.
"Take your pips and vanish - this steal's on the house!" 💨💵
🚪 ENTRY: The Trap is Set!
📈 "Wait for MA breakout at 1.57200 - then STRIKE!"
Option 1: Buy Stop above MA (breakout confirmation)
Option 2: Buy Limit at swing levels (15-30 min TF)
📌 Pro Thief Move: SET THOSE ALERTS!
🛑 STOP LOSS: Escape Plan
🔊 "Listen up, rookies!" 🗣️
Breakout trades? NO SL until after confirmation!
Rebels: Place wherever... but sleep with one eye open! 👁️
📍 Smart Crew SL: Nearest swing low (1H TF)
🎯 TARGET: Loot & Scoot!
🎯 1.58200 (100 pips of pure profit!)
⚡ SCALPERS' QUICK HIT
👀 Long only!
Deep pockets? Raid now
Light wallet? Join swing heist
Trailing SL = Your Getaway Car! 🚗💨
📢 WHY THIS HEIST?
"Euro vs Loonie" showing strength! Watch for:
COT data & Macro trends
Intermarket analysis
Sentiment shifts
🔗 Full dossier? Bio0 links below! 👉🏻☝🏻👉🏻☝🏻
⚠️ WARNING: News = Police Raid! 📰🚨
CAD news moves fast! Protect your stash:
❌ No new trades during news
🔒 Trailing stops = Handcuff-proof profits
💖 SUPPORT THE CREW!
💥 SMASH THAT BOOST BUTTON! 💥
More boosts = bigger future scores!
Stronger crew = more pips for all!
Next currency heist coming soon... 💶🔫
XAUUSD – Poised for a Major Breakout After ConsolidationOn the monthly chart, XAUUSD is forming an Inside Bar pattern, signaling that the market is compressing ahead of a potential strong move. May’s candle remains within April’s range – a classic setup that often precedes a decisive breakout.
On the H4 timeframe, gold has attempted to break above recent highs multiple times but failed, forming a series of lower highs, indicating a corrective structure. However, the recent rebound from May’s low suggests potential accumulation is underway.
Currently, price is hovering around a neutral zone. A clear break above the 3,400 level could spark a fast move toward the 3,500–3,600 range. Conversely, a drop below 3,120 would open the door for a deeper pullback toward 3,000.
From a macro perspective, long-term fundamentals continue to support the bullish case for gold, driven by dovish central bank policies, geopolitical risks, and concerns about USD debasement. Still, a confirmed technical breakout is needed to establish direction in the near term.
Strategy Summary
Buy zone to watch: 3,307 – 3,320
Bullish trigger: Holding above 3,300
Target: 3,435
Risks: False breakouts or failure to hold above the breakout zone
03.06.25 Morning ForecastPairs on Watch -
FX:EURUSD
FX:GBPAUD
FX:AUDUSD
FX:AUDCAD
A short overview of the instruments I am looking at for today, multi-timeframe analysis down to what I will be looking at for an entry. Enjoy!

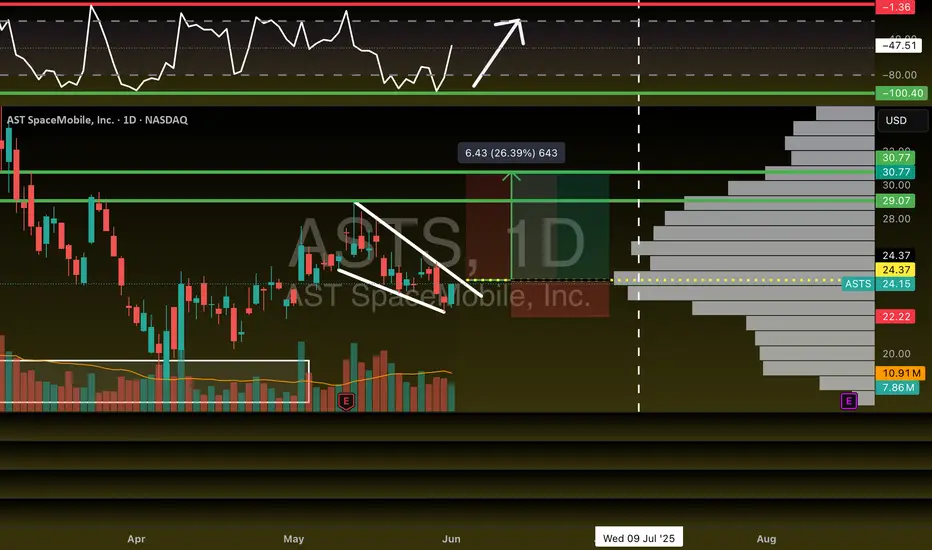
$ASTS Trade Alert Setup - 26% Upside🚨 NASDAQ:ASTS Trade Alert Setup 🚨
Falling Wedge Breakout at $24.37 =
🎯 $29.07 📏 $30.77
Trading Plan: July 11th $26 Calls on Breakout or shares
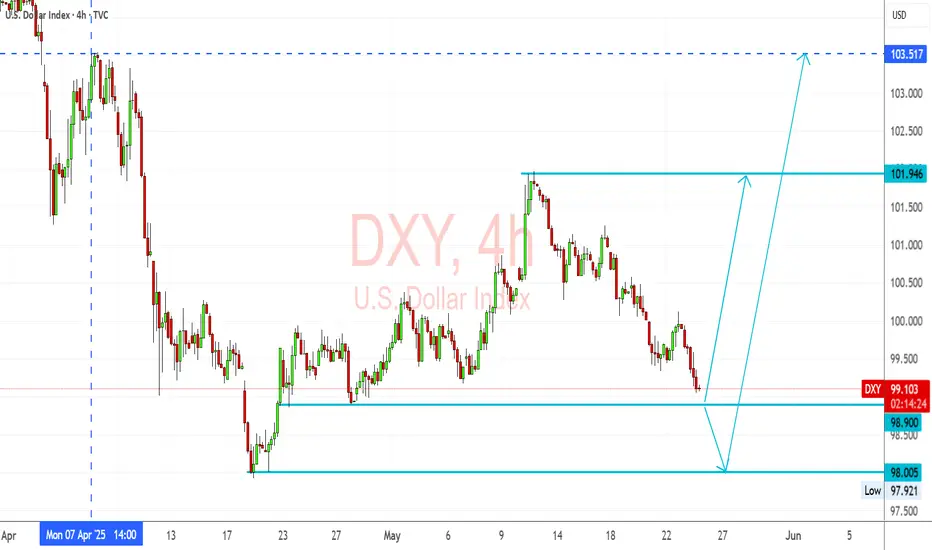
DXY Short-Term Reversal Zone in SightUS Dollar Index (DXY) is approaching a strong support zone at 98.90–98.00, which has historically acted as a base for bullish reversals. The price is now testing the lower bound of this zone after a steady downtrend from the 101.94 high.
Key Technical Structure:
Support Zone: 98.90–98.00 (tested 3+ times)
Double Bottom Potential forming if bulls hold the zone
Upside Targets:
101.94: Key horizontal resistance
103.50: Swing high from early April
Scenarios to Watch:
🔹 Bullish Rebound:
Price bounces off 98.90–98.00 support
Confirmation: Break and close above 100.50 near-term resistance
Could fuel move back to 101.94, possibly 103.50
🔹 Bearish Breakdown:
Daily close below 98.00 would invalidate bullish setup
Opens downside to 97.00 and even 95.50
Macro Drivers to Watch:
FOMC speakers and interest rate guidance
US jobless claims or inflation surprise
Risk-off sentiment (benefits USD) vs. continued global risk appetite
Conclusion:
DXY is trading at a make-or-break support zone. Watch for clear bullish reaction or bearish breakdown before committing. The setup favors a bounce unless 98.00 fails.
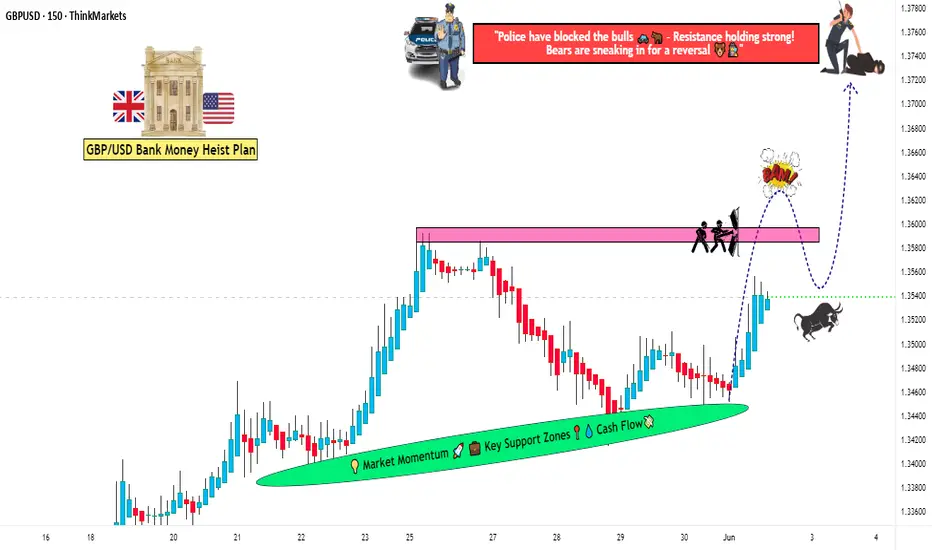
GBP/USD HEIST ALERT: Bullish Breakout or Bearish Trap?🌟 Hey! Hola! Ola! Bonjour! Hallo! Marhaba! 🌟
Calling all Market Robbers & Profit Pirates!💸💰
🔥 Thief Trading Intel: Our crew’s latest heist targets GBP/USD "The Cable"—bullish breakout incoming! Long entry only. High-risk Red Zone ahead: overbought, consolidating, and ripe for a reversal. Don’t get caught in the bear trap! 🏴☠️
"Take your loot and run, trader—you’ve earned this steal!" 💪🎯
🚪 ENTRY: The Heist Begins!
📈 "Wait for MA breakout (1.36000) then STRIKE—bullish profits await!"
Option 1: Buy Stop above Pink Resistance (breakout confirmation).
Option 2: Buy Limit at swing low/high (15-30 min TF).
📌 Pro Tip: SET AN ALERT! Don’t miss the breakout.
🛑 STOP LOSS: Escape Route
🔊 "Yo, listen up! 🗣️
Buy Stop orders? NO SL until after breakout! 🚀
Rebels: Place SL wherever—but you’ve been warned! ⚠️🔥
📍 Thief SL (Smart Crew): Recent/swing low (1.35000, 4H TF).
📍 Adjust based on your risk, lot size, and orders.
🎯 TARGET: Loot & Exit!
🎯 1.37500 (or escape early if the market turns!)
⚡ SCALPERS’ QUICK GRAB
👀 Long scalps ONLY!
Big wallets? Raid now.
Small stacks? Join swing traders.
Trailing SL = Your Money Shield! 🛡️💰
📢 WHY THIS HEIST? (GBP/USD Bullish Momentum)
"The Cable" is heating up! Key drivers:
Fundamentals (COT, Macro Data)
Sentiment & Intermarket Trends
Future Targets & Score Outlook
🔗 Full intel? Bio links below! 👉👉
⚠️ TRADING ALERT: News = Danger Zone! 📰🚨
News = Volatility Spikes! Protect your loot:
❌ Avoid new trades during news.
🔒 Trailing SL = Profit Lock.
💖 SUPPORT THE HEIST CREW!
💥 SMASH THAT BOOST BUTTON! 💥
More boosts = easier money grabs!
Stronger crew = bigger heists!
Profit daily with Thief Trading Style! 🏆🚀
Next heist coming soon—stay tuned! 🤑🐱👤🤩
Gold Price Analysis June 2With the recovery waves of the D1 frame, the position of Gold returns to the wide Sideway near the ATH zone
3360 and 3260 sideway 100 price for the current trend. And today it is still possible to break this zone.
GOLD increased strongly in the European session, touching the upper border of the sideway model
The h1 wave is still a more bullish wave. With the support zone opening the GAP of the Asian session 3296 is still considered a strong support zone today. The breakout zone in the morning also becomes an important support zone
In the opposite direction of the break 3360, there is still a zone 3368 as the immediate resistance before the Gold price is on the way to ATH. Attention daily resistance 3396

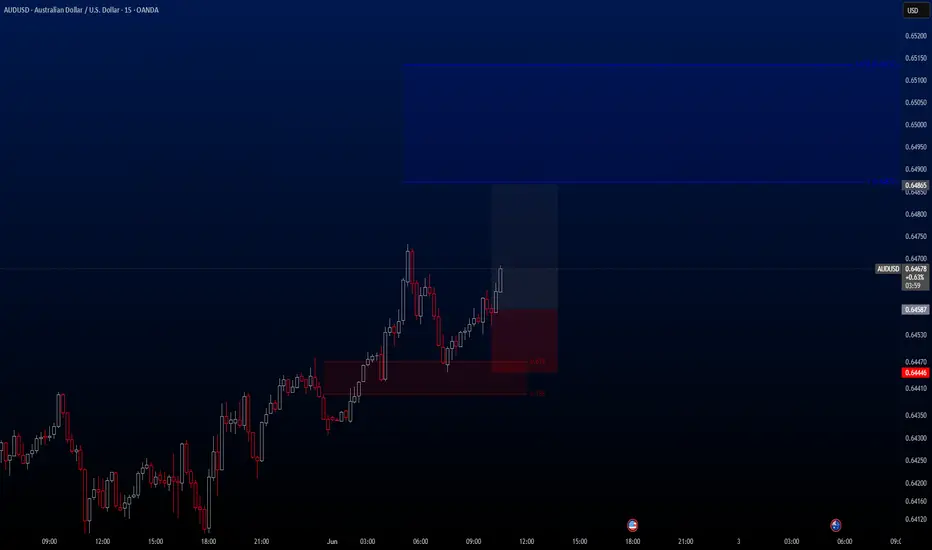
AUDUSD Hello traders. Wishing everyone a productive week ahead!
Today, the U.S. Manufacturing PMI (May) and the ISM Manufacturing PMI (May) reports will be released — both are high-impact events for the markets. This week, in particular, is expected to be news-heavy.
That said, it’s wise to remain cautious with trades. My plan is to open a few trades before the news and close them beforehand. One of these opportunities has emerged on the AUDUSD pair. I’ve already taken a Buy trade, and it's currently active.
This setup has two key Take Profit zones:
First TP: 0.6487
Second TP: 0.65137
I’ve personally targeted the first TP level, so I’ll be sharing the details of that trade. However, the same structure applies to the second target as well if you choose to aim higher.
🔍 Trade Details:
✔️ Timeframe: 15-Minute
✔️ Risk-to-Reward Ratio: 1:1 / 1:1.50 / 1:2
✔️ Trade Direction: Buy
✔️ Entry Price: 0.64587
✔️ Take Profit: 0.64865
✔️ Stop Loss: 0.64446
🔔 Disclaimer: This is not financial advice. I’m simply sharing a trade I’ve taken based on my personal trading system, strictly for educational and illustrative purposes.
📌 Interested in a systematic, data-driven trading approach?
💡 Follow the page and turn on notifications to stay updated on future trade setups and advanced market insights.
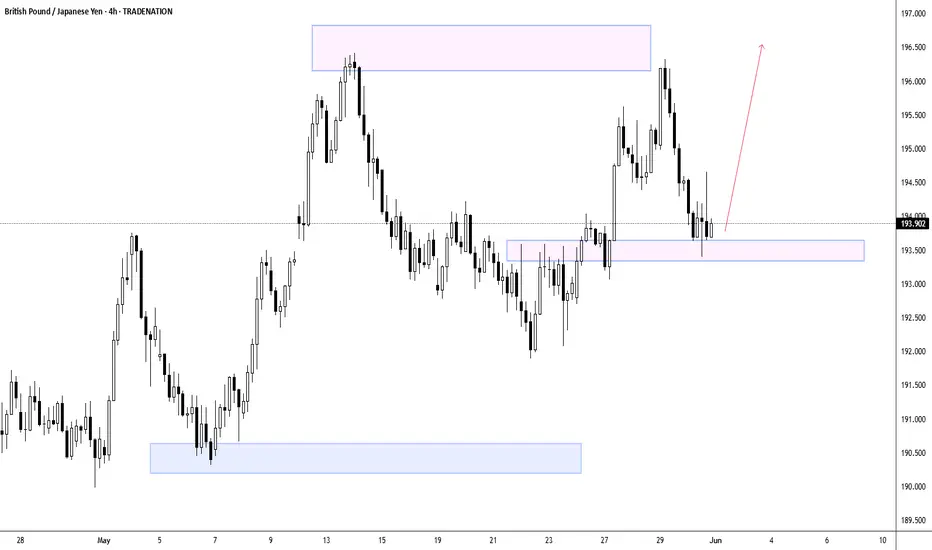
GBPJPY - Monday's Action Could Spark Upside MoveThe GBP/JPY pair is currently positioned at a critical juncture around the 193.902 level, sitting near important support zones that have been highlighted on the chart. The currency pair has shown considerable volatility over the past month, with price action oscillating between well-defined support and resistance levels, creating a clear range-bound structure. As we approach Monday's trading session, the focus will be on whether the current support level can withstand any potential selling pressure. If this support zone holds firm and buyers step in to defend these levels, we could see a significant move to the upside, potentially targeting the upper resistance zone around the 196+ area that has previously capped rallies. The technical setup suggests that a successful defense of support could trigger renewed bullish momentum, making Monday's price action crucial for determining the pair's short-term directional bias and whether it can break out of its recent consolidation pattern.
Disclosure: I am part of Trade Nation's Influencer program and receive a monthly fee for using their TradingView charts in my analysis.
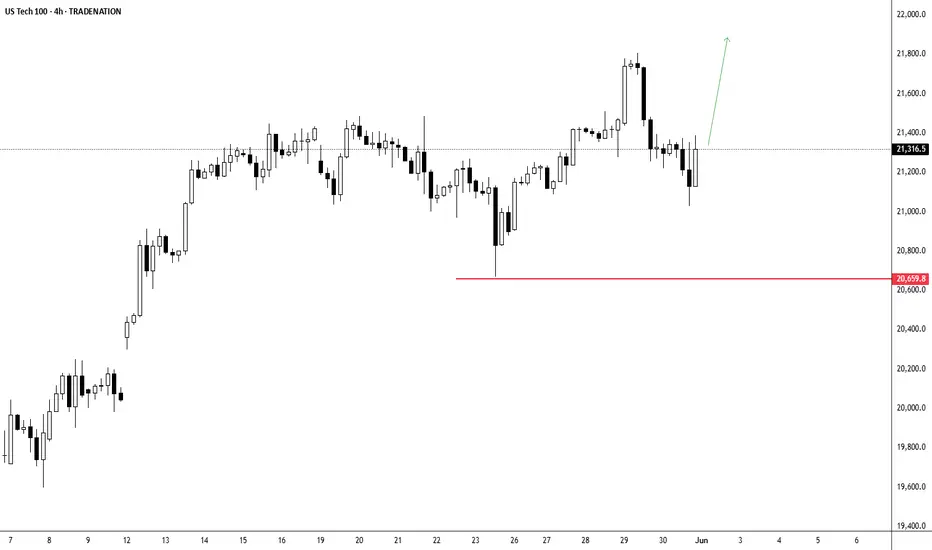
US100 - Bullish Momentum Favors Upside ContinuationThe US Tech 100 is displaying strong bullish momentum after successfully breaking above the critical resistance level at 20,659.8, which had previously acted as a significant barrier. Currently trading at 21,316 the index has demonstrated impressive upward trajectory following what appears to be a healthy consolidation phase around the key resistance-turned-support zone. The technical setup strongly favors continuation to the upside as the higher probability scenario, with the breakout above 20,659.8 potentially opening the door for further gains toward higher resistance levels. However, prudent risk management suggests taking this rally piece by piece, monitoring how price action develops at each significant level while watching for any signs of exhaustion or pullback that might offer better entry opportunities. The bullish bias remains intact as long as the index maintains its position above the former resistance level, which should now serve as dynamic support for any potential retracements.
Disclosure: I am part of Trade Nation's Influencer program and receive a monthly fee for using their TradingView charts in my analysis.
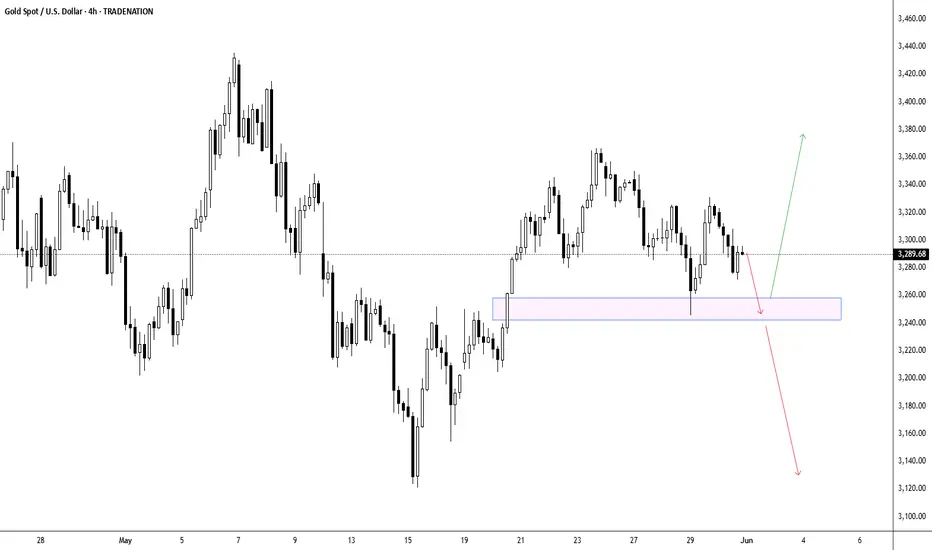
XAUUSD - Key Inflection Point AheadLooking at this gold spot chart, the precious metal appears to be consolidating within a defined range after experiencing significant volatility throughout May. The price is currently trading near the upper boundary of the marked support zone around $3,250-$3,260, following a recent pullback from higher levels. Given the technical setup and the proximity to this key support area, there's a strong probability that gold will retest this support zone in the coming sessions. This retest will be critical in determining the next directional move - if the support holds and buyers step in, we could see a bounce back toward the upside targeting previous resistance levels, potentially challenging the recent highs. However, if the support fails to hold under selling pressure, gold could continue its downward trajectory, opening the door for further declines toward lower support levels. The market's reaction at this support zone will likely dictate whether the current consolidation resolves bullishly or bearishly.
Disclosure: I am part of Trade Nation's Influencer program and receive a monthly fee for using their TradingView charts in my analysis.
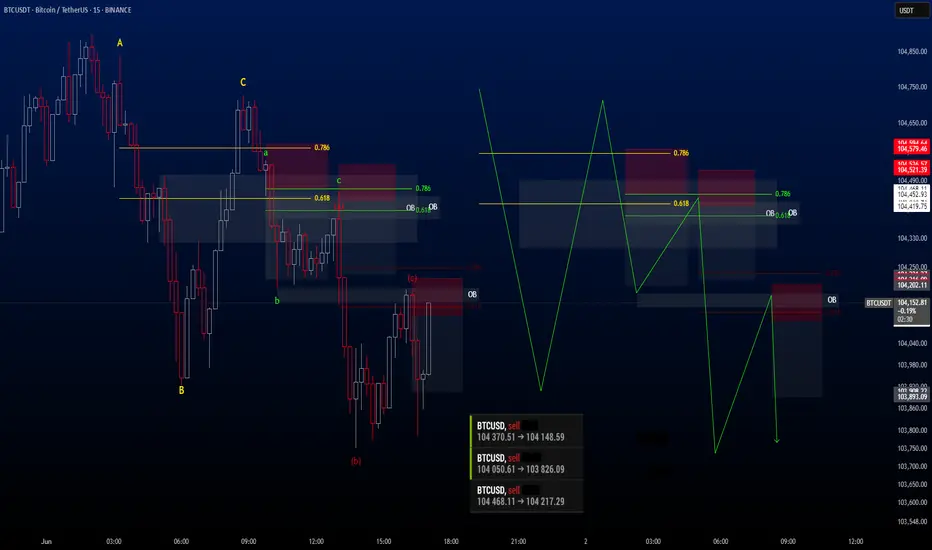
Strategy & Education: Trading with Fibonacci and Order Blocks🔍 Trading Strategy Based on Fibonacci Levels and Order Blocks
This chart showcases three consecutive sell trades I executed on the BTCUSDT pair, each resulting in a profitable outcome. The purpose of this explanation is to demonstrate how Fibonacci retracement levels can be combined with Order Block zones to identify high-probability trade setups.
🧩 The Foundation: Understanding Price Retracement Behavior
The ABC, abc, and (a)(b)(c) structures marked on the chart are not Elliott Waves. Instead, these labels are used to represent simple retracement movements in the market. The focus here is not wave theory, but recognizing how price reacts and pulls back after a move, and how we can benefit from these reactions.
📌 Trade 1: Primary Fibo-OB Confluence
I drew a Fibonacci retracement from the A wave to the B wave.
The price then retraced to the C area, landing between the 0.618 and 0.786 Fibonacci levels, where an Order Block (OB) was also present.
This overlap created a strong technical and structural resistance zone.
I entered the first sell trade from this confluence.
📌 Trade 2: Internal Retracement and OB Alignment
Inside the first corrective move, a smaller abc pattern formed.
I applied Fibonacci again from small a to small b.
The c leg reached the same key Fibonacci zone (0.618–0.786) and overlapped with a second OB.
This confluence offered a second sell entry.
📌 Trade 3: Micro Structure – Same Logic Reapplied
I repeated the exact same logic one more time on a micro (a)(b)(c) structure.
Fibonacci from (a) to (b), price touched 0.618–0.786, coinciding again with an OB.
This became the third and final sell position.
🧠 The Logic Behind the Strategy:
Price doesn’t move in straight lines—it flows in waves. During pullbacks, if Fibonacci levels align with Order Block zones, the market tends to react strongly. My focus here was to identify these areas of confluence in advance and enter trades at high-probability turning points.